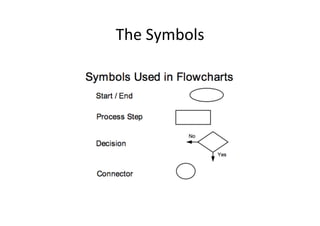
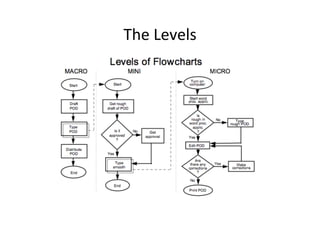
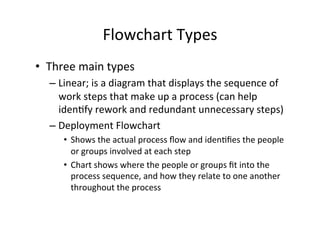
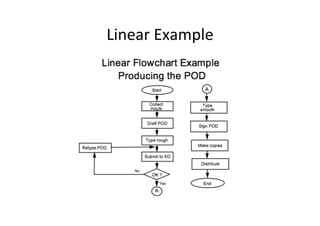
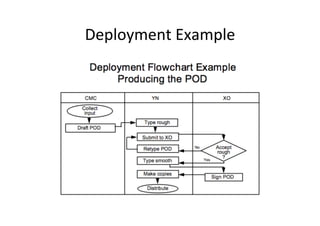
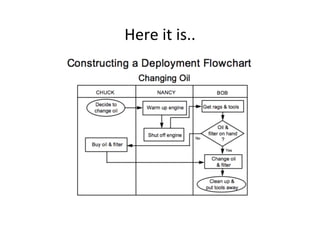
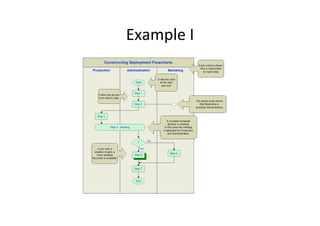
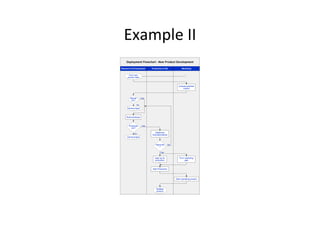
Flow	
  Chart	
  
What	
  is	
  a	
  Flowchart	
  
•  Is	
  a	
  diagram	
  that	
  uses	
  graphic	
  symbols	
  to	
  
   represent	
  the	
  nature	
  and	
  flow	
  of	
  the	
  steps	
  in	
  a	
  
   process	
  
When	
  Should	
  Use	
  It?	
  
•  At	
  the	
  beginning	
  of	
  your	
  process	
  improvement	
  
   efforts	
  
•  Understanding	
  of	
  a	
  process	
  by	
  explaining	
  the	
  
   steps	
  pictorially	
  (illustrated)	
  
When	
  Should	
  Use	
  It?	
  
•  Because	
  the	
  visually	
  sequence	
  steps,	
  it	
  can	
  be	
  
   very	
  helpful	
  in	
  training	
  the	
  employees	
  
   according	
  to	
  standardized	
  procedures	
  
•  IdenHfy	
  process	
  improvement;	
  once	
  you	
  break	
  
   down	
  the	
  process,	
  problem	
  areas	
  become	
  
   more	
  visible	
  
When	
  Should	
  Use	
  It?	
  
•  Easy	
  to	
  spot	
  redundant	
  steps	
  and	
  rework	
  
   loops	
  
•  Helping	
  the	
  process	
  workers	
  to	
  understand	
  
   who	
  their	
  customer	
  are,	
  and	
  how	
  they	
  may	
  
   someHmes	
  act	
  as	
  suppliers	
  and	
  someHmes	
  as	
  
   customers	
  in	
  relaHons	
  to	
  other	
  people	
  
QuesHon!	
  
•  What	
  is	
  a	
  Flowchart?	
  
QuesHon!	
  
•  Benefits	
  of	
  Flowchart?	
  
What	
  Symbols	
  are	
  Used?	
  
•  Symbols	
  have	
  specific	
  meanings	
  and	
  are	
  
   connected	
  by	
  arrows	
  indicaHng	
  the	
  flow	
  from	
  
   one	
  step	
  to	
  another	
  
   – Oval;	
  starHng	
  point	
  
   – Box;	
  acHvity	
  in	
  the	
  process	
  
   – Diamond;	
  decision	
  point	
  
   – Circle;	
  parHcular	
  step	
  is	
  connected	
  to	
  another	
  
     page	
  
What	
  are	
  the	
  level	
  of	
  Flowchart	
  
                        Detail?	
  
•  Consider	
  how	
  it	
  will	
  be	
  used	
  and	
  the	
  amount	
  
   and	
  kind	
  of	
  informaHon	
  needed	
  by	
  the	
  people	
  
   who	
  will	
  use	
  it	
  
    – Macro	
  level;	
  big	
  picture	
  
    – Mini;	
  focus	
  on	
  only	
  a	
  part	
  of	
  macro-­‐level	
  
    – Micro;	
  people	
  trying	
  to	
  improve	
  the	
  way	
  a	
  job	
  is	
  
      done	
  (very	
  detailed),	
  documenHng	
  every	
  acHon	
  
      and	
  decision	
  
The	
  Symbols	
  
The	
  Levels	
  
How	
  Do	
  We	
  Get	
  Started?	
  
•  Determine	
  what	
  you	
  expect	
  to	
  get	
  from	
  the	
  
   Flowchart	
  
•  IdenHfy	
  who	
  will	
  use	
  it	
  and	
  how	
  
•  Define	
  the	
  level	
  of	
  detail	
  you	
  need	
  
Boundaries!	
  
•  These	
  are	
  the	
  starHng	
  and	
  ending	
  points	
  for	
  
   your	
  Flowchart	
  
•  E.g.	
  for	
  repair	
  shop	
  for	
  pump;	
  might	
  start	
  
   when	
  pump	
  enters	
  the	
  shop	
  and	
  when	
  it	
  
   passes	
  final	
  tesHng	
  
•  Boundaries	
  determine	
  the	
  number	
  of	
  
   acHviHes	
  to	
  be	
  studied	
  and	
  the	
  number	
  of	
  
   people	
  involved	
  in	
  the	
  process,	
  funcHonally	
  
   and	
  cross-­‐funcHonally	
  
What	
  are	
  the	
  keys	
  to	
  successful	
  
                    flowcharHng	
  
•  It	
  is	
  vital	
  that	
  you	
  start	
  by	
  depicHng	
  the	
  
   process	
  the	
  way	
  it	
  really	
  works	
  
•  You	
  need	
  to	
  chart	
  the	
  process	
  as	
  it	
  is	
  
The	
  Success	
  
•  Start	
  with	
  the	
  BIG	
  Picture	
  
    – It	
  is	
  best	
  to	
  draw	
  the	
  macro	
  level	
  first,	
  then	
  
      increased	
  levels	
  of	
  detail	
  
•  Observe	
  the	
  current	
  process	
  (in	
  actual	
  
   operaHon)	
  
•  Record	
  the	
  process	
  steps	
  you	
  observed	
  
•  Arrange	
  the	
  sequence	
  of	
  steps	
  
•  Draw	
  the	
  flowchart	
  
QuesHon!	
  
•  The	
  Key	
  Success?	
  
Flowchart	
  Types	
  
•  Three	
  main	
  types	
  
    – Linear;	
  is	
  a	
  diagram	
  that	
  displays	
  the	
  sequence	
  of	
  
      work	
  steps	
  that	
  make	
  up	
  a	
  process	
  (can	
  help	
  
      idenHfy	
  rework	
  and	
  redundant	
  unnecessary	
  steps)	
  
    – Deployment	
  Flowchart	
  
        •  Shows	
  the	
  actual	
  process	
  flow	
  and	
  idenHfies	
  the	
  people	
  
           or	
  groups	
  involved	
  at	
  each	
  step	
  
        •  Chart	
  shows	
  where	
  the	
  people	
  or	
  groups	
  fit	
  into	
  the	
  
           process	
  sequence,	
  and	
  how	
  they	
  relate	
  to	
  one	
  another	
  
           throughout	
  the	
  process	
  
Flowchart	
  Types	
  
•  The	
  last	
  one:	
  
    – Opportunity	
  Flowchart	
  
         •  VariaHons	
  of	
  the	
  basic	
  linear	
  type	
  
              – Value	
  added	
  steps;	
  	
  
              – Cost	
  added	
  only;	
  	
  
Linear	
  Example	
  
Deployment	
  Example	
  
How	
  to	
  Construct	
  a	
  Linear	
  
•  Define	
  the	
  process	
  to	
  be	
  flowcharted	
  
•  Assemble	
  the	
  right	
  people	
  (actually	
  involved	
  
   in	
  the	
  process)	
  
•  Establish	
  process	
  boundaries	
  (starHng	
  and	
  
   ending	
  points)	
  
•  List	
  the	
  steps,	
  acHviHes,	
  and	
  decisions	
  to	
  be	
  
   charted	
  
How	
  to	
  Construct	
  a	
  Linear	
  
•  Put	
  the	
  steps	
  in	
  chronological	
  sequence	
  
   (might	
  form	
  the	
  last	
  to	
  the	
  first)	
  
•  Assign	
  flowchart	
  symbols	
  such	
  as	
  boxes,	
  
   diamonds	
  
•  Review	
  and	
  Htle	
  the	
  flowchart	
  
ConstrucHng	
  a	
  Linear	
  Flowchart	
  
How	
  do	
  we	
  construct	
  a	
  Deployment	
  
                      Flowchart?	
  
•  Follow	
  the	
  basic	
  steps	
  for	
  construcHng	
  a	
  
   Linear	
  Flowchart,	
  but	
  modify	
  them	
  as	
  follows:	
  
    – List	
  the	
  major	
  steps	
  of	
  the	
  process	
  verHcally	
  on	
  
      the	
  le_	
  side	
  of	
  a	
  sheet	
  of	
  paper	
  
    – List	
  the	
  responsible	
  process	
  workers	
  across	
  the	
  
      top,	
  each	
  in	
  a	
  separate	
  column	
  
    – Place	
  each	
  step	
  in	
  the	
  appropriate	
  column	
  under	
  
      the	
  responsible	
  process	
  worker’s	
  name	
  
    – Connect	
  the	
  steps	
  in	
  the	
  order	
  in	
  which	
  they	
  
      relate	
  to	
  each	
  other	
  
                                       NOTE:	
  
                                       EveryhorizontallineinaDeploymentFlowchar9
                                       den9fiesacustomer-­‐supplier	
  rela9onship.	
  
Here	
  it	
  is..	
  
Example	
  I	
  
Example	
  II	
  
Class	
  PracHce!!	
  

Flow chart

  • 1.
  • 2.
    What  is  a  Flowchart   •  Is  a  diagram  that  uses  graphic  symbols  to   represent  the  nature  and  flow  of  the  steps  in  a   process  
  • 3.
    When  Should  Use  It?   •  At  the  beginning  of  your  process  improvement   efforts   •  Understanding  of  a  process  by  explaining  the   steps  pictorially  (illustrated)  
  • 4.
    When  Should  Use  It?   •  Because  the  visually  sequence  steps,  it  can  be   very  helpful  in  training  the  employees   according  to  standardized  procedures   •  IdenHfy  process  improvement;  once  you  break   down  the  process,  problem  areas  become   more  visible  
  • 5.
    When  Should  Use  It?   •  Easy  to  spot  redundant  steps  and  rework   loops   •  Helping  the  process  workers  to  understand   who  their  customer  are,  and  how  they  may   someHmes  act  as  suppliers  and  someHmes  as   customers  in  relaHons  to  other  people  
  • 6.
    QuesHon!   •  What  is  a  Flowchart?  
  • 7.
    QuesHon!   •  Benefits  of  Flowchart?  
  • 8.
    What  Symbols  are  Used?   •  Symbols  have  specific  meanings  and  are   connected  by  arrows  indicaHng  the  flow  from   one  step  to  another   – Oval;  starHng  point   – Box;  acHvity  in  the  process   – Diamond;  decision  point   – Circle;  parHcular  step  is  connected  to  another   page  
  • 9.
    What  are  the  level  of  Flowchart   Detail?   •  Consider  how  it  will  be  used  and  the  amount   and  kind  of  informaHon  needed  by  the  people   who  will  use  it   – Macro  level;  big  picture   – Mini;  focus  on  only  a  part  of  macro-­‐level   – Micro;  people  trying  to  improve  the  way  a  job  is   done  (very  detailed),  documenHng  every  acHon   and  decision  
  • 10.
  • 11.
  • 12.
    How  Do  We  Get  Started?   •  Determine  what  you  expect  to  get  from  the   Flowchart   •  IdenHfy  who  will  use  it  and  how   •  Define  the  level  of  detail  you  need  
  • 13.
    Boundaries!   •  These  are  the  starHng  and  ending  points  for   your  Flowchart   •  E.g.  for  repair  shop  for  pump;  might  start   when  pump  enters  the  shop  and  when  it   passes  final  tesHng   •  Boundaries  determine  the  number  of   acHviHes  to  be  studied  and  the  number  of   people  involved  in  the  process,  funcHonally   and  cross-­‐funcHonally  
  • 14.
    What  are  the  keys  to  successful   flowcharHng   •  It  is  vital  that  you  start  by  depicHng  the   process  the  way  it  really  works   •  You  need  to  chart  the  process  as  it  is  
  • 15.
    The  Success   • Start  with  the  BIG  Picture   – It  is  best  to  draw  the  macro  level  first,  then   increased  levels  of  detail   •  Observe  the  current  process  (in  actual   operaHon)   •  Record  the  process  steps  you  observed   •  Arrange  the  sequence  of  steps   •  Draw  the  flowchart  
  • 16.
    QuesHon!   •  The  Key  Success?  
  • 17.
    Flowchart  Types   • Three  main  types   – Linear;  is  a  diagram  that  displays  the  sequence  of   work  steps  that  make  up  a  process  (can  help   idenHfy  rework  and  redundant  unnecessary  steps)   – Deployment  Flowchart   •  Shows  the  actual  process  flow  and  idenHfies  the  people   or  groups  involved  at  each  step   •  Chart  shows  where  the  people  or  groups  fit  into  the   process  sequence,  and  how  they  relate  to  one  another   throughout  the  process  
  • 18.
    Flowchart  Types   • The  last  one:   – Opportunity  Flowchart   •  VariaHons  of  the  basic  linear  type   – Value  added  steps;     – Cost  added  only;    
  • 19.
  • 20.
  • 21.
    How  to  Construct  a  Linear   •  Define  the  process  to  be  flowcharted   •  Assemble  the  right  people  (actually  involved   in  the  process)   •  Establish  process  boundaries  (starHng  and   ending  points)   •  List  the  steps,  acHviHes,  and  decisions  to  be   charted  
  • 22.
    How  to  Construct  a  Linear   •  Put  the  steps  in  chronological  sequence   (might  form  the  last  to  the  first)   •  Assign  flowchart  symbols  such  as  boxes,   diamonds   •  Review  and  Htle  the  flowchart  
  • 23.
  • 24.
    How  do  we  construct  a  Deployment   Flowchart?   •  Follow  the  basic  steps  for  construcHng  a   Linear  Flowchart,  but  modify  them  as  follows:   – List  the  major  steps  of  the  process  verHcally  on   the  le_  side  of  a  sheet  of  paper   – List  the  responsible  process  workers  across  the   top,  each  in  a  separate  column   – Place  each  step  in  the  appropriate  column  under   the  responsible  process  worker’s  name   – Connect  the  steps  in  the  order  in  which  they   relate  to  each  other   NOTE:   EveryhorizontallineinaDeploymentFlowchar9 den9fiesacustomer-­‐supplier  rela9onship.  
  • 25.
  • 26.
  • 27.
  • 28.