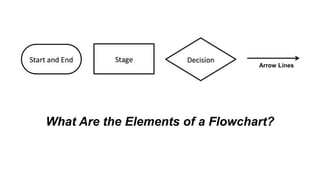
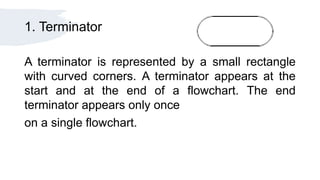
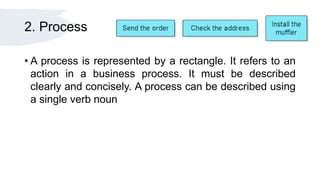
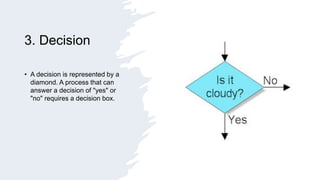
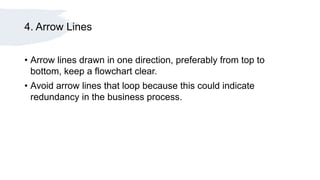
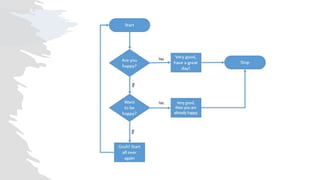
Prepare and Interpret
Technical Drawing
Technical Drawing
• also known as an engineering drawing, is a
detailed, precise diagram or plan that conveys
information about how an object functions or
is constructed. Engineers, electricians, and
contractors all use these drawings as guides
when constructing or repairing objects and
buildings.
Flowchart
• A flowchart is a diagram that uses graphic
symbols to depict the nature and flow of the steps
in a process. Another name for this tool is "flow
diagram."
What Are the Elements of a Flowchart?
Arrow Lines
1. Terminator
A terminator is represented by a small rectangle
with curved corners. A terminator appears at the
start and at the end of a flowchart. The end
terminator appears only once
on a single flowchart.
2. Process
• A process is represented by a rectangle. It refers to an
action in a business process. It must be described
clearly and concisely. A process can be described using
a single verb noun
3. Decision
• A decision is represented by a
diamond. A process that can
answer a decision of "yes" or
"no" requires a decision box.
4. Arrow Lines
• Arrow lines drawn in one direction, preferably from top to
bottom, keep a flowchart clear.
• Avoid arrow lines that loop because this could indicate
redundancy in the business process.
Prepare and Interpret Technical Drawing.pptx

Prepare and Interpret Technical Drawing.pptx

  • 1.
  • 2.
    Technical Drawing • alsoknown as an engineering drawing, is a detailed, precise diagram or plan that conveys information about how an object functions or is constructed. Engineers, electricians, and contractors all use these drawings as guides when constructing or repairing objects and buildings.
  • 3.
    Flowchart • A flowchartis a diagram that uses graphic symbols to depict the nature and flow of the steps in a process. Another name for this tool is "flow diagram."
  • 4.
    What Are theElements of a Flowchart? Arrow Lines
  • 5.
    1. Terminator A terminatoris represented by a small rectangle with curved corners. A terminator appears at the start and at the end of a flowchart. The end terminator appears only once on a single flowchart.
  • 6.
    2. Process • Aprocess is represented by a rectangle. It refers to an action in a business process. It must be described clearly and concisely. A process can be described using a single verb noun
  • 7.
    3. Decision • Adecision is represented by a diamond. A process that can answer a decision of "yes" or "no" requires a decision box.
  • 9.
    4. Arrow Lines •Arrow lines drawn in one direction, preferably from top to bottom, keep a flowchart clear. • Avoid arrow lines that loop because this could indicate redundancy in the business process.

Editor's Notes

  • #3 he act and discipline of composing drawings that visually communicate how something functions or is constructed. TD it can be two dimensional or 3 dimensional and can be drawn to sacle by hand or prepared using Computer aided design (CAD) software.
  • #4 Before we proceed to CAD We should know about creating a Flowchart. type of diagram that represents a workflow or process. a step-by-step approach to solving a task. The flowchart shows the steps as boxes of various kinds, and their order by connecting 
  • #5 Common used in creating Flowchart. 1. Terminator 2. Process 3. Decision 4. Connector
  • #6 This shape tells you where the flowchart begins and ends. t shows the entry point of your flowchart and the exit point.  Ex. Start, begin end exit return
  • #7 the rectangle is the most common shape. It is used to show a process, task, action, or operation. It shows something that has to be done or an action that has to be taken. The text in the rectangle almost always includes a verb.
  • #8 A decision asks a question. The answer to the question determines which arrow you follow out of the decision shape. For example, in the shape below, if it is cloudy, you follow the arrow down near the word Yes. If it is not cloudy, you follow the arrow to the right near the word No.
  • #10 The lines with arrows determine the flow through the chart. Flowcharts are usually drawn from top to bottom or left to right