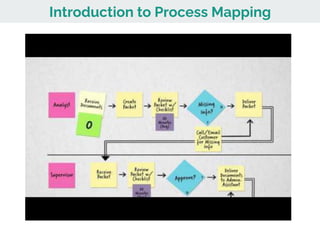
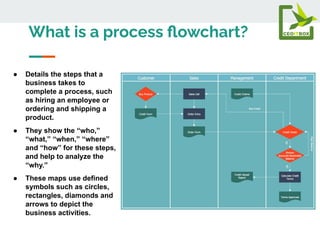
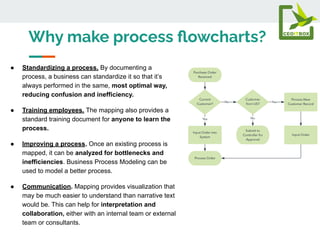
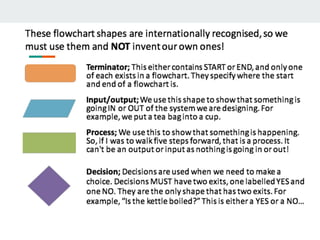
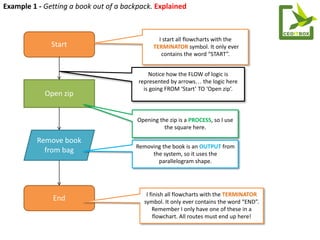
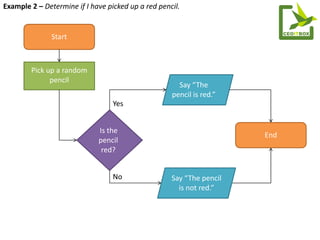
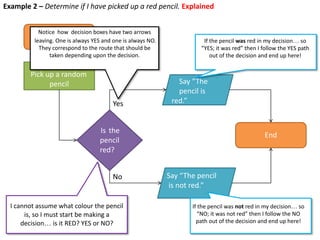
This document provides an introduction to process mapping and flowcharts. It discusses what process flowcharts are, why businesses create them, and examples of common flowchart symbols and structures. The key points are:
- Process flowcharts visually depict the steps, decisions, and stakeholders involved in a business process using standard symbols.
- Businesses create flowcharts to standardize processes, train employees, improve efficiencies, and facilitate communication.
- Examples show basic flowchart components like start/end points, processes, decisions, and loops to represent process logic.
How Process Mapping Can Streamline Your Business Tips and Best PracticesKashish Trivedi
Process mapping involves visually mapping out all the steps in a business process to identify inefficiencies, improve communication, and simplify processes. It can be done with pen and paper or digital tools. The document discusses the benefits of process mapping, different types of maps, best practices for creating maps, and concludes by encouraging the reader to start mapping their own processes.
Flowcharts are diagrams that use graphic symbols to depict the steps in a process. They can be used to clearly show the flow of services within a hospital from admission to patient satisfaction. Flowcharts have several benefits, such as promoting understanding of processes, providing a training tool, and identifying areas for process improvement. They involve determining the key people, process steps, and level of detail needed. Different types of flowcharts convey different levels of information, from a high-level overview to granular micro-level details of specific tasks. Proper interpretation of a flowchart allows one to evaluate who is involved, potential causes of issues, and opportunities for simplifying or changing the process.
A Step-by-Step Guide to Creating an Effective Swim Lane DiagramLizzyManz
Process mapping is almost always beneficial to those working within the process, and those working outside it. Not all processes should be mapped in the same way. A simple process run by only one or two people can be easily represented by a basic flow chart; a process that involves multiple individuals or cross-functional teams is going to need something more complex.
A flowchart is a diagram that uses defined graphic symbols to represent the sequential steps of a process, and it can be used to describe manufacturing, administrative, or project processes. Flowcharts are constructed by defining the process boundaries, brainstorming activities, arranging activities in sequence, and drawing arrows to show flow, and they should involve people who perform the process. Flowchart symbols commonly used include terminators, connectors, processes, inputs/outputs, and decisions.
CPAP.com Introduction to Flowcharts and Process Designjohnnygoodman
This document introduces flowcharts and process design. It defines a flowchart as a diagram that represents an algorithm or process using symbols like boxes, circles, and arrows to show the steps and their order. Flowcharts can help describe complex processes simply and visualize problems. The document discusses when to use and avoid flowcharts, and provides tips for creating basic flowcharts using standard symbols like states, processes, decisions, and connectors. It also discusses refining flowcharts by adjusting scope and detail level or breaking into multiple diagrams.
Explanation of the seven basic tools used to solve a variety of quality-related issues. They are suitable for people with little formal training in statistics.
Loft9 BusinessInsights HassleMap 10.7.16Liz Carter
The document discusses hassle maps, which are a tool used to visualize the customer experience and identify points of friction. Hassle maps start with a current state process map and then overlay customer pain points to illustrate areas for improvement. They can range from simple single page maps to more complex cross-organizational maps. The document provides guidance on creating both simple and complex hassle maps, and examples are given of how hassle maps have been used to drive organizational improvements.
What is a Workflow A Beginners Guide to Workflow ManagementKashish Trivedi
If you look at Google’s front page for “what is a workflow,” the first result is literally the dictionary definition.“The sequence of industrial, administrative, or other processes through which a piece of work passes from initiation to completion.” Then you have Kissflow’s definition, which isn’t any clearer. “A sequence of tasks that processes data through a specific path from initiation to completion.” And then there’s, well, this page. And how do we define a workflow? A workflow is how you get work done.Now we’re getting somewhere.
An introduction and guide to building your own roadmaps. It covers what a roadmap is, why you need one, the parts of a roadmap, and the creation process.
3 Ideas to Improve 'Process Improvement'gilesjohnston
This presentation is the annotated version of a talk given at the South Tyneside Manufacturing Forum event in September 2012.
The theme of the presentations was 'business improvement' and this section, process improvement, covered three ideas that many businesses miss out on that can significantly improve the results gained from undertaking process improvement projects.
Have you found yourself suddenly saddled with management duties? When you are a manager, not only are you responsible for your own tasks, but you are also on the line for the tasks of those you manage. Like everything else, management is a skill that has to be learned.
This can be an overwhelming task, especially when you are trying to balance your work and personal life or even several projects. You need to keep getting things done and move your projects forward.
This document provides guidance on developing standard operating procedures (SOPs) for cannabis cultivation. It discusses defining systems, procedures, and steps, and provides examples of each. Systems refer to broad cultivation areas, procedures are specific tasks within each system, and steps are the individual instructions. The document recommends choosing simple steps, hierarchical steps, flowcharts or graphics as the SOP format depending on the complexity of the process. It outlines the basic process for developing, reviewing, testing, implementing and training employees on new SOPs.
Interactive workshop: how to capture and visualize business process (NYBPP Me...Samuel Chin, PMP, CSM
It's easy to get caught up in the day-to-day of what we’re doing at work. But is our routine as efficient as it could be? Is our business or business unit running efficiently? Buzzwords like “optimize” and “streamline” make their way around offices today. However, before we can do anything to change our current workflows, we must understand what’s already in place.
In this interactive workshop, we discussed how to capture and visualize process with senior members of the Cavi team! In this meetup, we went through the Cavi framework for visualizing process information. We understood what process really is, how to simplify it, and how to capture it on paper. Participants had a chance to ask questions and practice drawing some process maps (pen and paper provided). And we ended up the session with review and editing of our work.
How to set up an SEO forecast for free using excelMarie Turner
Marie Turner, an SEO specialist at Vertical Leap, shows you how to set up data benchmarking and forecasting to help your data reports become mroe meaningful.
How do you validate that your startup is solving a real problem for real customers? How to build a tight, cross-functional, disciplined team to develop and ship your MVP as quickly as possible? How do you deal with competitors, and turn competition into an advantage. This version was delivered at Product School on September 15, 2016.
This document discusses Philip Crosby's quality management maturity grid tool. The grid assesses an organization's quality management maturity across six categories on a scale from "Uncertainty" to "Certainty." Assessors use the grid to evaluate where the organization stands in each category. The total score indicates the overall quality management maturity level and can help identify areas for improvement. The document also briefly describes four common quality management tools: check sheets, control charts, Pareto charts, and scatter plots.
This document outlines 5 key steps to establishing a smooth workflow using an agile approach: 1) Establish the workflow by mapping out major processes and stages, 2) Define policies for each stage, 3) Visualize work by adding cards for features and tasks, 4) Define work-in-progress limits for stages, and 5) Continuously improve by reviewing metrics and looking for areas of improvement. Following these steps helps minimize bottlenecks, focus work, and continuously refine the workflow.
Mangt tool with statistical process control ch 18 asif jamalAsif Jamal
It is basic way to understand Total Quality Management
Tools & Procedures of CI
Varies from simple suggestion system based on brain storming to structured programs utilizing statistical process control tools (SPC Tools)
Deming wheel (PDCA) cycle
Zero defect concept
Bench Marking
Six sigma
Kaizen
Process Mapping and Process Improvement for the Small Business OwnerMichiko Diby
This is a low-key, simple presentation for the small business owner.
Use this method to get a visual on bottlenecks, and create new processes that make work productive and fun.
This document provides a 7-step process for small business owners to map and improve their business processes. The steps include: 1) describing current pain points, 2) visualizing goals, 3) creating a process map with actors, steps, and decisions, 4) identifying problem areas, 5) analyzing the map for unnecessary steps, 6) designing an improved process map, and 7) implementing and adapting the new process. An example is provided of a company that was able to reduce invoice processing time from 2 weeks to 2 days by streamlining approval processes and delegating approval using this method. Process mapping is presented as a way for companies to visualize opportunities to improve efficiency and productivity.
This document summarizes common analytic mistakes made in business intelligence projects. It discusses mistakes such as not asking the right questions, focusing on past metrics rather than future needs, misunderstanding metrics and their methodology, bottlenecking the value of analytics to the organization, overvaluing data visualization, compromising data through consensus, confusing insight with the ability to take action, and more. The document provides examples and recommendations to avoid these common mistakes in analytics projects.
Managing Screen Printers, Part 2: Standard ProceduresPrintavo
In Part 1 of Managing Screen Printers, we discussed why a culture of accountability is so important for your screen printing shop. Now that you understand the basics of a culture of accountability, it's time to create standardized procedures as the backbone of your shop's processes.
This is where the rubber meets the road: you are actually building systems for accountability and creating replicable steps for your screen printers to follow.
Try Printavo for free: https://www.printavo.com
Maintaining operational efficiency in an expanding business is a challenge for many companies today. It is not immediately obvious that the inefficiencies are hurting the business. However, small mistakes that lead to time and money lost become more frequent as the business hires more employees and takes on more work. Use this methodology to work through those sticking points that are holding your operations back.
Software Development Life CyclesPresented byBrenda Reynold.docxrosemariebrayshaw
The document is a presentation on software development life cycles (SDLC) given to employees of We Love Video, Inc. regarding the implementation of a new Customer Relationship Management (CRM) system. The presenter discusses the Waterfall and Agile SDLC methodologies, ultimately recommending the Agile approach for the CRM project due to its iterative nature which allows for flexibility and feedback from stakeholders. Key benefits of the Agile methodology highlighted include the ability to adapt to changing requirements and receive feedback to guide further development.
This document provides an overview of seven quality control tools: cause and effect diagrams, flow charts, check sheets, histograms, Pareto charts, control charts, and scatter diagrams. It describes each tool's purpose, how to construct or use it, and its benefits. Cause and effect diagrams help identify possible causes for problems and organize them into categories. Flow charts visually map out processes to identify areas for improvement. Check sheets systematically collect and organize data. Histograms show the distribution of data values. [END SUMMARY]
Process mapping: 10 Steps to Getting it Right the First TimeRobert Fantina
1. Process mapping involves documenting the steps in a process using sticky notes on a wall to map out the workflow with subject matter experts. This helps reveal inconsistencies and areas for improvement.
2. Key steps in process mapping include determining stakeholders, scheduling meetings, using sticky notes to map out tasks and decisions, numbering steps, and asking questions to validate the accuracy of the map.
3. Once the initial map is validated, it is photographed and digitized, and a follow up meeting ensures all feedback is incorporated before the map is considered complete. This forms the basis for further process analysis and improvement.
The Genesis of BriansClub.cm Famous Dark WEb PlatformSabaaSudozai
BriansClub.cm, a famous platform on the dark web, has become one of the most infamous carding marketplaces, specializing in the sale of stolen credit card data.
Storytelling is an incredibly valuable tool to share data and information. To get the most impact from stories there are a number of key ingredients. These are based on science and human nature. Using these elements in a story you can deliver information impactfully, ensure action and drive change.
More Related Content
Similar to How to draw a process flowchart by CEOITBOX.pdf
What is a Workflow A Beginners Guide to Workflow ManagementKashish Trivedi
If you look at Google’s front page for “what is a workflow,” the first result is literally the dictionary definition.“The sequence of industrial, administrative, or other processes through which a piece of work passes from initiation to completion.” Then you have Kissflow’s definition, which isn’t any clearer. “A sequence of tasks that processes data through a specific path from initiation to completion.” And then there’s, well, this page. And how do we define a workflow? A workflow is how you get work done.Now we’re getting somewhere.
An introduction and guide to building your own roadmaps. It covers what a roadmap is, why you need one, the parts of a roadmap, and the creation process.
3 Ideas to Improve 'Process Improvement'gilesjohnston
This presentation is the annotated version of a talk given at the South Tyneside Manufacturing Forum event in September 2012.
The theme of the presentations was 'business improvement' and this section, process improvement, covered three ideas that many businesses miss out on that can significantly improve the results gained from undertaking process improvement projects.
Have you found yourself suddenly saddled with management duties? When you are a manager, not only are you responsible for your own tasks, but you are also on the line for the tasks of those you manage. Like everything else, management is a skill that has to be learned.
This can be an overwhelming task, especially when you are trying to balance your work and personal life or even several projects. You need to keep getting things done and move your projects forward.
This document provides guidance on developing standard operating procedures (SOPs) for cannabis cultivation. It discusses defining systems, procedures, and steps, and provides examples of each. Systems refer to broad cultivation areas, procedures are specific tasks within each system, and steps are the individual instructions. The document recommends choosing simple steps, hierarchical steps, flowcharts or graphics as the SOP format depending on the complexity of the process. It outlines the basic process for developing, reviewing, testing, implementing and training employees on new SOPs.
Interactive workshop: how to capture and visualize business process (NYBPP Me...Samuel Chin, PMP, CSM
It's easy to get caught up in the day-to-day of what we’re doing at work. But is our routine as efficient as it could be? Is our business or business unit running efficiently? Buzzwords like “optimize” and “streamline” make their way around offices today. However, before we can do anything to change our current workflows, we must understand what’s already in place.
In this interactive workshop, we discussed how to capture and visualize process with senior members of the Cavi team! In this meetup, we went through the Cavi framework for visualizing process information. We understood what process really is, how to simplify it, and how to capture it on paper. Participants had a chance to ask questions and practice drawing some process maps (pen and paper provided). And we ended up the session with review and editing of our work.
How to set up an SEO forecast for free using excelMarie Turner
Marie Turner, an SEO specialist at Vertical Leap, shows you how to set up data benchmarking and forecasting to help your data reports become mroe meaningful.
How do you validate that your startup is solving a real problem for real customers? How to build a tight, cross-functional, disciplined team to develop and ship your MVP as quickly as possible? How do you deal with competitors, and turn competition into an advantage. This version was delivered at Product School on September 15, 2016.
This document discusses Philip Crosby's quality management maturity grid tool. The grid assesses an organization's quality management maturity across six categories on a scale from "Uncertainty" to "Certainty." Assessors use the grid to evaluate where the organization stands in each category. The total score indicates the overall quality management maturity level and can help identify areas for improvement. The document also briefly describes four common quality management tools: check sheets, control charts, Pareto charts, and scatter plots.
This document outlines 5 key steps to establishing a smooth workflow using an agile approach: 1) Establish the workflow by mapping out major processes and stages, 2) Define policies for each stage, 3) Visualize work by adding cards for features and tasks, 4) Define work-in-progress limits for stages, and 5) Continuously improve by reviewing metrics and looking for areas of improvement. Following these steps helps minimize bottlenecks, focus work, and continuously refine the workflow.
Mangt tool with statistical process control ch 18 asif jamalAsif Jamal
It is basic way to understand Total Quality Management
Tools & Procedures of CI
Varies from simple suggestion system based on brain storming to structured programs utilizing statistical process control tools (SPC Tools)
Deming wheel (PDCA) cycle
Zero defect concept
Bench Marking
Six sigma
Kaizen
Process Mapping and Process Improvement for the Small Business OwnerMichiko Diby
This is a low-key, simple presentation for the small business owner.
Use this method to get a visual on bottlenecks, and create new processes that make work productive and fun.
This document provides a 7-step process for small business owners to map and improve their business processes. The steps include: 1) describing current pain points, 2) visualizing goals, 3) creating a process map with actors, steps, and decisions, 4) identifying problem areas, 5) analyzing the map for unnecessary steps, 6) designing an improved process map, and 7) implementing and adapting the new process. An example is provided of a company that was able to reduce invoice processing time from 2 weeks to 2 days by streamlining approval processes and delegating approval using this method. Process mapping is presented as a way for companies to visualize opportunities to improve efficiency and productivity.
This document summarizes common analytic mistakes made in business intelligence projects. It discusses mistakes such as not asking the right questions, focusing on past metrics rather than future needs, misunderstanding metrics and their methodology, bottlenecking the value of analytics to the organization, overvaluing data visualization, compromising data through consensus, confusing insight with the ability to take action, and more. The document provides examples and recommendations to avoid these common mistakes in analytics projects.
Managing Screen Printers, Part 2: Standard ProceduresPrintavo
In Part 1 of Managing Screen Printers, we discussed why a culture of accountability is so important for your screen printing shop. Now that you understand the basics of a culture of accountability, it's time to create standardized procedures as the backbone of your shop's processes.
This is where the rubber meets the road: you are actually building systems for accountability and creating replicable steps for your screen printers to follow.
Try Printavo for free: https://www.printavo.com
Maintaining operational efficiency in an expanding business is a challenge for many companies today. It is not immediately obvious that the inefficiencies are hurting the business. However, small mistakes that lead to time and money lost become more frequent as the business hires more employees and takes on more work. Use this methodology to work through those sticking points that are holding your operations back.
Software Development Life CyclesPresented byBrenda Reynold.docxrosemariebrayshaw
The document is a presentation on software development life cycles (SDLC) given to employees of We Love Video, Inc. regarding the implementation of a new Customer Relationship Management (CRM) system. The presenter discusses the Waterfall and Agile SDLC methodologies, ultimately recommending the Agile approach for the CRM project due to its iterative nature which allows for flexibility and feedback from stakeholders. Key benefits of the Agile methodology highlighted include the ability to adapt to changing requirements and receive feedback to guide further development.
This document provides an overview of seven quality control tools: cause and effect diagrams, flow charts, check sheets, histograms, Pareto charts, control charts, and scatter diagrams. It describes each tool's purpose, how to construct or use it, and its benefits. Cause and effect diagrams help identify possible causes for problems and organize them into categories. Flow charts visually map out processes to identify areas for improvement. Check sheets systematically collect and organize data. Histograms show the distribution of data values. [END SUMMARY]
Process mapping: 10 Steps to Getting it Right the First TimeRobert Fantina
1. Process mapping involves documenting the steps in a process using sticky notes on a wall to map out the workflow with subject matter experts. This helps reveal inconsistencies and areas for improvement.
2. Key steps in process mapping include determining stakeholders, scheduling meetings, using sticky notes to map out tasks and decisions, numbering steps, and asking questions to validate the accuracy of the map.
3. Once the initial map is validated, it is photographed and digitized, and a follow up meeting ensures all feedback is incorporated before the map is considered complete. This forms the basis for further process analysis and improvement.
Similar to How to draw a process flowchart by CEOITBOX.pdf (20)
The Genesis of BriansClub.cm Famous Dark WEb PlatformSabaaSudozai
BriansClub.cm, a famous platform on the dark web, has become one of the most infamous carding marketplaces, specializing in the sale of stolen credit card data.
Storytelling is an incredibly valuable tool to share data and information. To get the most impact from stories there are a number of key ingredients. These are based on science and human nature. Using these elements in a story you can deliver information impactfully, ensure action and drive change.
The Most Inspiring Entrepreneurs to Follow in 2024.pdfthesiliconleaders
In a world where the potential of youth innovation remains vastly untouched, there emerges a guiding light in the form of Norm Goldstein, the Founder and CEO of EduNetwork Partners. His dedication to this cause has earned him recognition as a Congressional Leadership Award recipient.
Unveiling the Dynamic Personalities, Key Dates, and Horoscope Insights: Gemin...my Pandit
Explore the fascinating world of the Gemini Zodiac Sign. Discover the unique personality traits, key dates, and horoscope insights of Gemini individuals. Learn how their sociable, communicative nature and boundless curiosity make them the dynamic explorers of the zodiac. Dive into the duality of the Gemini sign and understand their intellectual and adventurous spirit.
The Steadfast and Reliable Bull: Taurus Zodiac Signmy Pandit
Explore the steadfast and reliable nature of the Taurus Zodiac Sign. Discover the personality traits, key dates, and horoscope insights that define the determined and practical Taurus, and learn how their grounded nature makes them the anchor of the zodiac.
NIMA2024 | De toegevoegde waarde van DEI en ESG in campagnes | Nathalie Lam |...BBPMedia1
Nathalie zal delen hoe DEI en ESG een fundamentele rol kunnen spelen in je merkstrategie en je de juiste aansluiting kan creëren met je doelgroep. Door middel van voorbeelden en simpele handvatten toont ze hoe dit in jouw organisatie toegepast kan worden.
Best practices for project execution and deliveryCLIVE MINCHIN
A select set of project management best practices to keep your project on-track, on-cost and aligned to scope. Many firms have don't have the necessary skills, diligence, methods and oversight of their projects; this leads to slippage, higher costs and longer timeframes. Often firms have a history of projects that simply failed to move the needle. These best practices will help your firm avoid these pitfalls but they require fortitude to apply.
Call8328958814 satta matka Kalyan result satta guessing➑➌➋➑➒➎➑➑➊➍
Satta Matka Kalyan Main Mumbai Fastest Results
Satta Matka ❋ Sattamatka ❋ New Mumbai Ratan Satta Matka ❋ Fast Matka ❋ Milan Market ❋ Kalyan Matka Results ❋ Satta Game ❋ Matka Game ❋ Satta Matka ❋ Kalyan Satta Matka ❋ Mumbai Main ❋ Online Matka Results ❋ Satta Matka Tips ❋ Milan Chart ❋ Satta Matka Boss❋ New Star Day ❋ Satta King ❋ Live Satta Matka Results ❋ Satta Matka Company ❋ Indian Matka ❋ Satta Matka 143❋ Kalyan Night Matka..
Starting a business is like embarking on an unpredictable adventure. It’s a journey filled with highs and lows, victories and defeats. But what if I told you that those setbacks and failures could be the very stepping stones that lead you to fortune? Let’s explore how resilience, adaptability, and strategic thinking can transform adversity into opportunity.
Part 2 Deep Dive: Navigating the 2024 Slowdownjeffkluth1
Introduction
The global retail industry has weathered numerous storms, with the financial crisis of 2008 serving as a poignant reminder of the sector's resilience and adaptability. However, as we navigate the complex landscape of 2024, retailers face a unique set of challenges that demand innovative strategies and a fundamental shift in mindset. This white paper contrasts the impact of the 2008 recession on the retail sector with the current headwinds retailers are grappling with, while offering a comprehensive roadmap for success in this new paradigm.
HOW TO START UP A COMPANY A STEP-BY-STEP GUIDE.pdf46adnanshahzad
How to Start Up a Company: A Step-by-Step Guide Starting a company is an exciting adventure that combines creativity, strategy, and hard work. It can seem overwhelming at first, but with the right guidance, anyone can transform a great idea into a successful business. Let's dive into how to start up a company, from the initial spark of an idea to securing funding and launching your startup.
Introduction
Have you ever dreamed of turning your innovative idea into a thriving business? Starting a company involves numerous steps and decisions, but don't worry—we're here to help. Whether you're exploring how to start a startup company or wondering how to start up a small business, this guide will walk you through the process, step by step.
How are Lilac French Bulldogs Beauty Charming the World and Capturing Hearts....Lacey Max
“After being the most listed dog breed in the United States for 31
years in a row, the Labrador Retriever has dropped to second place
in the American Kennel Club's annual survey of the country's most
popular canines. The French Bulldog is the new top dog in the
United States as of 2022. The stylish puppy has ascended the
rankings in rapid time despite having health concerns and limited
color choices.”
Discover timeless style with the 2022 Vintage Roman Numerals Men's Ring. Crafted from premium stainless steel, this 6mm wide ring embodies elegance and durability. Perfect as a gift, it seamlessly blends classic Roman numeral detailing with modern sophistication, making it an ideal accessory for any occasion.
https://rb.gy/usj1a2
𝐔𝐧𝐯𝐞𝐢𝐥 𝐭𝐡𝐞 𝐅𝐮𝐭𝐮𝐫𝐞 𝐨𝐟 𝐄𝐧𝐞𝐫𝐠𝐲 𝐄𝐟𝐟𝐢𝐜𝐢𝐞𝐧𝐜𝐲 𝐰𝐢𝐭𝐡 𝐍𝐄𝐖𝐍𝐓𝐈𝐃𝐄’𝐬 𝐋𝐚𝐭𝐞𝐬𝐭 𝐎𝐟𝐟𝐞𝐫𝐢𝐧𝐠𝐬
Explore the details in our newly released product manual, which showcases NEWNTIDE's advanced heat pump technologies. Delve into our energy-efficient and eco-friendly solutions tailored for diverse global markets.
3 Simple Steps To Buy Verified Payoneer Account In 2024SEOSMMEARTH
Buy Verified Payoneer Account: Quick and Secure Way to Receive Payments
Buy Verified Payoneer Account With 100% secure documents, [ USA, UK, CA ]. Are you looking for a reliable and safe way to receive payments online? Then you need buy verified Payoneer account ! Payoneer is a global payment platform that allows businesses and individuals to send and receive money in over 200 countries.
If You Want To More Information just Contact Now:
Skype: SEOSMMEARTH
Telegram: @seosmmearth
Gmail: seosmmearth@gmail.com
The APCO Geopolitical Radar - Q3 2024 The Global Operating Environment for Bu...APCO
The Radar reflects input from APCO’s teams located around the world. It distils a host of interconnected events and trends into insights to inform operational and strategic decisions. Issues covered in this edition include:
3. What is a process flowchart?
● Details the steps that a
business takes to
complete a process, such
as hiring an employee or
ordering and shipping a
product.
● They show the “who,”
“what,” “when,” “where”
and “how” for these steps,
and help to analyze the
“why.”
● These maps use defined
symbols such as circles,
rectangles, diamonds and
arrows to depict the
business activities.
4. Why make process flowcharts?
● Standardizing a process. By documenting a
process, a business can standardize it so that it’s
always performed in the same, most optimal way,
reducing confusion and inefficiency.
● Training employees. The mapping also provides a
standard training document for anyone to learn the
process.
● Improving a process. Once an existing process is
mapped, it can be analyzed for bottlenecks and
inefficiencies. Business Process Modeling can be
used to model a better process.
● Communication. Mapping provides visualization that
may be much easier to understand than narrative text
would be. This can help for interpretation and
collaboration, either with an internal team or external
team or consultants.
5.
6. Start
Example 1 - Getting a book out of a backpack.
Open zip
Remove book
from bag
End
7. Start
Example 1 - Getting a book out of a backpack. Explained
Open zip
Remove book
from bag
End
I start all flowcharts with the
TERMINATOR symbol. It only ever
contains the word “START”.
I finish all flowcharts with the TERMINATOR
symbol. It only ever contains the word “END”.
Remember I only have one of these in a
flowchart. All routes must end up here!
Opening the zip is a PROCESS, so I use
the square here.
Removing the book is an OUTPUT from
the system, so it uses the
parallelogram shape.
Notice how the FLOW of logic is
represented by arrows… the logic here
is going FROM ‘Start’ TO ‘Open zip’.
8. Start
Example 2 – Determine if I have picked up a red pencil.
Pick up a random
pencil
End
Is the
pencil
red?
Say “The
pencil is red.”
Yes
No Say “The pencil
is not red.”
9. Example 2 – Determine if I have picked up a red pencil. Explained
End
Is the
pencil
red?
Yes
No
I cannot assume what colour the pencil
is, so I must start be making a
decision… is it RED? YES or NO?
Notice
t
how
t
decision boxes have two arrows
leaving. One is always YES and one is always NO.
They correspond to the route that should be
taken depending upon the decision.
Pick up a random
pencil
If the pencil was red in my decision… so
“YES; it was red” then I follow the YES path
out of the decision and end up here!
Say “The
pencil is
red.”
Say “The pencil
is not red.”
If the pencil was not red in my decision… so
“NO; it was not red” then I follow the NO
path out of the decision and end up here!
10. Start
Example 3 – Determine if a kettle has boiled. If so, pour the water into a cup.
Turn on the kettle
End
Has the
kettle
boiled?
Pour water
into cup
Yes
No
11. Start
Example 3 – Determine if a kettle has boiled. If so, pour the water into a cup. Explained
Turn on the kettle
End
Has the
kettle
boiled?
Pour water
into cup
Yes
No
If the kettle has not boiled… can we continue with our process? NO!
So we must LOOP until it has boiled. Quite simply here we
continuously check to see if the kettle has boiled. This loops stops us
pouring cold water into a cup which is incorrect logic!
When the kettle has boiled, we can escape the loop
because the process may now continue: “YES; the
kettle has boiled”.
12. How to draw flowcharts?
Google Drawings
You can easily create, share, and
edit drawings online with Google
Drawings. Here are a few specific
things you can do:
● Edit chartsdrawings online with
anyone you choose.
● Publish drawings online to the
world as images, or download
them.
● Insert text, shapes, arrows,
scribbles, and images from your
hard drive or from the Web.
● Insert drawings into other Google
Docs, Sheets, or Slides using the
web clipboard, then tweak them
inline. drawings.google.com
Access this at itbx.in/fct
13. Using Flowcharts in Project Planning
In supply chain management, understanding
both inbound (request/ordering) and outbound
(delivery) logistics is crucial to the project.
The following simple steps provide a guide for
using flowcharts to formulate a project work
plan, using a medical supply chain as an
example.
13
14. Step 1. Understand the overall work flow
Start by identifying the organizational structure or
departments involved in the process.
For example, in Tanzania, medication was going from the
central Medical Stores Department (MSD), to District
Medical Offices (DMO) and to health facilities.
14
Each of these
organizations
has its own
workflow
DMO
MSD
Health
center
Dispensary
Hospital
Zonal Warehouse
15. After identifying the involved
departments or organizations,
map the detailed work process
of each of these groups.
For example, this is a flow chart
for the medication ordering
process at a health center.
15
Step 2: Map the detailed work process
Review the details of each
step, and the documents
and personnel involved.
Also make sure the end of
one step links up with the
beginning of the next step
for a reliable handoff.
Every 3 months
Submit order to MSD
for processing
Compare ledgers in all departments
Determine stock on hand
Determine consumption in past 3 months
Estimate order
Complete ILS Order Form
Adjust order according to budget
Deliver to DMO pharmacist
DMO approval
16. Step 3: What can a flow chart tell you?
A well-plotted
flowchart
enables you to
see if
redundancy or
inadequacy exist
in the process.
16
These gaps and questions
suggest avenues for possible
interventions.
Every 3 months
Submit order to MSD
for processing
Compare ledgers in all departments
Determine stock on hand
Determine consumption in past 3 months
Estimate order
Complete ILS Order Form
Adjust order according to budget
Deliver to DMO pharmacist
DMO approval
What about
supplies
needed during
a stockout?
What is the
method for
determining
what gets cut?
17. Step 4: What is NOT evident in a flow chart?
The flowchart may
highlight the
breakdown, but it does
not indicate severity or
frequency.
Next step: formulate
your work plan to
continue to fill in gaps
in your root cause
analysis.
17
Determine the discrepancy
between the amount ordered
and what the budget allowed
Determine the discrepancy
between the actual need
and the amount consumed
Every 3 months
Submit order to MSD
for processing
Compare ledgers in all departments
Determine stock on hand
Determine consumption in past 3 months
Estimate order
Complete ILS Order Form
Adjust order according to budget
Deliver to DMO pharmacist
DMO approval
18. In summary, flowcharts can…
✓Help you understand complex processes
✓Bring together perspectives across units or departments
✓Identify breakdowns and redundancies
✓Highlight possible interventions
✓Shape further questioning during the root cause analysis
18
19. Q & A
Does it matter what colour the shapes are? No, however to make
flowcharts more readable normally we make each of the shape types
one constant colour, as you have seen in the examples.
I cannot determine which shape to use. This is normally because the
process you are trying to represent is too broad and needs to be broken
down more. Consider if you can break your current problem down into
smaller stages you can represent.
I get confused about how to order things, and when to use loops. Talk the
process through to someone else. This other person will not know the
flowchart, so will be able to tell you if your logic flows correctly or not. If
what you have said does not really make sense or is confusing, then you
know to go back and have another look.
23. Best Free Tools For Business Process Mapping
Google Drawings
Here are a few specific things you
can do:
● Edit chartsdrawings online with
anyone you choose.
● Chat with others.
● Publish drawings online to the
world as images, or download
them.
● Insert text, shapes, arrows,
scribbles, and images.
● Lay out drawings precisely with
alignment guides, snap to grid,
and auto distribution.
To Begin just type Drawing.new in your browser.