1. Mr. Floyd Thomas
Chairman, Caroline County Board of Supervisors
P.O. Box 447
Bowling Green, Virginia 22427
Dear Mr. Thomas;
As the Board of Supervisors is aware, every ten years after the completion of
the decennial census, local governments are required by law to evaluate
population changes within their boundaries and to make changes necessary
to ensure equal representation by and between elected officials.
The Caroline County Board of Supervisors, recognizing the amount of time
and effort required to undertake such an analysis, established the
Redistricting Advisory Committee. The members of the Redistricting
Advisory Committee as appointed by the Board of Supervisors are:
Chair, William “Duke” Whiteside; Mattaponi
Frank Gee; Bowling Green
Maynard Penney; Bowling Green
Eric Deibel; Madison
Scott Roberts; Madison
Charles Shewbridge; Madison
Lynda Keath; Mattaponi
Jim Heimbach; Port Royal
Bill Wick; Port Royal
Henry Barlow; Reedy Church
Demetrice Toliver; Reedy Church
Rueben Rock; Mattaponi; Caroline NAACP
Mack Wright; Caroline County School Board
The committee was charged with evaluating options for five, six and seven
election districts and making a recommendation to the Board of Supervisors.
The committee has completed its task and presents its findings and
recommendations to the Board.
2. The committee would also like to acknowledge the efforts of the staff
members who provided assistance to the committee as we prepared our
recommendation to the Board. Those staff members included:
Michael Finchum, Director of Planning
Angeline Pitts, County Planner
Laurel Hammig, Planner-GWRC
Ann Neil Cosby, County Attorney
Recommendation
The Redistricting Advisory Committee recommends that the Board of
Supervisors adopt the Five-District Plan (Attachment 1), which retains the
Reedy Church District as a minority-majority district.
Committee Evaluation and Consideration of Options
As requested by Board of Supervisors Chairman Floyd Thomas, the
Committee considered and evaluated the merits of five, six and seven
District options. Multiple versions of each plan were evaluated for their
strengths and weaknesses, while being mindful of the requirements set forth
by the United States Constitution, the Constitution of Virginia, the Code of
Virginia, and the federal Voting Rights Act, as well as traditionally accepted
redistricting criteria. These requirements and criteria include, but are not
limited to, maintaining one person-one vote by keeping the populations of
districts as even as possible, placing boundaries between districts along
easily recognizable landmarks, establishing districts that are compact and
contiguous, preserving communities of interest, accounting for the residency
of incumbents, and addressing non-retrogression, among other factors.
While the committee supports and recommends the five district plan, six and
seven district plans (Attachments 2 and 3) were prepared as requested.
Advantages of the Recommendation
The Committee selected the five district option for several reasons. First,
the option retains a minority-majority district (Reedy Church). Throughout
the process, the committee supported the standards of non-retrogression and
non dilution of minority voting strength. Since we have not found it possible
to maintain two minority-majority districts, even with a seven district option,
we are concerned that increasing the number of districts may be viewed as a
3. dilution of minority voting strength. The committee feels that the five
district option best addresses those principles, in light of the changing
County demographics, while balancing the various federal and state
requirements and traditional redistricting criteria.
Additional benefits include a compact Madison District with similar
communities of interest and a Port Royal District that is more contiguous
and compact, as compared to its current boundary. This option also retains
all members of the Board of Supervisors within their respective districts.
Disadvantages of the Recommendation
Given the varied population densities and other demographic changes that
have occurred between 2000 and 2010, this plan does create several larger
districts, while other districts are more compact. This is unavoidable due to
the increased population of the County and the need to shift a large block of
population out of the current Madison District (Lake Caroline) while
maintaining that community of interest. This plan also has the unfortunate
effect of placing three members of the Caroline County School Board in one
district.
Summary
We believe that the Five District plan recommended reasonably and best
meets the criteria required by the re-districting process. We also feel that in
these difficult economic times, creating additional districts would be an
unnecessary burden on the taxpayers of Caroline County, when surrounding
counties with comparable or even greater populations have managed well
with only five districts.
We thank you for your willingness to reach out to the citizens of the County
through the appointment of this committee and offer our continued
assistance as you move forward with the process.
Sincerely,
William “Duke” Whiteside
Chairman, 2011 Redistricting Advisory Committee
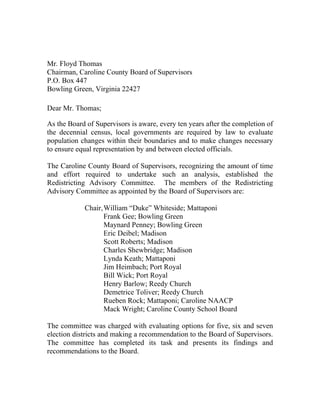
4. Attachment 1
5 District Option
Total Am %Am
District Deviation % Dev White % White Black % Black Asian % Asian Hawaiian % Hawaiian Other % Other
Population Indian Indian
Bowling
5,570 ‐139 ‐2.43% 3,906 70.13% 1,402 25.17% 84 1.51% 24 0.43% 1 0.02% 25 0.45%
Green
Madison 5,798 89 1.56% 4,093 70.59% 1,306 22.53% 34 0.59% 53 0.91% 12 0.21% 72 1.24%
Mattaponi 5,672 ‐37 ‐0.65% 3,951 69.66% 1,383 24.38% 40 0.71% 43 0.76% 3 0.05% 82 1.45%
Port Royal 5,601 ‐108 ‐1.89% 3,878 69.24% 1,438 25.67% 32 0.57% 27 0.48% 5 0.09% 62 1.11%
Reedy
5,904 195 3.42% 2,821 47.78% 2,846 48.20% 23 0.39% 31 0.53% 1 0.02% 32 0.54%
Church
% 18+
Voting Age % 18+ 18+ % 18+ 18+ Am 18+ % 18+ 18+ % 18+
18+ White Am 18+ Other % 18+ Other
(18+) Pop White Black Black Indian Asian Asian Hawaiian Hawaiian
Indian
Bowling
4,415 3,143 71.19% 1,103 24.98% 67 1.52% 21 0.48% 1 0.02% 18 0.41%
Green
Madison 4,100 2,950 71.95% 935 22.80% 23 0.56% 44 1.07% 4 0.10% 53 1.29%
Mattaponi 4,284 3,023 70.56% 1,060 24.74% 26 0.61% 36 0.84% 3 0.07% 57 1.33%
Port Royal 4,352 3,044 69.94% 1,157 26.59% 20 0.46% 23 0.53% 2 0.05% 35 0.80%
Reedy
4,550 2,189 48.11% 2,219 48.77% 19 0.42% 27 0.59% 1 0.02% 21 0.46%
Church
5. Attachment 2
6 District Option
Total Am %Am
District Deviation % Dev White % White Black % Black Asian % Asian Hawaiian % Hawaiian Other % Other
Population Indian Indian
Bowling
4,740 ‐18 ‐0.38% 3,349 70.65% 1,152 24.30% 79 1.67% 14 0.30% 1 0.02% 25 0.53%
Green
Madison 4,833 75 1.58% 3,524 72.92% 1,043 21.58% 33 0.68% 40 0.83% 8 0.17% 46 0.95%
Lake 4,811 53 1.11% 3,519 73.14% 974 20.25% 34 0.71% 41 0.85% 6 0.12% 62 1.29%
Mattaponi 4,865 107 2.25% 2,836 58.29% 1,709 35.13% 19 0.39% 47 0.97% 1 0.02% 68 1.40%
Port Royal 4,774 16 0.34% 3,243 67.93% 1,278 26.77% 26 0.54% 21 0.44% 5 0.10% 57 1.19%
Reedy
4,522 ‐236 ‐4.96% 2,178 48.16% 2,219 49.07% 22 0.49% 15 0.33% 1 0.02% 15 0.33%
Church
% 18+
Voting Age % 18+ 18+ % 18+ 18+ Am 18+ % 18+ 18+ % 18+
18+ White Am 18+ Other % 18+ Other
(18+) Pop White Black Black Indian Asian Asian Hawaiian Hawaiian
Indian
Bowling
3,741 2,684 71.75% 902 24.11% 62 1.66% 14 0.37% 1 0.03% 18 0.48%
Green
Madison 3,569 2,663 74.61% 765 21.43% 17 0.48% 31 0.87% 4 0.11% 30 0.84%
Lake 3,403 2,535 74.49% 694 20.39% 24 0.71% 38 1.12% 2 0.06% 43 1.26%
Mattaponi 3,664 2,142 58.46% 1,318 35.97% 16 0.44% 41 1.12% 1 0.03% 53 1.45%
Port Royal 3,733 2,571 68.87% 1,031 27.62% 18 0.48% 17 0.46% 2 0.05% 32 0.86%
Reedy
3,591 1,754 48.84% 1,764 49.12% 18 0.50% 10 0.28% 1 0.03% 8 0.22%
Church
6. Attachment 3
7 District Option
Total Am %Am
District Deviation % Dev White % White Black % Black Asian % Asian Hawaiian % Hawaiian Other % Other
Population Indian Indian
Bowling
4,095 17 0.42% 2,828 69.06% 1,050 25.64% 71 1.73% 14 0.34% 1 0.02% 23 0.56%
Green
Carmel
4,139 61 1.50% 2,816 68.04% 1,106 26.72% 25 0.60% 34 0.82% 2 0.05% 29 0.70%
Church
Lake 4,270 192 4.71% 3,088 72.32% 884 20.70% 25 0.59% 36 0.84% 6 0.14% 58 1.36%
Madison 4,002 ‐76 ‐1.86% 2,803 70.04% 994 24.84% 31 0.77% 27 0.67% 6 0.15% 39 0.97%
Mattaponi 4,090 12 0.29% 2,538 62.05% 1,296 31.69% 23 0.56% 35 0.86% 1 0.02% 65 1.59%
Port Royal 4,027 ‐51 ‐1.25% 2,710 67.30% 1,108 27.51% 20 0.50% 20 0.50% 5 0.12% 44 1.09%
Reedy
3,922 ‐156 ‐3.83% 1,866 47.58% 1,937 49.39% 18 0.46% 12 0.31% 1 0.03% 15 0.38%
Church
% 18+
Voting Age % 18+ 18+ % 18+ 18+ Am 18+ % 18+ 18+ % 18+
18+ White Am 18+ Other % 18+ Other
(18+) Pop White Black Black Indian Asian Asian Hawaiian Hawaiian
Indian
Bowling
3,219 2,261 70.24% 816 25.35% 57 1.77% 14 0.43% 1 0.03% 16 0.50%
Green
Carmel
3,040 2,100 69.08% 819 26.94% 17 0.56% 31 1.02% 2 0.07% 15 0.49%
Church
Lake 2,993 2,210 73.84% 623 20.82% 18 0.60% 34 1.14% 2 0.07% 41 1.37%
Madison 3,010 2,143 71.20% 753 25.02% 18 0.60% 20 0.66% 2 0.07% 28 0.93%
Mattaponi 3,186 1,998 62.71% 1,029 32.30% 17 0.53% 27 0.85% 1 0.03% 51 1.60%
Port Royal 3,156 2,144 67.93% 899 28.49% 14 0.44% 16 0.51% 2 0.06% 25 0.79%
Reedy
3,097 1,493 48.21% 1,535 49.56% 14 0.45% 9 0.29% 1 0.03% 8 0.26%
Church