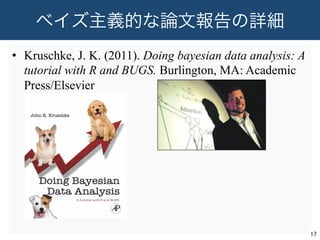
論文本体で報告
事例:
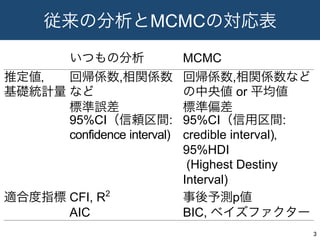
Regarding the clinicalprocess–mechanism–outcome
linkages examined in the SEM, EB results for the regression
parameters in the structural portion of the SEM (see Figure
4) suggest a positive effect of the following sets of therapist
interventions on change in family functioning: (a)
proportion of individually focused general interventions (BE
(7,9) = 17.49, 95% credible interval [6.41, 28.29])
7
Ozechowski, T. J. (2014). Empirical bayes MCMC estimation for modeling treatment processes,
mechanisms of change, and clinical outcome in small sample. Journal of Consulting and
Clinical Psychology, Doi: 10.1037/a0035889
8.
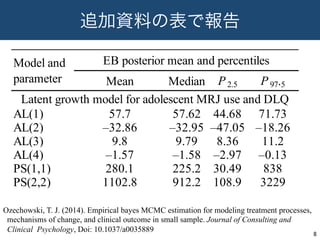
追加資料の表で報告
8
Median P2.5 P97.5
AL(1)57.62 44.68 71.73
AL(2) –32.95 –47.05 –18.26
AL(3) 9.79 8.36 11.2
AL(4) –1.58 –2.97 –0.13
PS(1,1) 225.2 30.49 838
PS(2,2) 912.2 108.9 3229
–32.86
9.8
–1.57
280.1
1102.8
Model and
parameter
EB posterior mean and percentiles
Mean
Latent growth model for adolescent MRJ use and DLQ
57.7
Ozechowski, T. J. (2014). Empirical bayes MCMC estimation for modeling treatment processes,
mechanisms of change, and clinical outcome in small sample. Journal of Consulting and
Clinical Psychology, Doi: 10.1037/a0035889
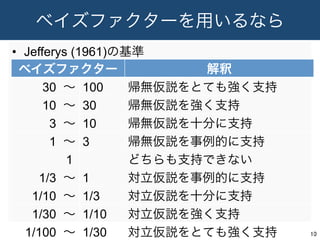
ベイズファクター用いるなら
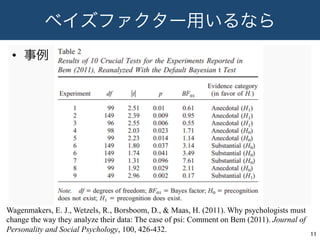
• 事例
11
Wagenmakers, E.J., Wetzels, R., Borsboom, D., & Maas, H. (2011). Why psychologists must
change the way they analyze their data: The case of psi: Comment on Bem (2011). Journal of
Personality and Social Psychology, 100, 426-432.
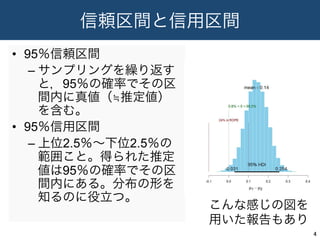
今日の重回帰分析での例なら
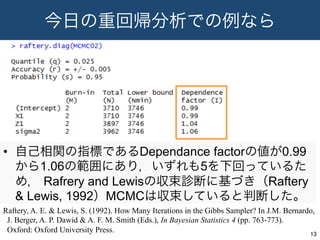
• 自己相関の指標であるDependance factorの値が0.99
から1.06の範囲にあり,いずれも5を下回っているた
め,Rafrery and Lewisの収束診断に基づき(Raftery
& Lewis, 1992)MCMCは収束していると判断した。
13
Raftery, A. E. & Lewis, S. (1992). How Many Iterations in the Gibbs Sampler? In J.M. Bernardo,
J. Berger, A. P. Dawid & A. F. M. Smith (Eds.), In Bayesian Statistics 4 (pp. 763-773).
Oxford: Oxford University Press.
14.
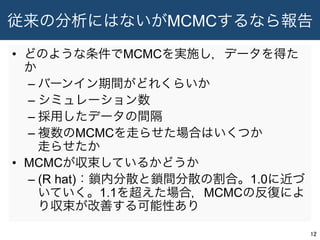
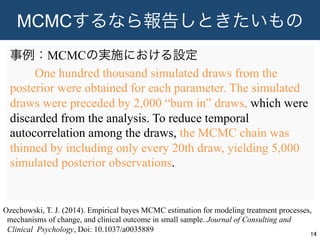
MCMCするなら報告しときたいもの
事例:MCMCの実施における設定
One hundred thousandsimulated draws from the
posterior were obtained for each parameter. The simulated
draws were preceded by 2,000 “burn in” draws, which were
discarded from the analysis. To reduce temporal
autocorrelation among the draws, the MCMC chain was
thinned by including only every 20th draw, yielding 5,000
simulated posterior observations.
14
Ozechowski, T. J. (2014). Empirical bayes MCMC estimation for modeling treatment processes,
mechanisms of change, and clinical outcome in small sample. Journal of Consulting and
Clinical Psychology, Doi: 10.1037/a0035889
15.
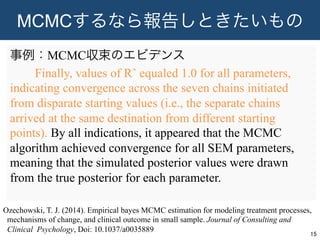
MCMCするなら報告しときたいもの
事例:MCMC収束のエビデンス
Finally, values ofRˆ equaled 1.0 for all parameters,
indicating convergence across the seven chains initiated
from disparate starting values (i.e., the separate chains
arrived at the same destination from different starting
points). By all indications, it appeared that the MCMC
algorithm achieved convergence for all SEM parameters,
meaning that the simulated posterior values were drawn
from the true posterior for each parameter.
15
Ozechowski, T. J. (2014). Empirical bayes MCMC estimation for modeling treatment processes,
mechanisms of change, and clinical outcome in small sample. Journal of Consulting and
Clinical Psychology, Doi: 10.1037/a0035889


![今日の重回帰分析の例でなら
• X1はY1に正の影響を及ぼすことが示された
(b = 0.68, 95%信用区間[0.60, 0.77])。
6](https://image.slidesharecdn.com/mcmc-140609032714-phpapp02/85/MCMC-6-320.jpg)
![論文本体で報告
事例:
Regarding the clinical process–mechanism–outcome
linkages examined in the SEM, EB results for the regression
parameters in the structural portion of the SEM (see Figure
4) suggest a positive effect of the following sets of therapist
interventions on change in family functioning: (a)
proportion of individually focused general interventions (BE
(7,9) = 17.49, 95% credible interval [6.41, 28.29])
7
Ozechowski, T. J. (2014). Empirical bayes MCMC estimation for modeling treatment processes,
mechanisms of change, and clinical outcome in small sample. Journal of Consulting and
Clinical Psychology, Doi: 10.1037/a0035889](https://image.slidesharecdn.com/mcmc-140609032714-phpapp02/85/MCMC-7-320.jpg)