Download as PDF, PPTX

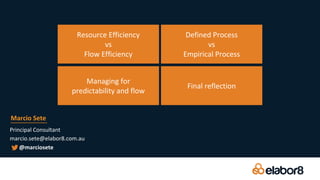


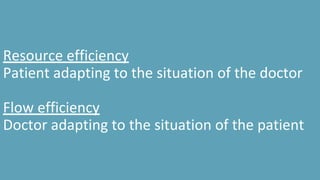
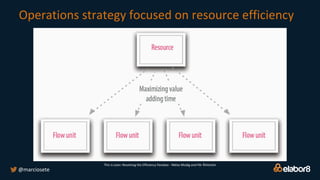
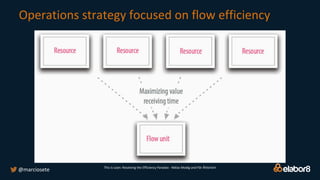
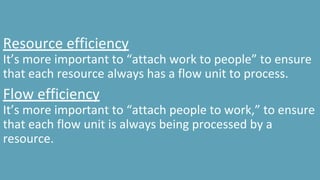
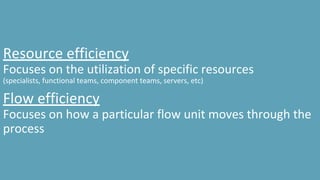
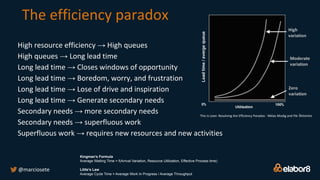


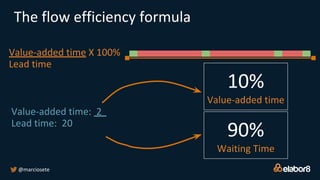

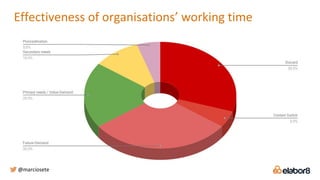

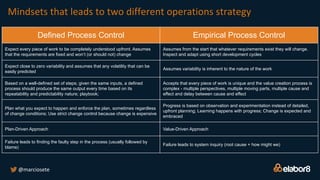

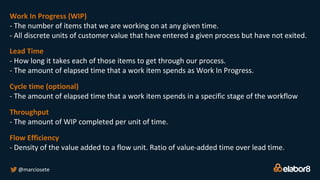


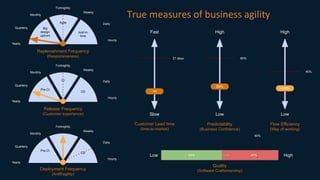


The document discusses two different operations strategies: resource efficiency and flow efficiency. Resource efficiency focuses on maximizing the utilization of resources, which can lead to increased queues and wait times. Flow efficiency prioritizes ensuring each work item continuously moves through the process, in order to reduce lead times. The document argues flow efficiency is preferable, as it avoids secondary needs and superfluous work that can arise from long lead times under a resource efficiency approach. It also presents frameworks for measuring and managing flow to improve operational performance.


![[Talk] Manage flow - Metrics and Analytics for predictability and flow](https://cdn.slidesharecdn.com/ss_thumbnails/lkna-manageflow-metricsandanalyticsforpredictabilityandflow-190527041051-thumbnail.jpg?width=640&height=640&fit=bounds)


![Estimativa, planejamento e progresso [sob uma visão ágil]](https://cdn.slidesharecdn.com/ss_thumbnails/agileestimatingandplanning-110830082441-phpapp01-thumbnail.jpg?width=640&height=640&fit=bounds)