Downloaded 146 times


![Population -hg;+Vof _
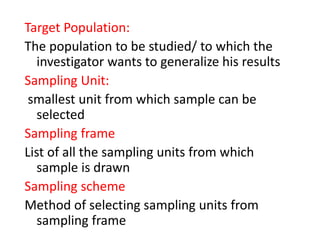
• 'Population refers to all the individuals
or objects on which we have to make
some study.'
cg';Gwfgsf] nflu 5gf]6 ul/Psf ;Dk"0f{ dflg;Pjd
j:t'x¿sf] ;d"xnfO{ ;du|jf hg;+VofelgG5.
• Finite Population l;ldt hg;+Vof
• Infinite Population cl;ldt hg;+Vof](https://image.slidesharecdn.com/samplingtechniqueandsamplesizedetermination-180709015744/85/Sampling-Technique-and-Sample-Size-Determination-4-320.jpg)
![Sample-gd'gf_
The representative proportion of the population is
called a sample. 7"nf] hg;+Vofaf6 5gf]6 ul/Psf] k|ltlglwd"ns
;d"xnfO{ g} gd"gf elgG5 .
Koul (2009: 111) sf cg';f/ æhg;ªVofsf] k|ltlglwd"nsc+znfO{ g}
gd'gf elgG5 .Æ (The respresentative portion of the
population is called sample).
Best & Khan (1998: 13) sf cg';f/ ægd'gfPp6f cjnf]sg /
ljZn]if0fsf nflu hg;ªVofaf6 5gf]6 ul/Psf] ;fgf] cg'kftxf] .Æ (A
sample is a small proportion of a population
selected for observation and analysis.)](https://image.slidesharecdn.com/samplingtechniqueandsamplesizedetermination-180709015744/85/Sampling-Technique-and-Sample-Size-Determination-5-320.jpg)
![Sampling gd"gf 5gf]6
• Sampling is the process of selecting a
representative part of a population for
the purpose of determining the
characteristics of the whole population.
• Gfd"gf 5gf]6 To:tf] k|lqmof xf] h;4f/f Jolqm, j:t' /
36gfx¿sf] ;fgf] ;+Vof 5gf]6 ul/G5 / ;Dk"0f{ hg;+Vofsf]
af/]dfslx s'/f kQfnufpgljZn]if0ful/G5.](https://image.slidesharecdn.com/samplingtechniqueandsamplesizedetermination-180709015744/85/Sampling-Technique-and-Sample-Size-Determination-7-320.jpg)
![Definitions of Sampling
• Kerlinger (1986:110) sf cg';f/ æhg;ªVof jf ;du|tfsf] k|ltlglwTj x'g] u/L
hg;ªVofsf] s]xL efu 5gf]6 ul/g] k|lj|mofnfO{ gd'gf 5gf]6 (sampling)
elgG5 . (sampling is process of selecting any portion of a
population or universe as representative of the
population or universe).
• Koul (2009: 111) sf cg';f/ ægd'gf 5gf]6 To:tf] k|lj|mof xf] h;åf/f JolQm,
j:t' / 36gfx¿sf] ;fk]lIft ¿kdf ;fgf] ;ªVof 5gf]6 ul/G5 / ;Dk"0f{ hg;ªVofsf af/]df
s]xLs'/fkQfnufO{ljZn]if0ful/G5 .Æ
• Sampling is the process by which a relatively small
number of individuals, objects or events is selected and
analyzed in order to find out something about the
entire population.](https://image.slidesharecdn.com/samplingtechniqueandsamplesizedetermination-180709015744/85/Sampling-Technique-and-Sample-Size-Determination-8-320.jpg)
![Steps in sampling Method
• Defining the population
hg;+VofnfO{ kl/efliftug]{
• Listing the population (Sampling Frame)
hg;+Vofsf] ;"lr tof/ ug]{
• Selecting the representative sample
hg;+Vofsf] k|ltlgwLd"ns gd'gf 5g]6 ug]{
• Obtaining an adequate sample cfjZos
gd'gf k|fKtug]{](https://image.slidesharecdn.com/samplingtechniqueandsamplesizedetermination-180709015744/85/Sampling-Technique-and-Sample-Size-Determination-10-320.jpg)
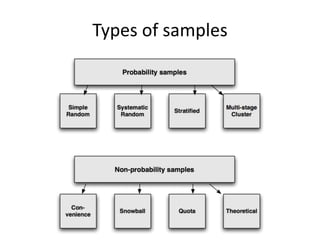
![Types of sampling in researches
Probability
samples
;+efjgfo'Qm gd'gf
5gf}]6
Non-
probability
samples
;+efgf/lxt gd'gf
5gf}]6](https://image.slidesharecdn.com/samplingtechniqueandsamplesizedetermination-180709015744/85/Sampling-Technique-and-Sample-Size-Determination-14-320.jpg)
![;+efjgfo"Qmgd'gf 5gf]6
(Probability Sampling)
• ;+efjgfo'Qm gd'gf 5gf]6nfO{ ;+of]u gd'gf 5gf]6 (chance
sampling) jf b}jLgd'gf5gf]6 (random sampling) klgelgG5 .
• o; ljlwdf cWoog hg;ªVofsf] k|To]s PsfOx¿ gd'gfsf ¿kdf 5gf]6 x'g ;Sg]
a/fa/ ;+efjgf x'G5 . To;}n] of] gd'gf 5gf]6 ljlw k"0f{ ¿kdf kIfkft /lxt
dflgG5 .
• cg';GwfgnfO{ a9L k|ltlglwd"ns Pjd kIfkft/lxt agfpgsf nflu ;Defjgfo'Qm
gd'gf5gf]6 k4ltsf]pkof]u ul/G5.](https://image.slidesharecdn.com/samplingtechniqueandsamplesizedetermination-180709015744/85/Sampling-Technique-and-Sample-Size-Determination-16-320.jpg)

![• Gay (1976: 68) sf cg';f/ æ;fdfGo ;+efjgfo'Qm gd'gf 5gf]6 cg';Gwfgsf] nflu
gd'gf 5gf]6 ug{] To:tf] ljlw xf] h;df kl/eflift ul/Psf] hg;ªVofdf /x]sf ;a} JolQmx¿
gd'gfsf] ¿kdf 5gf]6 x'g] ;Defjgf ;dfg / :jtGq
x'G5Æ .
• d'Vou/L lgDg ljlwx¿dWo] s'g} Psljlwsf] k|of]u ug{ ;lsG5 .
• uf]nf k|yf ljlw(Lottery method)
• ufO{ lqz'n (Coin-toss method)
• sf8{ ljlw(Card method)
• b}ljs c+ssf] tflnsfsf] k|of]u (Table of random number)
• Kjfn ljlw(Grid method)
• sDKo'6/ ljlw(Computer method)
• b}ljs c+s 8fon (Random digit dialing-RDD)](https://image.slidesharecdn.com/samplingtechniqueandsamplesizedetermination-180709015744/85/Sampling-Technique-and-Sample-Size-Determination-18-320.jpg)

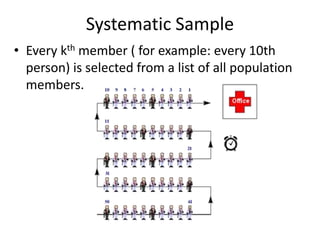
![Jojl:ytgd'gf 5gf]6 ljlw
(Systematic sampling)
• Jojl:yt gd'gf 5gf]6 To:tf] ljlw xf], h;df ;+efJotfsf cfwf/df ;du|
hg;ªVofaf6 Pp6f PsfO -gd'gf_ sf] 5gf]6 u/L lglZrt gd'gf cGt/
(sample interval) sf cfwf/df cGo afFsL gd'gfsf] 5gf]6
ul/G5 . o;nfO{cw{ ;+efjgfo'Qmgd'gf 5gf]6 klgelgG5 .
gd'gf 5gf]6 cGt /fn (Sampling Interval) =
(Sizeof population)
(Sizeof samplerequired)
hg; V+ofsf]cfsf/
r flxg]gd'gfsf]cfsf/
K = N
n](https://image.slidesharecdn.com/samplingtechniqueandsamplesizedetermination-180709015744/85/Sampling-Technique-and-Sample-Size-Determination-21-320.jpg)
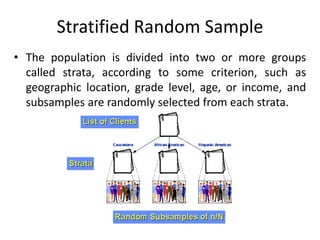
![:tLl/s[t gd'gf 5gf]6
(stratified sampling):
• ;du|tf jf cWoog hg;+Vof leq /x]sf ljleGg PsfOx?sf] ljz]iftfsf cfwf/df
PsfOx?nfO{ :t/Ls[t u/L ;+efjgfo'Qm gd'gf 5gf]6 (random sampling)
ljwLaf6 gd'gf 5gf]6 ug]{ k|lqmof jf tl/sfnfO{ :t/Ls[t gd'gf 5gf]6 (Stratified
sampling) elgG5.
• obL cWoog hg;+Vofsf] :j?k jf jgfj6 c;dfg (heterogeneous) 5 eg] To;
cj:yfdf:t/Ls[tgd'gf5gf]6ljwLj9Lpko'Qmx'G5 .
• :t/Ls[t gd'gf 5gf]6 ljlw k|of]u ubf{ cg';Gwfgsf] p2]Zo cg';f/ cWoog
hg;ªVofnfO{ ln·, pd]/, z}lIfs cj:yf, k];f, wd{, hftL, a;f]af; If]q -zx/÷ufpF_,
;fdflhs cfly{s cj:yf, ef}uf]lns If]q h:tf ljz]iftfx¿sf cfwf/df ljleGg ju{ (Strata)
df ljefhg ul/G5 / k|To]s ju{af6 ;Defjgfo'Qm gd'gf 5gf]6 ljlwsf] k|of]u u/L
gd'gf5gf]6ul/G5 .](https://image.slidesharecdn.com/samplingtechniqueandsamplesizedetermination-180709015744/85/Sampling-Technique-and-Sample-Size-Determination-24-320.jpg)
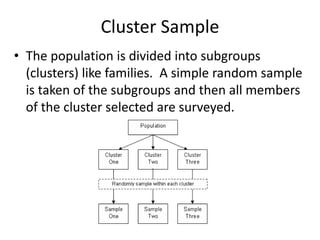
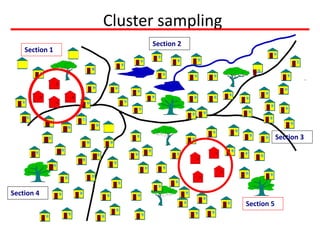
![em'08 gd'gf 5gf]6
(Cluster Sampling)
• of] ljlw cl;ldt hg;ªVof (infinite population) ePdf, hg;ªVofsf]
;"rL k|fKt x'g g;Sbf jf hg;ªVof 5l/P/ (scatter) /x]sf] cj:yfdf tyf
hg;ªVofsf] ef}uf]lns ljt/0f 7"nf] ePsf] cj:yfdf a9L pko'Qm x'G5
(Best and Khan, 1999:18) . ;du| hg;ªVof jf If]qnfO{ ljleGg
e'm08df ljefhg u/L gd'gf 5gf]6 ug{] ljlwnfO{ em"08 gd'gf 5gf]6
(Cluster sampling) elgG5 .](https://image.slidesharecdn.com/samplingtechniqueandsamplesizedetermination-180709015744/85/Sampling-Technique-and-Sample-Size-Determination-27-320.jpg)
![ax'r/0f gd'gf 5gf]6 (Multistage Sampling)
• ;du| hg;ªVofnfO{ ljleGg txdf Pskl5 csf{] ljefhg ub{} tNnf] txdf
k'u]/ gd'gf 5gf]6 ug{] ljlwnfO{ ax'tx gd'gf 5gf]6 (Multistage
sampling) elgG5 . o; gd'gf 5gf]6 ljlw cg';f/ cg';Gwfgsf nflu
gd'gf 5gf]6 ubf{ ljleGg r/0fx¿df ljefhg u/L ax'txaf6 clt z'Id PsfOdf
k'u]/gd'gf 5gf]6 ul/G5 .](https://image.slidesharecdn.com/samplingtechniqueandsamplesizedetermination-180709015744/85/Sampling-Technique-and-Sample-Size-Determination-30-320.jpg)
![Non-Probability Sampling
• s'g} hg;ªVofaf6cWoogsf nflu5gf]6 ul/g]gd'gf;+of]usf]
cfwf/df geO{ k"j{lgwf{l/t;f]r jf ljrf/sf cfwf/df ul/G5, h;df k|To]s
PsfOx¿ gd'gfsf¿kdf 5gf]6 x'g] ;+efjgfx'Fb}geg] To;nfO{;+efjgf
/lxtgd'gf 5gf]6 (Non-Probability Sampling) elgG5 .
• Pant (2012) sf cg';f/ "Non-Probability sampling
is described as those samples, which are not
determined by chances but rather by personal
convenience or judgment of the researcher."](https://image.slidesharecdn.com/samplingtechniqueandsamplesizedetermination-180709015744/85/Sampling-Technique-and-Sample-Size-Determination-32-320.jpg)
![;+efjgf/lxtgd'gf5gf]6 ljlwsf]k|of]ux'g]cj:yfx¿
• ha hg;ªVofsfPsfOx¿sf];ªVofyfxfgePsf]cj:yfdfjfJolQmut¿kdfklxrfg
gePsf]cj:yfdf.
• cg';Gwfgstf{n];+efjgfo'Qmgd'gf5gf]6ubf{hg;ªVofsfaf/]dfk"0f{hfgsf/L
k|fKtgePsf]n]cj:yfdf.
• cg';Gwfgstf{n]cWoogsf36gfx¿sf]7"nf];ªVof;dfj]zug{ c;+ej÷cJojxfl/sdx;';
u/]sfn] cj:yfdf.
• olbcg';Gwfgu'0ffTdsk|s[ltsf]Pj+36gfcWoogePdf.
• ;+efjgfo'Qmgd'gf5gf]6ljlwdfkm{t5gf]6ul/Psfgd'gfnfO{;Dks{ug{sl7gfO
k|dfl0ftePdf.h:t}M3/ljlxg(homeless) jfnfu'cf}ifw;]jgstf{ (Drug
addicts), dlxnfof}gsdL{x? (Female sex workers) cflbJolQmsf]
cWoog.](https://image.slidesharecdn.com/samplingtechniqueandsamplesizedetermination-180709015744/85/Sampling-Technique-and-Sample-Size-Determination-33-320.jpg)
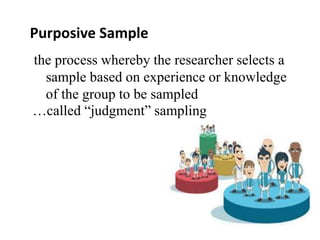
![p2]Zod"ns gd'gf 5gf]6
(Purposive sampling)
• p2]Zod"ns gd'gf 5gf]6df cg';Gwfgstf{sf] p2]Zo, ?rL / rfxgf cg';f/ gd'gfsf]
5gf]6 ul/G5 . cg';Gwfgstf{n] h'g p2]Zo cGtu{t /x]/ cg';Gwfg sfo{ ug{ nfu]sf]
xf] ;f]xL p2]Zo adf]lhd cfˆgf] JolQmut lg0f{osf cfwf/df gd'gf 5gf]6 u5{ eg]
To:tf] gd'gf 5gf]6 ljlwnfO{ p2]Zod"ns gd'gf 5gf]6 ljlw (purposive
sampling) elgG5.
• o; ljlwdf cg';Gwfgstf{n] gd'gf 5gf]6 ubf{ cfˆgf] ljifout cfwf/ (Subjective
basis), p2]Zo (objective) Pj+ cGtb{[li6 (intuition) k|of]u u/L
cfkm} lg0f{o ug{] ePsf]n] o;nfO{ lg0f{ofTds gd'gf 5gf]6 (Judgemental
sampling) klgelgG5.](https://image.slidesharecdn.com/samplingtechniqueandsamplesizedetermination-180709015744/85/Sampling-Technique-and-Sample-Size-Determination-37-320.jpg)
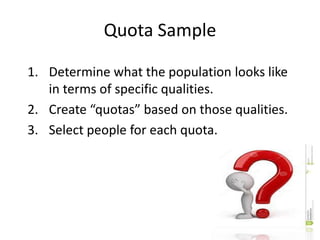
![Quota sampling
• cg';Gwfgstf{n]hg;ªVofnfO{lglZrtljz]iftfsfcfwf/dfljleGg
PsfOx¿nfO{cf/If0fsf¿kdfljleGg;d"x(strata)dfljefhgu/L
cg';Gwfgstf{sf]JolQmut lg0f{osfcfwf/dfk|To]s ;d"xsf];dfg'kflts
k|ltlglwTjx'g]u/Lgd'gf5gf]6ug{]ljlwnfO{cf/If0fgd'gf5gf]6
(Quota sampling) elgG5.
• cWooghg;ªVofnfO{slt;d"xdfljefhgug]{xf], ;f]lg0f{oug{]
• k|To]s ;d"xaf6gd'gfsf]sltk|ltztlng'kg{]xf],;f]s'/flg0f{oug{]
• jf:tljsgd'gfPsfOx¿sf]5gf]6ug{]](https://image.slidesharecdn.com/samplingtechniqueandsamplesizedetermination-180709015744/85/Sampling-Technique-and-Sample-Size-Determination-40-320.jpg)
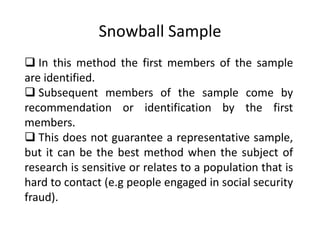
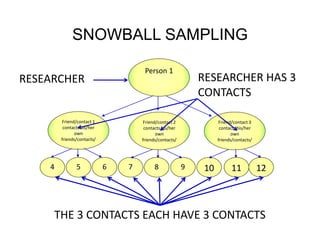
![Snowball sampling
• :gf]an gd'gf 5gf]6 ljlwaf6 gd'gf 5gf]6 ubf{ ;j{k|yd cWoog
hg;ªVofsf] s'g} Pp6f PsfOnfO{ gd'gfsf] ¿kdf lnO{ To; PsfOsf]
dfWodaf6 cGo PsfOx¿nfO{ kQf nufpFb} gd'gf 5gf]6 ul/G5 . o;
ljlwdf s'g} Ps PsfOsf] klxrfg kl5 5gf]6 ul/Psf] pQm gd'gfn]
lbPsf] ;"rgf jf hfgsf/Lsf cfwf/df csf{] gd'gf 5gf]6 ul/G5 o;/L Ps
kl5 csf{] ub{} k|fKt ;"rgfsf] cfwf/df ;+hfn (network)
k|lj|mofaf6 cfjZos ;ªVofdf gd'gf 5gf]6 ug{] ljlwnfO{ :gf]jn gd'gf
5gf]6 (Snowball sampling) elgG5 .](https://image.slidesharecdn.com/samplingtechniqueandsamplesizedetermination-180709015744/85/Sampling-Technique-and-Sample-Size-Determination-43-320.jpg)


The document discusses various sampling techniques and methods for determining sample size in research, emphasizing the importance of representative samples. It categorizes sampling into probability and non-probability types, detailing specific techniques like simple random sampling, stratified sampling, and cluster sampling, alongside their advantages and disadvantages. The significance of accurately defining the population, selecting appropriate samples, and ensuring reliability in data collection processes is highlighted.


