
Recommended
More Related Content
What's hot
What's hot (19)
Similar to Membrana bioquímica
Similar to Membrana bioquímica (20)
More from jlquinonesrivera
More from jlquinonesrivera (13)
Recently uploaded
Recently uploaded (20)
Membrana bioquímica
- 2. Los ácidos grasos son anfipáticos
- 3. Ácidos grasos se almacenan como triglicérido
- 4. Enlace cis
- 8. Triglicéridos Manteca y aceite Los “trans fat”
- 15. Statins inhibitors competitively inhibit the activity of HMG CoA reductase (3-hydroxy-3-methylglutaryl-CoA reductase)
- 17. Eicosanoides Some mammals lack the ability to or have a very limited capacity to convert linoleic acid into arachidonic acid, making it an essential part of their diet. Since little or no arachidonic acid is found in common plants, such animals are obligate carnivores; the cat is a common example
- 18. *
- 19. Irreversible inactivation of Cyclooxygenase
- 21. • The cell membrane is a phospholipid bilayer with proteins,The cell membrane is a phospholipid bilayer with proteins, lipids and carbohydrates.lipids and carbohydrates. Figure 3.3
- 28. 23% of glycerophospholipids in CNS ethanolamine plasmalogen
- 30. Sphingosine, the backbone for sphingolipids, is a long-chain alcohol with an amino group at C-2. Ceramides are precursors of sphingolipids.
- 32. GM2 ganglioside (Tay Sach)
- 35. It is caused by a hereditary deficiency of the enzyme glucocerebrosidase. Manifestations may include enlarged spleen and liver, liver malfunction, skeletal disorders and bone lesions that may be painful, severe neurologic complications, swelling of lymph nodes and (occasionally) adjacent joints, distended abdomen, a brownish tint to the skin, anemia, low blood platelets, and yellow fatty deposits on the white of the eye (sclera). Persons affected most seriously may also be more susceptible to infection. Some forms of Gaucher's disease may be treated with enzyme replacement therapy Gaucher's disease
- 38. • Lipids of the bilayer fluid or liquid-crystalline stateLipids of the bilayer fluid or liquid-crystalline state • Proteins move within the membraneProteins move within the membrane
- 42. Figure 3.3 20 a 25% de lípidos en la membrana.
- 48. Membrane proteins functionsMembrane proteins functions Figure 3.4
- 51. Passive TransportPassive Transport Facilitated DiffusionFacilitated Diffusion Figure 3.22
- 53. Figure 3.23 Active TransportActive Transport
- 55. Figure 3.24 Secondary Active TransportSecondary Active Transport
- 60. Fig. 6-5, p. 139 Receptores: Ionotróficos Metabotróficos
- 61. G Protein–Linked ReceptorsG Protein–Linked Receptors
- 65. Phosphatase *
- 67. Cinasa A
- 69. cAMP Aumenta fuerza contracción corazón Relajación músculos lisos Secresión de NaCl en epitelio intestinal Inhibidores de fosfodiesterasa: cafeína y teofilina Proteína Gs y Gi Toxina del cólera (Gs) Inhiben hidrólisis de GTP Toxina pertussis (Gi) (Tos ferina) Inhiben sustituir GTP por GDP
- 70. DAG -> Cinasa C IP3 -> Ca++ *
- 72. *
Editor's Notes
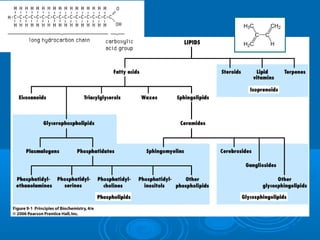
- Figure 9.1 Structural relationships of the major classes of lipids. Fatty acids are the simplest lipids. Many other types of lipids either contain or are derived from fatty acids. Glycerophospholipids and sphingomyelins contain phosphate and are classified as phospholipids. Cerebrosides and gangliosides contain sphingosine and carbohydrate and are classified as glycosphingolipids. Steroids, lipid vitamins, and terpenes are called isoprenoids because they are related to the five-carbon molecule isoprene rather than to fatty acids.
- Figure 9.2 Structure and nomenclature of fatty acids. Fatty acids consist of a long hydrocarbon tail terminating with a carboxyl group. Since the pKa of the carboxyl group is approximately 4.5 to 5.0, fatty acids are anionic at physiological pH. In IUPAC nomenclature, carbons are numbered beginning with the carboxyl carbon. In common nomenclature, the carbon atom adjacent to the carboxyl carbon is designated , and the remaining carbons are lettered , , , and so on. The carbon atom farthest from the carboxyl carbon is designated the carbon, whatever the length of the tail. The fatty acid shown, laurate (or dodecanoate), has 12 carbon atoms and contains no carbon–carbon double bonds.
- Figure 9.5 Structure of a triacylglycerol. Glycerol (a) is the backbone to which three fatty acyl residues are esterified (b). Although glycerol is not chiral, C-2 of a triacylglycerol is chiral when the acyl groups bound to C-1 and C-3 (R1 and R3) differ. The general structure of a triacylglycerol is shown in (c), oriented for comparison with the structure of L-glyceraldehyde (Figure 8.1). This orientation allows stereospecific numbering of glycerol derivatives with C-1 at the top and C-3 at the bottom.
- Figure 9.3 Chemical structures of three C18 fatty acids. (a) Stearate (octadecanoate), a saturated fatty acid. (b) Oleate (cis-9-octadecenoate) a monounsaturated fatty acid. (c) Linolenate (all-cis-9,12,15-octadecatrienoate), a polyunsaturated fatty acid. The cis double bonds produce kinks in the tails of the unsaturated fatty acids. Linolenate is a very flexible molecule, and can assume a variety of conformations.
- Figure 9.4 Ball-and-stick models of three C18 fatty acids. (a) Stearate. (b) Oleate. (c) Linolenate. Color key: carbon, grey; hydrogen, white; oxygen, red.
- Figure 9.5 Structure of a triacylglycerol. Glycerol (a) is the backbone to which three fatty acyl residues are esterified (b). Although glycerol is not chiral, C-2 of a triacylglycerol is chiral when the acyl groups bound to C-1 and C-3 (R1 and R3) differ. The general structure of a triacylglycerol is shown in (c), oriented for comparison with the structure of L-glyceraldehyde (Figure 8.1). This orientation allows stereospecific numbering of glycerol derivatives with C-1 at the top and C-3 at the bottom.
- Figure 9.14 Structures of several steroids. Squalene (a) is the precursor of most steroids. Steroids contain four fused rings (lettered A, B, C, and D). (b) Cholesterol. (c) Stigmasterol, a common component of plant membranes. (d) Testosterone, a steroid hormone involved in male development in animals. (e) Sodium cholate, a bile salt, which aids in the digestion of lipids. (f) Ergosterol, a compound from fungi and yeast.
- Figure 16.18 Other products of isopentenyl pyrophosphate and cholesterol metabolism.
- Figure 9.14 Structures of several steroids. Squalene (a) is the precursor of most steroids. Steroids contain four fused rings (lettered A, B, C, and D). (b) Cholesterol. (c) Stigmasterol, a common component of plant membranes. (d) Testosterone, a steroid hormone involved in male development in animals. (e) Sodium cholate, a bile salt, which aids in the digestion of lipids. (f) Ergosterol, a compound from fungi and yeast.
- Structure of HMG-CoA and two common statins.
- Figure 9.18 Structures of arachidonic acid (a) and three eicosanoids derived from it. Arachidonate is a polyunsaturated fatty acid with four cis double bonds.
- Figure 16.12 Major pathways for the formation of eicosanoids. The prostaglandin H synthase (PGHS) pathway leads to prostaglandin H2, which can be converted to prostacyclin, thromboxane A2 and a variety of prostaglandins. The lipoxygenase pathway shown produces leukotriene A4, a precursor of some other leukotrienes. The cyclooxygenase activity of PGHS is inhibited by aspirin.
- Figure 9.20 Membrane lipid and bilayer. (a) An amphipathic membrane lipid. (b) Cross-section of a lipid bilayer. The hydrophilic head groups (blue) of each leaflet face the aqueous medium, and the hydrophobic tails (yellow) pack together in the interior of the bilayer.
- Figure 9.7 Structures of (a) phosphatidylethanolamine, (b) phosphatidylserine, and (c) phosphatidylcholine. Functional groups derived from esterified alcohols are shown in blue. Since each of these lipids can contain many combinations of fatty acyl groups, the general name refers to a family of compounds, not to a single molecule.
- Figure 9.9 Structure of an ethanolamine plasmalogen. A hydrocarbon is linked to the C-1 hydroxyl group of glycerol to form a vinyl ether.
- Figure 9.8 Action of four phospholipases. Phospholipases A1, A2, C, and D can be used to dissect glycerophospholipid structure. Phospholipases catalyze the selective removal of fatty acids from C-1 or C-2 or convert glycerophospholipids to diacylglycerols or phosphatidates.
- Figure 9.10 Structures of sphingosine, ceramide, and sphingomyelin. (a) Sphingosine, the backbone for sphingolipids, is a long-chain alcohol with an amino group at C-2. (b) Ceramides have a long-chain fatty acyl group attached to the amino group of sphingosine. (c) Sphingomyelins have a phosphate group (red) attached to the C-1 hydroxyl group of a ceramide and a choline group (blue) attached to the phosphate.
- Figure 9.10 Structures of sphingosine, ceramide, and sphingomyelin. (a) Sphingosine, the backbone for sphingolipids, is a long-chain alcohol with an amino group at C-2. (b) Ceramides have a long-chain fatty acyl group attached to the amino group of sphingosine. (c) Sphingomyelins have a phosphate group (red) attached to the C-1 hydroxyl group of a ceramide and a choline group (blue) attached to the phosphate.
- Pathways for the formation and degradation of a variety of sphingolipids, with hereditary metabolic diseases indicated.
- Pathways for the formation and degradation of a variety of sphingolipids, with hereditary metabolic diseases indicated.
- Figure 9.22 Diffusion of lipids within a bilayer. (a) Lateral diffusion of lipids is relatively rapid. (b) Transverse diffusion, or flip-flop, of lipids is very slow.
- Figure 9.23 Diffusion of membrane proteins. Human cells whose membrane proteins had been labeled with a red fluorescent marker were fused with mouse cells whose membrane proteins had been labeled with a green fluorescent marker. The initially localized markers became dispersed over the entire surface of the fused cell within 40 minutes.
- Box 9-4 Schematic cross-section of a lipid vesicle, or liposome. The bilayer is made up of two leaflets. In each leaflet, the polar head groups of the amphipathic lipids extend into the aqueous medium, and the nonpolar hydrocarbon tails point inward and are in van der Waals contact with each other.
- Figure 9.21 Structure of a typical eukaryotic plasma membrane. A lipid bilayer forms the basic matrix of biological membranes, and proteins (some of which are glycoproteins) are associated with it in various ways (Section 9.10). The oligosaccharides of glycoproteins and glycolipids are on the exterior surface of the membrane.
- Figure 9.27 Bacteriorhodopsin from Halobacterium salinarum. Seven membrane-spanning helices, connected by loops, form a bundle that spans the bilayer. The light-harvesting prosthetic group is shown in yellow. [PDB 1FBB]
- Figure 9.28 Ribbon structure of the transmembrane portion of porin FhuA from Escherichia coli. This porin forms a channel for the passage of protein- bound iron into the bacterium. The channel is formed from 22 antiparallel strands. [PDB 1BY3].
- Figure 9.29 Lipid-anchored membrane proteins attached to the plasma membrane. The three types of anchors can be found in the same membrane, but they do not form a complex as shown here. (a) A fatty acyl-anchored protein. (b) A prenyl-anchored membrane protein. Note that fatty acyl- and prenyl-anchored membrane proteins can also occur on the cytoplasmic (outer) leaflet of intracellular membranes. (c) Protein anchored by glycosylphosphatidylinositol. Shown here is the variant surface glycoprotein of the parasitic protozoan Trypanosoma brucei. The protein is covalently bound to a phosphoethanolamine residue, which in turn is bound to a glycan. The glycan (blue) includes a mannose residue, to which the phosphoethanolamine residue is attached, and a glucosamine residue, which is attached to the phosphoinositol group (red) of phosphatidylinositol. Abbreviations: GlcN, glucosamine; Ins, inositol; Man, mannose.
- Figure 9.31 Types of passive and active transport. Although the transport proteins are depicted as having an open central pore, passive and active transporters actually undergo conformational changes when transporting their solutes (Figure 9.33). (a) Uniport. (b) Symport. (c) Antiport.
- Figure 9.35 Secondary-active transport in animals. The Na+-K+ ATPase generates a sodium ion gradient that drives secondary active transport of glucose in intestinal cells.
- Figure 9.37 General mechanism of signal transduction across the plasma membrane of a cell.
- Figure 6.5: Three types of cell-surface receptors.
- Figure 9.38 Hydrolysis of guanosine 5'-triphosphate (GTP) to guanosine 5'-diphosphate (GDP) and phosphate (Pi).
- Figure 9.43 Summary of the adenylyl cyclase signaling pathway. Binding of a hormone to a stimulatory transmembrane receptor (Rs) leads to activation of the stimulatory G protein (Gs) on the inside of the membrane. Other hormones can bind to inhibitory receptors (Ri) which are coupled to adenylyl cyclase by the inhibitory G protein Gi. Gs activates the integral membrane enzyme adenylyl cyclase, whereas Gi inhibits it. cAMP activates protein kinase A, resulting in the phosphorylation of cellular proteins.
- Figure 9.40 Production and inactivation of cAMP. ATP is converted to cAMP by the transmembrane enzyme adenylyl cyclase. The second messenger is subsequently converted to 5'-AMP by the action of a cytosolic cAMP phosphodiesterase.
- Figure 9.41 Activation of protein kinase A. The assembled complex is inactive. When four molecules of cAMP bind to the regulatory subunit (R) dimer, the catalytic subunits (C) are released.
- Figure 9.45 Inositol–phospholipid signaling pathway. Binding of a ligand to its transmembrane receptor (R) activates the G protein (Gq) This in turn stimulates a specific membrane-bound phospholipase C (PLC), which catalyzes hydrolysis of the phospholipid PIP2 in the inner leaflet of the plasma membrane. The resulting second messengers, IP3 and diacylglycerol (DAG), are responsible for carrying the signal to the interior of the cell. IP3 diffuses to the endoplasmic reticulum, where it binds to and opens a Ca2+ channel in the membrane, releasing stored Ca2+. Diacylglycerol remains in the plasma membrane, where it—along with Ca2+—activates the enzyme protein kinase C (PKC).
- Figure 9.44 Phosphatidylinositol 4,5-bisphosphate (PIP2) produces two second messengers, inositol 1,4,5-trisphosphate (IP3) and diacylglycerol. PIP2 is synthesized by the addition of two phosphoryl groups (red) to phosphatidylinositol and hydrolyzed to IP3 and diacylglycerol by the action of a phosphoinositide-specific phospholipase C.
- Figure 9.46 Activation of receptor tyrosine kinases. Activation occurs as a result of ligand-induced receptor dimerization. Each kinase domain catalyzes phosphorylation of its partner. The phosphorylated dimer can catalyze phosphorylation of various target proteins.
- Figure 9.47 Insulin receptor. Two extracellular chains, each with an insulin-binding site, are linked to two transmembrane chains, each with a cytosolic tyrosine kinase domain. Following insulin binding to the chains, the tyrosine kinase domain of each chain catalyzes autophosphorylation of tyrosine residues in the adjacent kinase domain. The tyrosine kinase domains also catalyze the phosphorylation of proteins called insulin-receptor substrates (IRSs).
- Figure 11.13 Regulation of glucose transport by insulin. The binding of insulin to cell-surface receptors stimulates intracellular vesicles containing membrane-embedded GLUT4 transporters to fuse with the plasma membrane. This delivers GLUT4 transporters to the cell surface and thereby increases the capacity of the cell to transport glucose.
- Figure 9.48 Insulin-stimulated formation of phosphatidylinositol 3,4,5-trisphosphate PIP3. Binding of insulin to its receptor activates the protein tyrosine kinase activity of the receptor, leading to the phosphorylation of insulin-receptor substrates (IRSs). The phosphorylated IRSs interact with phosphatidylinositide 3-kinase (PI kinase) at the plasma membrane, where the enzyme catalyzes the phosphorylation of PIP2 to PIP3. PIP3 acts as a second messenger, carrying the message from extracellular insulin to certain intracellular protein kinases.