
Recommended
More Related Content
What's hot
What's hot (18)
Viewers also liked
Viewers also liked (12)
Similar to Moléculas orgánicas proteina Qui403 USC
Similar to Moléculas orgánicas proteina Qui403 USC (20)
More from jlquinonesrivera
Recently uploaded
Recently uploaded (20)
Moléculas orgánicas proteina Qui403 USC
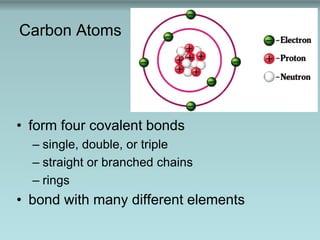
- 1. Carbon Atoms • form four covalent bonds – single, double, or triple – straight or branched chains – rings • bond with many different elements
- 2. Fig. 3-1, p. 46
- 3. C H H H H C H H H OH C O H OHC O H H C H H H C H H H C H H H C H H OH C H H H C O H C O OHC H H H C H H HC H H H C O C H H HC H H H C H H C H H OHC H H H C H H C H O HC H H H C H C H O OHC H H H C H
- 5. Table 3-1a, p. 49
- 6. Table 3-1b, p. 49
- 7. Polymers and Macromolecules • Polymers – long chains of monomers – linked through condensation reactions • Macromolecules – large polymers – polysaccharides, proteins, and DNA – broken down by hydrolysis reactions
- 10. Monosaccharides
- 11. Fig. 3-6, p. 51 Dihydroxyacetone (C3H6O3) (a ketone) (a) Triose sugars (3-carbon sugars) Glyceraldehyde (C3H6O3) (an aldehyde)
- 12. Fig. 3-6, p. 51
- 13. Disaccharides
- 15. • Starch • Glycogen
- 16. Cellulose
- 18. • Triglycerides = three fatty acids attached to one molecule of glycerol Triglyceride Formation Figure 2.15 Lipids
- 19. Triacylglycerol
- 22. Fig. 3-13, p. 58 Fatty acidsCholine Phosphate group Glycerol Hydrophilic head Hydrophobic tail Water
- 23. Steroids • Carbon atoms arranged in 4 rings – cholesterol, bile salts, some hormones
- 24. Figure 2.16 Steroids Figure 2.16
- 25. Estructura y función de las proteínas
- 28. Nucleotides • ATP (adenosine triphosphate) – essential in energy metabolism • NAD+ – electron acceptor in biological oxidation and reduction reactions
- 30. Fig. 4-6, p. 81 Plasma membrane 0.5 μm Pili Storage granule Flagellum Ribosome Cell wall CapsuleNuclear area DNA
- 33. • The cell membrane is a phospholipid bilayer with proteins, lipids and carbohydrates. Figure 3.3
- 36. Peroxisomas
- 38. Fig. 4-19, p. 95 Cristae 0.25 μm Outer mitochondrial membrane Inner mitochondrial membrane Matrix Mitocondrias
- 39. Figure 2.5 H2O
- 43. Figure 2.6
- 49. Na+ Cl-
- 51. Fig. 3-1, p. 46 Moléculas no polares son insolubles en agua o hidrofóbicas
- 52. Solubilidad de hexanol = 0.0058 mol/100g H2O Solubilidad de glucosa = 0.5 mol/100g H2O hexanol
- 53. Figure 2.8
- 56. Fig. 3-13, p. 58 Fatty acidsCholine Phosphate group Glycerol Hydrophilic head Hydrophobic tail Water
- 57. Ionización del Agua Kw = [1 X 10⁻⁷ M ] [1 X 10⁻⁷ M ] = 1 X 10-14 M2 [ H+ ] =1 X 10⁻⁷ M Kw = [ H+ ] [OH- ] = 1 X 10-14 M2 constante de producto iónico del agua [ OH- ] = 1 X 10⁻⁷ M pH = - log [H+ ] = 7 pOH = - log [OH- ] = 7 H2O H+ + OH - ácido base Kw= keq [H2O]
- 58. Figure 2.9 pH = - log [H+ ] [H+ ] = 1 x 10-pH Metros de pH
- 59. Copyright © 2004 Pearson Education, Inc., publishing as Benjamin Cummings • Acids release hydrogen ions into solution • Bases remove hydrogen ions from solution • Strong acids and strong bases ionize completely Acids and Bases HCL H+ + CL NaOH Na+ + OH OH + H+ H2O NaOH + HCl NaCl + H2O ácido base
- 60. HCl -- pH ácido NaOH -- pOH base NaOH + HCl NaCl + H2O pH = - log [H+ ] [H+ ] = 1 x10-pH :. [H+ ] = 10-pH 1. Busque el pH para los siguientes: a) HCl 0.0001M b) HCl 0.01M c) NaOH 0.0001M d) HCl 0.0013M e) NaOH 0.00008M 2. Busque la concentración del [H+ ] para los siguientes: a) pH = 3 b) pH = 9 c) pH = 5 d) pOH = 9 e) pOH = 4
- 61. CH3COOH H+ + CH3CO¯ ácidos débiles Ka = [H+ ] [A- ] [HA] HA H+ + A- Ka = [H+ ] [CH3CO¯] [CH3COOH] C O OHC H H H C O O¯C H H H + H+ * pKa = 4.75448
- 62. CH3COOH H+ + CH3CO¯ ácidos débiles Ka = [H+ ] [A- ] [HA] log Ka = log [H+ ] + log [A- ] [HA] -log [H+ ] = - log Ka + log [A- ] [HA] pH = pKa + log [A- ] [HA] Henderson-Hasselbalck Si [HA] = [A- ] :. pH = pKa + 0 HA H+ + A-
- 63. Acetic acid pK=4.8 Prepare a Buffer pH=5.8 pH = pKa + log [A- ] [HA] 5.8 = 4.8 + log [Acetate] [Acetic Acid] 5.8 - 4.8 = log [Acetate] [Acetic Acid] 1 = log [Acetate] [Acetic Acid] 101 = [Acetate] [Acetic Acid] 10 [Acetic Acid] = 1 [Acetate]
- 64. CH3COOH H+ + CH3CO Acidos Débiles
- 66. Amortiguadores H2O + CO2 H2CO3 HCO3 + H+
- 68. H2O + CO2 H2CO3 HCO3 + H+ NaCL Na+ + Cl HCL NaHCO3 Ácido clorhídrico Bicarbonato de Sodio
- 69. Estructura y función de las proteínas ¿Funciones?
- 70. 1. Many proteins function as enzymes, the biochemical catalysts. 2. Some proteins bind other molecules for storage and transport. 3. Several types of proteins serve as pores and channels in membranes 4. Some proteins provide support and shape to cells and tissues. 5. Assemblies of proteins can do mechanical work 6. Some are involved in translation whereas others play a role in regulating gene expression by binding to nucleic acids. 7. Some proteins are hormones other proteins serve as receptors for hormones. 9. Some proteins are antibodies to defend against bacterial and viral infections.
- 72. N- terminal C-Terminal
- 80. Serotonin (Tryptophan) GABA (Glutamate) Glutamate Glycine Dopamine Norepinephrine Epinephrine Neurotransmitters Histamine
- 82. Dipolar Ions
- 88. Amino acid pKa1 pKa2 pKa3 pI Glycine 2.34 9.60 --- 5.97 Alanine 2.34 9.69 --- 6.00 Valine 2.32 9.62 --- 5.96 Leucine 2.36 9.60 --- 5.98 Isoleucine 2.36 9.60 --- 6.02 Methionine 2.28 9.21 --- 5.74 Proline 1.99 10.60 --- 6.30 Phenylalanine 1.83 9.13 --- 5.48 Tryptophan 2.83 9.39 --- 5.89 Asparagine 2.02 8.80 --- 5.41 Glutamine 2.17 9.13 --- 5.65 Serine 2.21 9.15 --- 5.68 Threonine 2.09 9.10 --- 5.60 Tyrosine 2.20 9.11 --- 5.66 Cysteine 1.96 8.18 --- 5.07 Aspartic acid 1.88 9.60 3.65 2.77 Glutamic acid 2.19 9.67 4.25 3.22 Lysine 2.18 8.95 10.53 9.74 Arginine 2.17 9.04 12.48 10.76 Histidine 1.82 9.17 6.00 7.59 Table of pKa and pI values •The pKa values and the isoelectronic point, pI, are given below for the 20 α-amino acids. •pKa1 = α-carboxyl group, pKa2 = α-ammonium ion, and pKa3 = side chain group.
- 92. Primary Structure • Linear sequence of amino acids in polypeptide chain N- terminal C-Terminal
- 101. Amino ácidos polares hacia el agua y no polares hacia adentro
- 104. Tertiary Structure
- 107. Motifs
- 108. Domains Pyruvate kinase from cat
- 109. Domains
- 111. Tertiary structure of polypeptide
- 117. Estructura terciaria y pH
- 118. Lactate dehydrogenase Malate dehydrogenase
- 121. Citocromo C b- tuna c- rice d- yeast e- bacterial
- 122. Aplysia myoglobin Tuna myoglobin Whale myoglobin Human myoglobin
- 126. Alzheimer's disease has been identified as a protein misfolding disease, or proteopathy, due to the accumulation of abnormally folded Amyloid-beta proteins in the brains of AD patients.[1] Amyloid-beta, also written Aβ, is a short peptide that is a proteolytic byproduct of the transmembrane protein amyloid precursor protein (APP), whose function is unclear but thought to be involved in neuronal development. The presenilins are components of a proteolytic complex involved in APP processing and degradation.[3] Although amyloid beta monomers are harmless, they undergo a dramatic conformational change at sufficiently high concentration to form a beta sheet-rich tertiary structure that aggregates to form amyloid fibrils[6] that deposit outside neurons in dense formations known as senile plaques or neuritic plaques. AD is also considered a tauopathy due to abnormal aggregation of the tau protein, a microtubule-associated protein expressed in neurons that normally acts to stabilize microtubules in the cell cytoskeleton. Like most microtubule-associated proteins, tau is normally regulated by phosphorylation; however, in AD patients, hyperphosphorylated tau accumulates as paired helical filaments[7] that in turn aggregate into masses inside nerve cell bodies known as neurofibrillary tangles and as dystrophic neurites associated with amyloid plaques.
- 129. Enzyme-Substrate Complex • Substrate binds to enzyme’s active site – forming enzyme–substrate complex – changes shapes of enzyme and substrate – induced fit helps break and form bonds
- 131. Quaternary Structure
- 133. Reverse transcriptase (RNA-dependent DNA polymerase)
- 135. Figure 19.3
- 137. Myoglobin b subunit of hemoglobin
- 138. Color code: α-globin (blue), β-globin (purple), myoglobin (green).
- 139. Chemical structure of the Fe(II)- protoporphyrin IX heme group in myoglobin and hemoglobin.
- 142. Figure 23.21
- 146. Figure 23.22a, b
- 150. Antibody Diversity
- 151. Figure 10–1
- 152. Figure 10–3
- 153. Figure 10–13
- 154. A Thin Filament Figure 10–7a
- 155. Troponin and Tropomyosin Figure 10–7b
- 156. A Thick Filament Figure 10–7c
- 157. The Mysosin Molecule Figure 10–7d
- 159. Skeletal Muscle Innervation Figure 10–10a, b (Navigator)
- 161. Figure 10–11 Regulación de la contracción por Ca++
- 162. Copyright © 2009 Pearson Education, Inc., publishing as Pearson Benjamin Cummings The Contraction Cycle Figure 10–12 The Contraction Cycle.
- 163. Copyright © 2009 Pearson Education, Inc., publishing as Pearson Benjamin Cummings The Contraction Cycle [INSERT FIG. 10.12, step 1] Figure 10–12 The Contraction Cycle.
- 164. Copyright © 2009 Pearson Education, Inc., publishing as Pearson Benjamin Cummings The Contraction Cycle Figure 10–12 The Contraction Cycle.
- 165. Copyright © 2009 Pearson Education, Inc., publishing as Pearson Benjamin Cummings The Contraction Cycle Figure 10–12 The Contraction Cycle.
- 166. Copyright © 2009 Pearson Education, Inc., publishing as Pearson Benjamin Cummings The Contraction Cycle Figure 10–12 The Contraction Cycle.
- 167. Copyright © 2009 Pearson Education, Inc., publishing as Pearson Benjamin Cummings The Contraction Cycle Figure 10–12 The Contraction Cycle.
Editor's Notes
- Figure 3.1: Organic molecules. Note that each carbon atom forms four covalent bonds, producing a wide variety of shapes.
- Figure 2.14 Hydrolysis of a peptide. In the presence of water the peptide bonds in proteins and peptides are hydrolyzed. Condensation, the reverse of hydrolysis, is not thermodynamically favored.
- Figure 3.6: Monosaccharides. Shown are 2-D chain structures of (a) three-carbon trioses, (b) five-carbon pentoses, and (c) six-carbon hexoses. Although it is convenient to show monosaccharides in this form, the pentoses and hexoses are more accurately depicted as ring structures, as in Figure 3-7. The carbonyl group (gray screen) is terminal in aldehyde sugars and located in an internal position in ketones. Deoxyribose differs from ribose because deoxyribose has one less oxygen; a hydrogen (white screen) instead of a hydroxyl group (blue screen) is attached to carbon 2. Glucose and galactose are enantiomers that differ in the arrangement of the hydroxyl group and hydrogen attached to carbon 4 (red box).
- Figure 3.6: Monosaccharides. Shown are 2-D chain structures of (a) three-carbon trioses, (b) five-carbon pentoses, and (c) six-carbon hexoses. Although it is convenient to show monosaccharides in this form, the pentoses and hexoses are more accurately depicted as ring structures, as in Figure 3-7. The carbonyl group (gray screen) is terminal in aldehyde sugars and located in an internal position in ketones. Deoxyribose differs from ribose because deoxyribose has one less oxygen; a hydrogen (white screen) instead of a hydroxyl group (blue screen) is attached to carbon 2. Glucose and galactose are enantiomers that differ in the arrangement of the hydroxyl group and hydrogen attached to carbon 4 (red box).
- FIGURE 3-9 Cellulose structure and function Cellulose can be incredibly tough. (a) Wood in this 3000-year-old bristlecone pine is primarily cellulose. (b) Cellulose forms the cell wall that surrounds each plant cell. (c) Plant cell walls often consist of cellulose fibers in layers that run at angles to each other and resist tearing in both directions. (d) Cellulose is composed of glucose subunits. Compare this structure with Fig. 3-8c and notice that every other glucose molecule in cellulose is "upside down."
- FIGURE 3-10 Chitin: A unique polysaccharide Chitin has the same bonding configuration of glucose molecules as cellulose does. In chitin, however, the glucose subunits have a nitrogen-containing functional group (yellow) instead of a hydroxyl group. Tough, flexible chitin supports the otherwise soft bodies of arthropods (insects, spiders, and their relatives) and certain fungi, such as this mushroom.
- Figure 3.13: A phospholipid and a phospholipid bilayer.
- Figure 4.6: Structure of a prokaryotic cell. This colorized TEM shows a thin lengthwise slice through an Escherichia coli bacterium. Note the prominent nuclear area containing the genetic material (DNA). E. coli is a normal inhabitant of the human intestine, but under certain conditions some strains can cause infections.
- Figure 4.19: Mitochondria. Aerobic respiration takes place within mitochondria. Cristae are evident in the TEM as well as in the drawing. The drawing shows the relationship between the inner and outer mitochondrial membranes.
- Figure 2.2 Polarity of small molecules. (a) The geometry of the polar covalent bonds of water creates a permanent dipole for the molecule, with the oxygen bearing a partial negative charge (symbolized by 2–) and each hydrogen bearing a partial positive charge (symbolized by +). (b) The pyramidal shape of a molecule of ammonia also creates a permanent dipole. (c) The polarities of the collinear bonds in carbon dioxide cancel each other. Therefore, CO2 is not polar. (Arrows depicting dipoles point toward the negative charge, with a cross at the positive end.)
- Figure 2.1 (a) Space-filling structure of a water molecule. (b) Angle between the covalent bonds of a water molecule. Two of the sp3 hybrid orbitals of the oxygen atom participate in covalent bonds with s orbitals of hydrogen atoms. The other two orbitals are occupied by lone pairs of electrons.
- Figure 2.3 Hydrogen bonding between two water molecules. A partially positive (+) hydrogen atom of one water molecule attracts the partially negative (2 –) oxygen atom of a second water molecule, forming a hydrogen bond. The distances between atoms of two water molecules in ice are shown. Hydrogen bonds are indicated by dashed lines highlighted in yellow as shown here and throughout the book.
- Figure 2.4 Hydrogen bonding by a water molecule. A water molecule can form up to four hydrogen bonds: the oxygen atom of a water molecule is the hydrogen acceptor for two hydrogen atoms, and each O—H group serves as a hydrogen donor.
- Figure 2.5 Structure of ice. Water molecules in ice form an open, hexagonal lattice in which every water molecule is hydrogen-bonded to four others. The geometrical regularity of these hydrogen bonds contributes to the strength of the ice crystal. The hydrogen-bonding pattern of liquid water is more irregular than that of ice. The absolute structure of liquid water has not been determined.
- Figure 2.2 Polarity of small molecules. (a) The geometry of the polar covalent bonds of water creates a permanent dipole for the molecule, with the oxygen bearing a partial negative charge (symbolized by 2–) and each hydrogen bearing a partial positive charge (symbolized by +). (b) The pyramidal shape of a molecule of ammonia also creates a permanent dipole. (c) The polarities of the collinear bonds in carbon dioxide cancel each other. Therefore, CO2 is not polar. (Arrows depicting dipoles point toward the negative charge, with a cross at the positive end.)
- Figure 2.11 Hydrogen bonding between the complementary bases guanine and cytosine in DNA.
- Figure 2.6 Dissolution of sodium chloride (NaCl) in water. (a) The ions of crystalline sodium chloride are held together by electrostatic forces. (a) Water weakens the interactions between the positive and negative ions, and the crystal dissolves. Each dissolved Na+ and Cl– is surrounded by a solvation sphere. Only one layer of solvent molecules is shown. Interactions between ions and water molecules are indicated by dashed lines.
- Figure 2.6 Dissolution of sodium chloride (NaCl) in water. (a) The ions of crystalline sodium chloride are held together by electrostatic forces. (a) Water weakens the interactions between the positive and negative ions, and the crystal dissolves. Each dissolved Na+ and Cl– is surrounded by a solvation sphere. Only one layer of solvent molecules is shown. Interactions between ions and water molecules are indicated by dashed lines.
- Figure 3.1: Organic molecules. Note that each carbon atom forms four covalent bonds, producing a wide variety of shapes.
- Figure 2.7 Structure of glucose. Glucose contains five hydroxyl groups and a ring oxygen, each of which can form hydrogen bonds with water.
- Figure 2.8 Sodium dodecyl sulfate (SDS), a synthetic detergent.
- Figure 2.9 Cross-sectional views of structures formed by detergents in water. Detergents can form monolayers at the air–water interface. They can also form micelles, aggregates of detergent molecules in which the hydrocarbon tails (yellow) associate in the water-free interior and the polar head groups (blue) are hydrated.
- Figure 3.13: A phospholipid and a phospholipid bilayer.
- Figure 2.16 Titration of acetic acid (CH3COOH) with aqueous base (OH–). There is an inflection point (a point of minimum slope) at the midpoint of the titration, when 0.5 equivalent of base has been added to the solution of acetic acid. This is the point at which [CH3COOH] = [CH3C00–] and pH = pKa. The pKa of acetic acid is thus 4.8. At the endpoint, all the molecules of acetic acid have been titrated to the conjugate base, acetate.
- Figure 2.16 Titration of acetic acid (CH3COOH) with aqueous base (OH–). There is an inflection point (a point of minimum slope) at the midpoint of the titration, when 0.5 equivalent of base has been added to the solution of acetic acid. This is the point at which [CH3COOH] = [CH3C00–] and pH = pKa. The pKa of acetic acid is thus 4.8. At the endpoint, all the molecules of acetic acid have been titrated to the conjugate base, acetate.
- Figure 2.18 Titration curve for phosphoric acid H3PO4. Three inflection points (at 0.5, 1.5, and 2.5 equivalents of strong base added) correspond to the three pKa values for phosphoric acid (2.2, 7.2, and 12.7).
- Figure 2.20 Regulation of the pH of blood in mammals. The pH of blood is controlled by the ratio of [HCO3–] to pCO2 in the air spaces of the lungs. When the pH of blood decreases due to excess HM, pCO2 increases in the lungs, restoring the equilibrium. When the concentration of HCO3– rises because the pH of blood increases, CO2 (gaseous) dissolves in the blood, again restoring the equilibrium.
- Numbering conventions for amino acids. In traditional names, the carbon atoms adjacent to the carboxyl group are identified by the Greek letters , , , etc. In the official IUPAC/IUBMB chemical names or systematic names, the carbon atom in the carboxyl group is number 1 and the adjacent carbons are numbered sequentially. Thus, the atom in traditional names is the carbon 2 atom in systematic names.
- Figure 3.1 Two representations of an L-amino acid at neutral pH. (a) General structure. An amino acid has a carboxylate group (whose carbon atom is designated C-1), an amino group, a hydrogen atom, and a side chain (or R group), all attached to C-2 (the -carbon). Solid wedges indicate bonds above the plane of the paper; dashed wedges indicate bonds below the plane of the paper. The blunt ends of wedges are nearer the viewer than the pointed ends. (b) Ball-and-stick model of serine (whose R group is —CH2OH). Note the alternative numbering and lettering systems for the carbon atoms.
- Figure 3.2 Mirror-image pairs of amino acids. (a) Ball-and-stick models of L-serine and D-serine. Note that the two molecules are not identical; they cannot be superimposed. (b) L-Serine and D-serine.
- Figure 3.5 Compounds derived from common amino acids. (a) -Aminobutyrate a derivative of glutamate. (b) Histamine, a derivative of histidine. (c) Epinephrine, a derivative of tyrosine. (d) Thyroxine and triiodothyronine, derivatives of tyrosine. Thyroxine contains one more atom of iodine (in parentheses) than does triiodothyronine.
- Figure 3.11 Column chromatography. (a) A mixture of proteins is added to a column containing a solid matrix. Solvent then flows into the column from a reservoir. Washed by solvent, different proteins (represented by red and blue bands) travel through the column at different rates, depending on their interactions with the matrix. Eluate is collected in a series of fractions, a few of which are shown. (b) The protein concentration of each fraction is determined by measuring the absorbance at 280 nm. The peaks correspond to the elution of the protein bands shown in (a). The fractions are then tested for the presence of the target protein.
- Figure 3.12 SDS–PAGE. (a) An electrophoresis apparatus includes an SDS–polyacrylamide gel between two glass plates and buffer in the upper and lower reservoirs. Samples are loaded into the wells of the gel, and voltage is applied. Since proteins complexed with SDS are negatively charged, they migrate toward the anode. (b) The banding pattern of the proteins after electrophoresis can be visualized by staining. Since the smallest proteins migrate fastest, the proteins of lowest molecular weight are at the bottom of the gel.
- Figure 4.1 Levels of protein structure. (a) The linear sequence of amino acid residues defines the primary structure. (b) Secondary structure consists of regions of regularly repeating conformations of the peptide chain, such as helices and sheets. (c) Tertiary structure describes the shape of the fully folded polypeptide chain. The example shown has two domains. (d) Quaternary structure refers to the arrangement of two or more polypeptide chains into a multisubunit molecule.
- Figure 3.23 Cytochrome c sequences. The sequences of cytochrome c proteins from various species are aligned to show their similarities. In some cases, gaps (signified by hyphens) have been introduced to improve the alignment. The gaps represent deletions and insertions in the genes that encode these proteins. For some species, additional residues at the ends of the sequence have been omitted. Hydrophobic residues are blue and polar residues are red.
- Figure 3.24 Phylogenetic tree for cytochrome c. The length of the branches reflects the number of differences between the sequences of many cytochrome c proteins. [Adapted from Schwartz, R. M., and Dayhoff, M. O. (1978). Origins of prokaryotes, eukaryotes, mitochondria, and chloroplasts. Science 199:395–403.]
- Figure 4.10 Helix. A region of -helical secondary structure is shown with the N-terminus at the bottom and the C-terminus at the top of the figure. Each carbonyl oxygen forms a hydrogen bond with the amide hydrogen of the fourth residue further toward the C-terminus of the polypeptide chain. The hydrogen bonds are approximately parallel to the long axis of the helix. Note that all the carbonyl groups point toward the C-terminus. In an ideal helix, equivalent positions recur every 0.54 nm (the pitch of the helix), each amino acid residue advances the helix by 0.15 nm along the long axis of the helix (the rise), and there are 3.6 amino acid residues per turn. In a right-handed helix, the backbone turns in a clockwise direction when viewed along the axis from its N-terminus. If you imagine that the right-handed helix is a spiral staircase, you will be turning to the right as you walk down the staircase.
- Figure 4.11 View of a right-handed helix. The blue ribbon indicates the shape of the polypeptide backbone. All the side chains, shown as ball-and- stick models, project outward from the helix axis. This example is from residues Ile-355 (bottom) to Gly-365 (top) of horse liver alcohol dehydrogenase. Some hydrogen atoms are not shown. [PDB 1ADF].
- Figure 4.2 X-ray crystallography. (a) Diagram of X rays diffracted by a protein crystal. (b) X-ray diffraction pattern of a crystal of adult human deoxyhemoglobin. The location and intensity of the spots are used to determine the three-dimensional structure of the protein.
- Figure 4.2 X-ray crystallography. (a) Diagram of X rays diffracted by a protein crystal. (b) X-ray diffraction pattern of a crystal of adult human deoxyhemoglobin. The location and intensity of the spots are used to determine the three-dimensional structure of the protein.
- Figure 4.20 Pyruvate kinase from cat (Felis domesticus). The main polypeptide chain of this common enzyme folds into three distinct domains as indicated by brackets. [PDB 1PKM].
- Figure 4.28 Disulfide bridges in bovine ribonuclease A. (a) Location of disulfide bridges in the native protein. (b) View of the disulfide bridge between Cys-26 and Cys-84 [PDB 2AAS].
- Figure 4.29 Denaturation and renaturation of ribonuclease A. Treatment of native ribonuclease A (top) with urea in the presence of 2-mercaptoethanol unfolds the protein and disrupts disulfide bonds to produce reduced, reversibly denatured ribonuclease A (bottom). When the denatured protein is returned to physiological conditions in the absence of 2-mercaptoethanol, it refolds into its native conformation and the correct disulfide bonds form. However, when 2-mercaptoethanol alone is removed, ribonuclease A reoxidizes in the presence of air, but the disulfide bonds form randomly, producing inactive protein (such as the form shown on the right). When urea is removed, a trace of 2-mercaptoethanol is added to the randomly reoxidized protein, and the solution is warmed gently, the disulfide bonds break and re-form correctly to produce native ribonuclease A.
- Figure 4.22 Structural similarity of lactate and malate dehydrogenase. (a) Bacillus stereothermophilus lactate dehydrogenase [PDB 1LDN]. (b) Escherichia coli malate dehydrogenase [PDB 1EMD].
- Figure 4.23 Examples of tertiary structure in selected proteins. (a) Human (Homo sapiens) serum albumin [PDB 1BJ5] (class: all-). This protein has several domains consisting of layered helices and helix bundles. (b) Escherichia coli cytochrome 562 [PDB 1QPU] (class: all-). This is a heme-binding protein consisting of a single four-helix bundle domain. (c) Escherichia coli UDP N-acetylglucosamine acyl transferase [PDB 1LXA] (class: all-). The structure of this enzyme shows a classic example of a -helix domain. (d) Jack bean (Canavalia ensiformis) concanavalin A [PDB 1CON] (class: ). This carbohydrate-binding protein (lectin) is a single-domain protein made up of a large -sandwich fold. (e) Human (Homo sapiens) peptidylprolyl cis/trans isomerase [PDB 1VBS] (class: all-). The dominant feature of the structure is a -sandwich fold. (f) Cow (Bos taurus -crystallin) [PDB 1A45] (class: all-) This protein contains -barrel two domains. (g) Jellyfish (Aequorea victoria) green fluorescent protein [PDB 1GFL] (class: all-). This is a -barrel structure with a central helix. The strands of the sheet are antiparallel. (h) Pig (Sus scrofa) retinol-binding protein [PDB 1AQB] (class: all-). Retinol binds in the interior of a -barrel fold. (i) Brewer’s yeast (Saccharomyces carlsburgensis) old yellow enzyme (FMN oxidoreductase) [PDB 1OYA] (class: /). The central fold is an / barrel with parallel strands connected by helices. Two of the connecting -helical regions are highlighted in yellow. (j) Escherichia coli enzyme required for tryptophan biosynthesis [PDB 1PII] (class: /). This is a bifunctional enzyme containing two distinct domains. Each domain is an example of an / barrel. The left-hand domain contains the indolglycerol phosphate synthetase activity, and the right-hand domain contains the phosphoribosylanthranilate isomerase activity. (k) Pig (Sus scrofa) adenylyl kinase [PDB 3ADK] (class: /). This single-domain protein consists of a five-stranded parallel sheet with layers of helices above and below the sheet. The substrate binds in the prominent groove between a helices. (l) Escherichia coli flavodoxin [PDB 1AHN] (class: /). The fold is a five-stranded parallel twisted sheet surrounded by helices. (m) Human (Homo sapiens) thioredoxin [PDB 1ERU] (class: /). The structure of this protein is very similar to that of E. coli flavodoxin except that the five-stranded twisted sheet in the thioredoxin fold contains a single antiparallel strand. (n) Escherichia coli L-arabinose-binding protein [PDB 1ABE] (class: /). This is a two-domain protein where each domain is similar to that in E. coli flavodoxin. The sugar L-arabinose binds in the cavity between the two domains. (o) Escherichia coli DsbA (thiol-disulfide oxidoreductase/ disulfide isomerase) [PDB 1A23] (class: /). The predominant feature of this structure is a (mostly) antiparallel sheet sandwiched between helices. Cysteine side chains at the end of one of the helices are shown (sulfur atoms are yellow). (p) Neisseria gonorrhea pilin [PDB 2PIL] (class: + ). This polypeptide is one of the subunits of the pili on the surface of the bacteria responsible for gonorrhea. There are two distinct regions of the structure: a sheet and a long a helix.
- Figure 4.23 Examples of tertiary structure in selected proteins. (a) Human (Homo sapiens) serum albumin [PDB 1BJ5] (class: all-). This protein has several domains consisting of layered helices and helix bundles. (b) Escherichia coli cytochrome 562 [PDB 1QPU] (class: all-). This is a heme-binding protein consisting of a single four-helix bundle domain. (c) Escherichia coli UDP N-acetylglucosamine acyl transferase [PDB 1LXA] (class: all-). The structure of this enzyme shows a classic example of a -helix domain. (d) Jack bean (Canavalia ensiformis) concanavalin A [PDB 1CON] (class: ). This carbohydrate-binding protein (lectin) is a single-domain protein made up of a large -sandwich fold. (e) Human (Homo sapiens) peptidylprolyl cis/trans isomerase [PDB 1VBS] (class: all-). The dominant feature of the structure is a -sandwich fold. (f) Cow (Bos taurus -crystallin) [PDB 1A45] (class: all-) This protein contains -barrel two domains. (g) Jellyfish (Aequorea victoria) green fluorescent protein [PDB 1GFL] (class: all-). This is a -barrel structure with a central helix. The strands of the sheet are antiparallel. (h) Pig (Sus scrofa) retinol-binding protein [PDB 1AQB] (class: all-). Retinol binds in the interior of a -barrel fold. (i) Brewer’s yeast (Saccharomyces carlsburgensis) old yellow enzyme (FMN oxidoreductase) [PDB 1OYA] (class: /). The central fold is an / barrel with parallel strands connected by helices. Two of the connecting -helical regions are highlighted in yellow. (j) Escherichia coli enzyme required for tryptophan biosynthesis [PDB 1PII] (class: /). This is a bifunctional enzyme containing two distinct domains. Each domain is an example of an / barrel. The left-hand domain contains the indolglycerol phosphate synthetase activity, and the right-hand domain contains the phosphoribosylanthranilate isomerase activity. (k) Pig (Sus scrofa) adenylyl kinase [PDB 3ADK] (class: /). This single-domain protein consists of a five-stranded parallel sheet with layers of helices above and below the sheet. The substrate binds in the prominent groove between a helices. (l) Escherichia coli flavodoxin [PDB 1AHN] (class: /). The fold is a five-stranded parallel twisted sheet surrounded by helices. (m) Human (Homo sapiens) thioredoxin [PDB 1ERU] (class: /). The structure of this protein is very similar to that of E. coli flavodoxin except that the five-stranded twisted sheet in the thioredoxin fold contains a single antiparallel strand. (n) Escherichia coli L-arabinose-binding protein [PDB 1ABE] (class: /). This is a two-domain protein where each domain is similar to that in E. coli flavodoxin. The sugar L-arabinose binds in the cavity between the two domains. (o) Escherichia coli DsbA (thiol-disulfide oxidoreductase/ disulfide isomerase) [PDB 1A23] (class: a/b). The predominant feature of this structure is a (mostly) antiparallel sheet sandwiched between helices. Cysteine side chains at the end of one of the helices are shown (sulfur atoms are yellow). (p) Neisseria gonorrhea pilin [PDB 2PIL] (class: + ). This polypeptide is one of the subunits of the pili on the surface of the bacteria responsible for gonorrhea. There are two distinct regions of the structure: a sheet and a long a helix.
- Figure 4.21 Cytochrome c. (a) Tuna (Thunnus alalunga) cytochrome c bound to heme [PDB 5CYT]. (b) Tuna cytochrome c polypeptide chain. (c) Rice (Oryza sativa) cytochrome c [PDB 1CCR]. (d) Yeast (Saccharomyces cerevisiae) cytochrome c [PDB 1YCC]. (e) Bacterial (Rhodopila globiformis) cytochrome c [PDB 1HRO].
- Figure 4.25 Quaternary structure. (a) Chicken (Gallus gallus) triose phosphate isomerase [PDB 1TIM]. This protein has two identical subunits with / barrel folds. (b) HIV-1 aspartic protease [PDB 1DIF]. This protein has two identical all- subunits that bind symmetrically. HIV protease is the target of many new drugs designed to treat AIDS patients. (c) Streptomyces lividans potassium channel protein [PDB 1BL8]. This membrane-bound protein has four identical subunits, each of which contributes to a membrane-spanning eight-helix bundle. (d) Bacteriophage MS2 capsid protein [PDB 2MS2]. The basic unit of the MS2 capsid is a trimer of identical subunits with a large sheet. (e) Human (Homo sapiens) hypoxanthine-guanine phosphoribosyl transferase (HGPRT) [PDB 1BZY]. HGPRT is a tetrameric protein containing two different types of subunit. (f) Rhodopseudomonas viridis photosystem [PDB 1PRC]. This complex, membrane-bound protein has two identical subunits (orange, blue) and two other subunits (purple, green) bound to several molecules of photosynthetic pigments.
- Figure 4.39 Chemical structure of the Fe(II)-protoporphyrin IX heme group in myoglobin and hemoglobin. The porphyrin ring provides four of the six ligands that surround the iron atom.
- Figure 5.23 Conformational changes during oxygen binding to hemoglobin. The tertiary structure of a single chain changes as oxygen is bound. The quaternary structure of hemoglobin changes from the T state to the R state only when at least one subunit on each dimer is oxygenated. Only four of the eight possible partially oxygenated species are shown (e.g., oxygen could bind initially to either an or a chain, and so on). [Adapted from Ackers, G. K., Doyle, M. L., Myers, D., and Daugherty, M. A. (1992). Molecular code for cooperativity in hemoglobin. Science 255:54–63.]
- Figure 4.49 Binding of 2,3BPG to deoxyhemoglobin. The central cavity of deoxyhemoglobin is lined with positively charged groups that are complementary to the carboxylate and phosphate groups of 2,3BPG. Both 2,3BPG and the ion pairs shown help stabilize the deoxy conformation. The subunits are shown in pink, the subunits in blue, and the heme prosthetic groups in red.
- Figure 4.54 Binding of three different antibodies to an antigen (the protein lysozyme). The structures of the three antigen-antibody complexes have been determined by X-ray crystallography. This composite view, in which the antigen and antibodies have been separated, shows the surfaces of the antigen and antibodies that interact. Only parts of the three antibodies are shown.