
Recommended
More Related Content
What's hot
What's hot (20)
Viewers also liked
Similar to Enzimas y cinética enzimas
Similar to Enzimas y cinética enzimas (20)
More from jlquinonesrivera
More from jlquinonesrivera (13)
Recently uploaded
Recently uploaded (20)
Enzimas y cinética enzimas
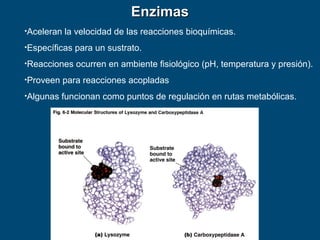
- 1. •Aceleran la velocidad de las reacciones bioquímicas. •Específicas para un sustrato. •Reacciones ocurren en ambiente fisiológico (pH, temperatura y presión). •Proveen para reacciones acopladas •Algunas funcionan como puntos de regulación en rutas metabólicas. EnzimasEnzimas
- 2. Fig. 7-10, p. 162 Activation energy (EA) without enzyme Activation energy (EA) with enzyme Energy of reactants Change in free energy (ΔG) Freeenergy(G) Energy of products Progress of reaction EnzymesEnzymes
- 6. E + S ES E + P
- 7. -asa o “-ase” S Δk1 k-1 P
- 9. Transferases
- 10. En citosol
- 11. Hydrolases
- 14. Isomerases
- 15. Ligases
- 17. Lysyl oxidase is an extracellular copper enzyme that catalyzes formation of aldehydes from lysine residues in collagen and elastin precursors
- 19. Zn++ , Fe+++ , Cu++ Tóxicos- Cd++ , Hg++ por Zn++
- 20. The list of enzymes which use zinc as a cofactor are : 1. glutamate dehydrogenase 2. alcohol dehydrogenase 3. lactate dehydrogenase 4. carbonic anhydrase 5. alkaline phosphatase 6. DNA polymerase 7. RNA polymerase 8. delta-ALA dehydratase 9. superoxide dismutase 10. pancreatic carboxypeptidase
- 22. Cofactor Vitamin Additional component Chemical group(s) transferred Distribution Thiamine pyrophosphate [24] Thiamine (B1) None 2-carbon groups, α cleavage Bacteria, archaea and eukaryotes NAD+ and NADP+ [25] Niacin (B3) ADP Electrons Bacteria, archaea and eukaryotes Pyridoxal phosphate [26] Pyridoxine (B6) None Amino and carboxyl groups Bacteria, archaea and eukaryotes Lipoamide [3] Lipoic acid None electrons, acyl groups Bacteria, archaea and eukaryotes Methylcobalamin [27] Vitamin B12 Methyl group acyl groups Bacteria, archaea and eukaryotes Cobalamine [3] Cobalamine (B12) None hydrogen, alkyl groups Bacteria, archaea and eukaryotes Biotin [28] Biotin (H) None CO2 Bacteria, archaea and eukaryotes Coenzyme A [29] Pantothenic acid (B5) ADP Acetyl group and other acyl groups Bacteria, archaea and eukaryotes Tetrahydrofolic acid [30] Folic acid (B9) Glutamate residues Methyl, formyl, methylene and formimino groups Bacteria, archaea and eukaryotes Menaquinone [31] Vitamin K None Carbonyl group and electrons Bacteria, archaea and eukaryotes Ascorbic acid [32] Vitamin C None Electrons Bacteria, archaea and eukaryotes Flavin mononucleotide [33] Riboflavin (B2) None Electrons Bacteria, archaea and eukaryotes Flavin adenine dinucleotide [33] Riboflavin (B2) None Electrons Bacteria, archaea and eukaryotes Coenzyme F420 [34] Riboflavin (B2) Amino acids Electrons Methanogens and some bacteria
- 23. Enzymes are used in an increasing number of application areas including: a) detergents, b) food processing, c) brewing, d) household products, e) manufacture of pharmaceuticals molecules, f) environmental and clinical assay kits, as labels in immunological ELISA tests and biosensors.
- 24. 1,6-Dihydro nicotinamide adenine dinucleotide inhibits both H-type lactic dehydrogenase and M-type lactic dehydrogenase which are isoenzymes of lactic dehydrogenase, but the degree of inhibition thereof against H-type considerably differs from that against M-type. A ratio of H-type lactic dehydrogenase to M-type lactic dehydrogenase in serum can be measured by utilizing the difference of inhibition degree. Therefore we can diagnose the organ with trouble.
- 25. S P V = P/t V = k[S] k= V/[S] k
- 26. *En solución saturada de sustrato Vmax = Kcat x [E]total Kcat = Vmax / [E]total [E]total= Vmax / Kcat E + S ES E + P k1 k-1 k2 Cinética de las Enzimas K = V/[E]
- 27. *En solución saturada de sustrato Vmax = Kcat x [E]total Kcat = Vmax / [E]total [E]total= Vmax / Kcat
- 28. Kcat = moles de S convertidos a P por segundo por mol de enzima (en solución saturada) En solución saturada de sustrato Kcat = Vmax / [E]total
- 29. En solución saturada de sustrato Vmax = Kcat x [E]total Kcat = Vmax / [E]total [E]total= Vmax / Kcat *En concentración constante de la enzima y no saturada de sustrato
- 30. Y= ax b+x b = a/2 k2 k-1 k1 E + S ES E + P Km = k-1/k1 :. Km mayor = menos afinidad Variaciones con las isoenzymas Michaelis–Menten equation
- 34. Gen5 Data Analysis Software (BioTek Instruments)
- 36. Kcat = Vmax / [E]total [E]total= Vmax / Kcat
- 37. InhibitionInhibition • Reversible inhibitionReversible inhibition • competitivecompetitive (inhibitor competes with substrate(inhibitor competes with substrate for active site)for active site) • noncompetitivenoncompetitive (inhibitor binds at a different(inhibitor binds at a different site)site) • Irreversible inhibitionIrreversible inhibition • inhibitor combines with enzyme andinhibitor combines with enzyme and permanently inactivates itpermanently inactivates it
- 47. Gas nervioso inhibidor de aceticolinesterasa Insecticidas con inhibidor de aceticolinesterasa Inhibidores de aceticolinesterasa para el Alzheimer
- 48. •Regulación de las enzimas en metabolismo •concentración de la enzimas •concentración del sustrato •modulaciones alostéricas •modificaciones covalentes •cambios en pH •temperatura
- 56. Feedback InhibitionFeedback Inhibition • End productEnd product inhibitsinhibits earlierearlier reaction inreaction in metabolicmetabolic pathwaypathway
- 59. Zimógenos
- 60. Fig. 7-12b, p. 164 Trypsin Pepsin pH (b) Enzyme activity is very sensitive to pH. Pepsin is a protein-digesting enzyme in the very acidic stomach juice. Trypsin, secreted by the pancreas into the slightly basic small intestine, digests polypeptides. Rateofreaction
- 62. Fig. 7-12a, p. 164 Most human enzymes Enzymes of heat-tolerant bacteria Rateofreaction Temperature (°C) (a) Generalized curves for the effect of temperature on enzyme activity.
- 80. Fig. 7-17a, p. 167 Substrate Inhibitor Enzyme (a) Competitive inhibition. The inhibitor competes with the normal substrate for the active site of the enzyme. A competitive inhibitor occupies the active site only temporarily. Inhibitor binds to active site Substrate
- 81. Fig. 7-17b, p. 167 Substrates Active site Inhibitor (b) Noncompetitive inhibition. The inhibitor binds with the enzyme at a site other than the active site, altering the shape of the enzyme and thereby inactivating it. Active site not suitable for reception of substratesEnzyme
- 83. Animation: Chemical EquilibriumAnimation: Chemical Equilibrium CLICK TO PLAY
- 84. Exergonic ReactionsExergonic Reactions • have a negativehave a negative ΔΔGG valuevalue • free energy decreasesfree energy decreases • are spontaneousare spontaneous • release free energy that can perform workrelease free energy that can perform work
- 85. Endergonic ReactionsEndergonic Reactions • have a positivehave a positive ΔΔGG valuevalue • free energy increasesfree energy increases • areare notnot spontaneousspontaneous
- 86. Fig. 7-3, p. 156
- 87. Fig. 7-3a, p. 156 Reactants Free energy decreases Freeenergy(G) Products Course of reaction (a) In an exergonic reaction, there is a net loss of free energy. The products have less free energy than was present in the reactants, and the reaction proceeds spontaneously.
- 88. Fig. 7-3b, p. 156 Reactants Free energy increases Freeenergy(G) Products Course of reaction (b) In an endergonic reaction, there is a net gain of free energy. The products have more free energy than was present in the reactants.
- 89. Coupled ReactionCoupled Reaction • Input of free energy required to drive anInput of free energy required to drive an endergonic reactionendergonic reaction is supplied by anis supplied by an exergonic reactionexergonic reaction A→A→BB ΔΔG = +20.9 kJ/molG = +20.9 kJ/mol C→C→DD ΔΔG = -33.5 kJ/molG = -33.5 kJ/mol OverallOverall ΔΔG = -12.6 kJ/molG = -12.6 kJ/mol
- 90. Learning Objective 9Learning Objective 9 • How can anHow can an enzymeenzyme lower the requiredlower the required energy of activationenergy of activation for a reaction?for a reaction?
- 91. ATP and ADPATP and ADP
- 92. Catabolism and AnabolismCatabolism and Anabolism • CatabolismCatabolism • degradation of large complex molecules intodegradation of large complex molecules into smaller, simpler moleculessmaller, simpler molecules • exergonicexergonic • AnabolismAnabolism • synthesis of complex molecules from simplersynthesis of complex molecules from simpler moleculesmolecules • endergonicendergonic
- 93. ATP Links Exergonic andATP Links Exergonic and Endergonic ReactionsEndergonic Reactions
- 94. NAD+ and NADHNAD+ and NADH
- 95. Fig. 7-7, p. 160 NAD+ (oxidized) NADH (reduced) Nicotinamide Ribose Phosphate Adenine Phosphate Ribose
Editor's Notes
- Figure 7.10: Activation energy and enzymes. An enzyme speeds up a reaction by lowering its activation energy (EA). In the presence of an enzyme, reacting molecules require less kinetic energy to complete a reaction.
- Figure 5.4 Plots of initial velocity 0 versus substrate concentration ([S]) for an enzyme-catalyzed reaction. (a) Each experimental point is obtained from a separate progress curve using the same concentration of enzyme. The shape of the curve is hyperbolic. At low substrate concentrations, the curve approximates a straight line that rises steeply. In this region of the curve, the reaction is highly dependent on the concentration of substrate. At high concentrations of substrate, the enzyme is almost saturated, and the initial rate of the reaction does not change much when substrate concentration is further increased. (b) The concentration of substrate that corresponds to half-maximum velocity is called the Michaelis constant (Km). The enzyme is half-saturated when S = Km.
- Figure 6.15 Inhibition of adenosine deaminase by a transition-state analog. (a) In the deamination of adenosine, a proton is added to N-1 and a hydroxide ion is added to C-6 to form an unstable covalent hydrate, which decomposes to produce inosine and ammonia. (b) The inhibitor purine ribonucleoside also rapidly forms a covalent hydrate, 6-hydroxy-1,6-dihydropurine ribonucleoside. This covalent hydrate is a transition-state analog that binds more than a million times more avidly than another competitive inhibitor, 1,6-dihydropurine ribonucleoside (c), which differs from the transition-state analog only by the absence of the 6-hydroxyl group.
- Figure 5.8 Diagrams of reversible enzyme inhibition. In this scheme, catalytically competent enzymes are green and inactive enzymes are red. (a) Classical competitive inhibition. S and I bind to the active site in a mutually exclusive manner. (b) Nonclassical competitive inhibition. The binding of S at the active site prevents the binding of I at a separate site, and vice versa. (c) Uncompetitive inhibition. I binds only to the ES complex. The enzyme becomes inactive when I binds. (d) Noncompetitive inhibition. I can bind to either E or ES. The enzyme becomes inactive when I binds. Although the EI complex can still bind S, no product is formed.
- Figure 5.9 Competitive inhibition. (a) Kinetic scheme illustrating the binding of I to E. Note that this is an expansion of Equation 5.11 that includes formation of the EI complex. (b) Double-reciprocal plot. In competitive inhibition, Vmax remains unchanged and Km increases. The black line labeled “Control” is the result in the absence of inhibitor. The red lines are the results in the presence of inhibitor, with the arrow showing the direction of increasing [I].
- Figure 5.8 Diagrams of reversible enzyme inhibition. In this scheme, catalytically competent enzymes are green and inactive enzymes are red. (a) Classical competitive inhibition. S and I bind to the active site in a mutually exclusive manner. (b) Nonclassical competitive inhibition. The binding of S at the active site prevents the binding of I at a separate site, and vice versa. (c) Uncompetitive inhibition. I binds only to the ES complex. The enzyme becomes inactive when I binds. (d) Noncompetitive inhibition. I can bind to either E or ES. The enzyme becomes inactive when I binds. Although the EI complex can still bind S, no product is formed.
- Figure 5.11 Uncompetitive inhibition. (a) Kinetic scheme illustrating the binding of I to ES. (b) Double-reciprocal plot. In uncompetitive inhibition, both Vmax and Km decrease (i.e., the absolute values of both 1/Vmax and 1/Km obtained from the y and x intercepts, respectively, increase). The ratio Km/ Vmax, the slope of the lines, remains unchanged.
- Figure 5.8 Diagrams of reversible enzyme inhibition. In this scheme, catalytically competent enzymes are green and inactive enzymes are red. (a) Classical competitive inhibition. S and I bind to the active site in a mutually exclusive manner. (b) Nonclassical competitive inhibition. The binding of S at the active site prevents the binding of I at a separate site, and vice versa. (c) Uncompetitive inhibition. I binds only to the ES complex. The enzyme becomes inactive when I binds. (d) Noncompetitive inhibition. I can bind to either E or ES. The enzyme becomes inactive when I binds. Although the EI complex can still bind S, no product is formed.
- Figure 5.12 Classic noncompetitive inhibition. (a) Kinetic scheme illustrating the binding of I to E or ES. (b) Double-reciprocal plot. Vmax decreases, but Km remains the same.
- Figure 5.20 The R conformation of phosphofructokinase-1 from E. coli. The enzyme is a tetramer of identical chains. (a) Single subunit, shown as a ribbon. The products, fructose 1,6-bisphosphate (yellow) and ADP (green), are bound in the active site. The allosteric activator ADP (red) is bound in the regulatory site. (b) Tetramer. Two are blue, and two are purple. The products, fructose 1,6-bisphosphate (yellow) and ADP (green), are bound in the four active sites. The allosteric activator ADP (red) is bound in the four regulatory sites, at the interface of the subunits. [PDB 1PFK].
- Figure 5.23 Conformational changes during oxygen binding to hemoglobin. The tertiary structure of a single chain changes as oxygen is bound. The quaternary structure of hemoglobin changes from the T state to the R state only when at least one subunit on each dimer is oxygenated. Only four of the eight possible partially oxygenated species are shown (e.g., oxygen could bind initially to either an or a chain, and so on). [Adapted from Ackers, G. K., Doyle, M. L., Myers, D., and Daugherty, M. A. (1992). Molecular code for cooperativity in hemoglobin. Science 255:54–63.]
- Figure 5.22 Two models for cooperativity of binding of substrate (S) to a tetrameric protein. (a) In the simplified concerted model, all subunits are either in the R state or the T state, and S binds only to the R state. (b) In the sequential model, binding of S to a subunit converts only that subunit to the R conformation. Neighboring subunits might remain in the T state or might assume conformations between T and R.
- Figure 5.17 Plot of initial velocity as a function of substrate concentration for an allosteric enzyme exhibiting cooperative binding of substrate.
- Figure 5.24 Regulation of mammalian pyruvate dehydrogenase. Pyruvate dehydrogenase, an interconvertible enzyme, is inactivated by phosphorylation catalyzed by pyruvate dehydrogenase kinase. It is reactivated by hydrolysis of its phosphoserine residue, catalyzed by an allosteric hydrolase called pyruvate dehydrogenase phosphatase.
- Figure 7.12: The effects of temperature and pH on enzyme activity. Substrate and enzyme concentrations are held constant in the reactions illustrated.
- Figure 7.12: The effects of temperature and pH on enzyme activity. Substrate and enzyme concentrations are held constant in the reactions illustrated.
- Figure 6.7 General acid–base catalysis mechanism proposed for the reaction catalyzed by triose phosphate isomerase.
- Figure 6.27 Mechanism of chymotrypsin-catalyzed cleavage of a peptide bond.
- Figure 6.27 Mechanism of chymotrypsin-catalyzed cleavage of a peptide bond.
- Figure 6.27 Mechanism of chymotrypsin-catalyzed cleavage of a peptide bond.
- Figure 6.27 Mechanism of chymotrypsin-catalyzed cleavage of a peptide bond.
- a) Chymotrypsin b) trypsin c) elastase
- Figure 6.17 Structure of a four-residue portion of a bacterial cell-wall polysaccharide. Lysozyme catalyzes hydrolytic cleavage of the glycosidic bond between C-1 of MurNAc and the oxygen atom involved in the glycosidic bond.
- Figure 6.18 Lysozyme from chicken with a trisaccharide molecule (pink). The ligand is bound in sites A, B, and C. Three more monosaccharide residues can fit into a model of this active site, but the sugar residue in site D must be distorted. [PDB 1HEW].
- Figure 6.20 Mechanism of lysozyme. R1 represents the lactyl group, and R2 represents the N-acetyl group of MurNAc.
- Figure 6.20 Mechanism of lysozyme. R1 represents the lactyl group, and R2 represents the N-acetyl group of MurNAc.
- Figure 6.20 Mechanism of lysozyme. R1 represents the lactyl group, and R2 represents the N-acetyl group of MurNAc.
- Figure 7.17: Competitive and noncompetitive inhibition.
- Figure 7.17: Competitive and noncompetitive inhibition.
- Figure 7.3: Exergonic and endergonic reactions.
- Figure 7.3: Exergonic and endergonic reactions.
- Figure 7.3: Exergonic and endergonic reactions.
- Figure 7.7: NAD+ and NADH. NAD+ consists of two nucleotides, one with adenine and one with nicotinamide, that are joined at their phosphate groups. The oxidized form of the nicotinamide ring in NAD+ (left) becomes the reduced form in NADH (right) by the transfer of 2 electrons and 1 proton from another organic compound (XH2), which becomes oxidized (to X) in the process.