Pedestrian LOS Microsimulation VISSIM
•
1 like•102 views

https://irjet.net/archives/V4/i7/IRJET-V4I739.pdf

Recommended
Recommended
More Related Content
Similar to Pedestrian LOS Microsimulation VISSIM
Similar to Pedestrian LOS Microsimulation VISSIM (20)
More from IRJET Journal
More from IRJET Journal (20)
Recently uploaded
Recently uploaded (20)
Pedestrian LOS Microsimulation VISSIM
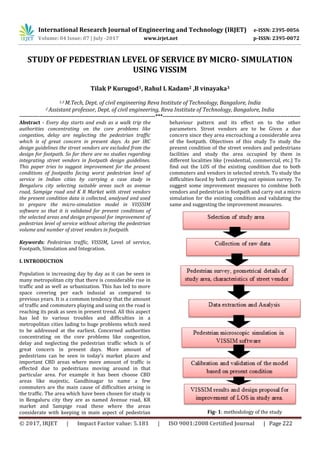
- 1. International Research Journal of Engineering and Technology (IRJET) e-ISSN: 2395-0056 Volume: 04 Issue: 07 | July -2017 www.irjet.net p-ISSN: 2395-0072 © 2017, IRJET | Impact Factor value: 5.181 | ISO 9001:2008 Certified Journal | Page 222 STUDY OF PEDESTRIAN LEVEL OF SERVICE BY MICRO- SIMULATION USING VISSIM Tilak P Kurugod1, Rahul L Kadam2 ,B vinayaka3 1,3 M.Tech, Dept. of civil engineering Reva Institute of Technology, Bangalore, India 2 Assistant professor, Dept. of civil engineering, Reva Institute of Technology, Bangalore, India ---------------------------------------------------------------------------***---------------------------------------------------------------------------- Abstract - Every day starts and ends as a walk trip the authorities concentrating on the core problems like congestion, delay are neglecting the pedestrian traffic which is of great concern in present days. As per IRC design guidelines the street vendors are excluded from the design for footpath. So far there are no studies regarding integrating street vendors in footpath design guidelines. This paper tries to suggest improvement for the present conditions of footpaths facing worst pedestrian level of service in Indian cities by carrying a case study in Bengaluru city selecting suitable areas such as avenue road, Sampige road and K R Market with street vendors the present condition data is collected, analysed and used to prepare the micro-simulation model in VISSSIM software so that it is validated for present conditions of the selected areas and design proposal for improvement of pedestrian level of service without altering the pedestrian volume and number of street vendors in footpath. Keywords: Pedestrian traffic, VISSIM, Level of service, Footpath, Simulation and Integration. I. INTRODUCTION Population is increasing day by day as it can be seen in many metropolitan city that there is considerable rise in traffic and as well as urbanization. This has led to more space covering per each indusial as compared to previous years. It is a common tendency that the amount of traffic and commuters playing and using on the road is reaching its peak as seen in present trend. All this aspect has led to various troubles and difficulties in a metropolitan cities lading to huge problems which need to be addressed at the earliest. Concerned authorities concentrating on the core problems like congestion, delay and neglecting the pedestrian traffic which is of great concern in present days. More amount of pedestrians can be seen in today’s market places and important CBD areas where more amount of traffic is effected due to pedestrians moving around in that particular area. For example it has been choose CBD areas like majestic, Gandhinagar to name a few commuters are the main cause of difficulties arising in the traffic. The area which have been chosen for study is in Bengaluru city they are as named Avenue road, KR market and Sampige road these where the areas considerate with keeping in main aspect of pedestrian behaviour pattern and its effect on to the other parameters. Street vendors are to be Given a due concern since they area encroaching a considerable area of the footpath. Objectives of this study To study the present condition of the street vendors and pedestrians facilities and study the area occupied by them in different localities like (residential, commercial, etc.) To find out the LOS of the existing condition due to both commuters and vendors in selected stretch. To study the difficulties faced by both carrying out opinion survey. To suggest some improvement measures to combine both vendors and pedestrian in footpath and carry out a micro simulation for the existing condition and validating the same and suggesting the improvement measures. Fig- 1: methodology of the study
- 2. International Research Journal of Engineering and Technology (IRJET) e-ISSN: 2395-0056 Volume: 04 Issue: 07 | July -2017 www.irjet.net p-ISSN: 2395-0072 © 2017, IRJET | Impact Factor value: 5.181 | ISO 9001:2008 Certified Journal | Page 223 2. DATA COLLECTION To prepare any micro-simulation model in VISSIM software it is very necessary to collect the detail data related to the study area for this study data collection is done in three different stages 1. Collection of geometrical details 2. Pedestrian survey 3. Questionnaire survey 2.1 Collection of Geometrical details The geometrical measurements of study area are measured manually by visiting to the location using tape. Details like width of the carriageway, width of the footpath, surface condition, length of the study stretch, width on carriageway pedestrian opened up to use, number of street vendors are noted. Table-1: Geometrical details of different locations 2.2. Pedestrian survey Both videography survey and manual pedestrian volume count is carried out in the study locations at peak hours. It was very difficult to carry out videography survey because owners of buildings surrounding the study area were not willing to give permission to place camera on their buildings not getting a correct location due to obstacles but anyhow 1.5 hours of video data is collected at Sampige road and 3 hours at avenue road. Manual pedestrian volume count was carried morning and evening peak hours. Before carrying videography survey the 15m area trap longitudinally is marked so that area of trap is used further to calculate speed and density Fig-. 2: Trap used to find out parameters Initially the survey was carried out by mounting the camera on a higher location to cover the maximum area of study stretch. Pedestrians and number of vendors where found out manually in the field. Video was played on the large screen to obtain data like speed, density, flow rate and dwell time. Speed movement of pedestrians was found out by tracing a rectangular box on to certain stretch in an application named kinemaster with a rectangular box of width 15 m in longitudinally and width of the box is similar to width of footpath or area covered by pedestrians. 2.3. Questionnaire survey In order to know the real difficulties faced by the both the persons playing on this road stretch a need of questioner survey was carried out to know the exact cause or what was there suggestion for the same . Keeping all the parameters in mind a set of questions were prepared to know the opinion of the same. 3. DATA EXTRACTION Initially the survey was carried out by mounting the camera on a higher location to cover the maximum area of study stretch. Pedestrians and number of vendors where found out manually in the field. Video was played on the large screen to obtain data like speed, density, flow rate and dwell time. Speed movement of pedestrians was found out by tracing a rectangular box on to certain stretch in an application named kinemaster with a rectangular box of width 15 m in longitudinally and width of the box is similar to width of footpath or area covered by pedestrians Avenue road Sampige road K R market Width of the footpath (m) 2.13 4 2 Length of the study stretch (m) 275 305 270 Width of the roadway (m) 11.16 ( one-way ) 10.18 ( one-way ) 7.6 ( one- way ) Width on carriageway used by pedestrian (m) 1.5 0.5 2 Number of vendors on footpath across both side of the road 18 15 27
- 3. International Research Journal of Engineering and Technology (IRJET) e-ISSN: 2395-0056 Volume: 04 Issue: 07 | July -2017 www.irjet.net p-ISSN: 2395-0072 © 2017, IRJET | Impact Factor value: 5.181 | ISO 9001:2008 Certified Journal | Page 224 3.1. Determination of speed It is very essential to find out the speed of the pedestrians playing on that particular area since it is key parameter to find out the certain LOS of that selected stretch. Steps involved are explained below A box is traced in the recorded video by using it in the application as required Rectangular box since it is drawn the random person is selected for the entry of starting of box and time is noted for the same to cross the desired distance Based on the time required to cross the selected stretch distance travelled to the time taken gives the speed of the required person. It is carried out for a stated duration period of 1 hour to obtain 10 number of samples required Values are noted down for different junctions and used for further calculation of LOS Fig -3: Noting Pedestrian Entry Time Fig-4: Noting Pedestrian Exit Time 3.2. Determination of density: Density can be defined as number of pedestrians occupying per square meter of a particular area steps involved in calculation are The required tape is played on large screen once the selected person enters the traced area and is in the middle of the box then it is paused to calculate number of persons in to obtain density Total no pedestrians in the selected box to the area of the trap gives the relevant density Same is carried out for 10 number of sample both during peak and off peak hours and it is utilised based on the relevant requirement. Pedestrian space = 1 / density m2 / pedestrian Fig-5: Number of pedestrian to find out Density 3.3. Determination of flow rate Flow rate tends to change throughout the day it does not remain constant or same since during peak hour more number of people tends to be present thus leading to higher flow rate whereas during off peak hours it is relatively less. Pedestrian flow rate is number of people required time to travel a unit length or unit area same is used for 15 minutes or more intervals. Collection of same parameter is described below Number of people crossing for every certain interval of time say 15 minutes interval is noted down in prescribed format Highest volume observed throughout the day is selected for the calculation of the flow rate and it is divided by the width of footpath used by pedestrians for obtaining flow rate per metre or required units can be extracted.
- 4. International Research Journal of Engineering and Technology (IRJET) e-ISSN: 2395-0056 Volume: 04 Issue: 07 | July -2017 www.irjet.net p-ISSN: 2395-0072 © 2017, IRJET | Impact Factor value: 5.181 | ISO 9001:2008 Certified Journal | Page 225 3.4. Determination of pedestrian dwell time This parameter is an important aspect since maximum number of people to spend little time with the adjacent vendors on the street to purchase certain items time spent for which is called as dwell time . Dwell time may not be as considerably low because as observed in the field it was nearly 10 seconds minimum - 30 minutes maximum spent by certain commuters based on type of vendor it does vary and based on requirement. 3.5. Analysis of real time data It can be seen that from the (Table no 2) different values of pertaining to selected junction is obtained during peak hours both during morning and evening 9.30-11.30 am and 4.30-6.30 pm data was extracted for the further determination of parameters like LOS which gives us a brief idea of present condition and same came be used for further improvement to overcome the same by suggesting some alternative. All the obtained values are taken by considering movement in both directions. It was a tedious work since video has to be played numerous times to obtain relevant data in this project. No Particular IRC guidelines are given hence HCM manual is used to determine the LOS for different section based on selected data. Table-2: values of different parameters obtained PARAMETE RS STUDY AREA Avenue Road Sampige road KR market Speed (m/s) 1.15 1.25 1.07 Density 0.52 0.53 0.52 Flow rate (ped/min/ m) 175/3.63 =48.20 215/4.5=47.7 200/3.5 =57.14 Dwell time(Min- Max) 10’’-20’ 30”-30’ 25”-20’ Pedestrian LOS D D E Table-3: table used to find out LOS from HCM manual The above (figure no 6) is referred form HCM 2000 manual to calculate the present pedestrian level of service of study. Even though all the parameters are not considered for calculating the LOS at least two parameters are matched due to the presence of obstacles and vendors according to the data obtained. Mainly concentrating on the flow rate so that flow rate is calculated pedestrian/minute/meter the maximum flow rate for peak 15 min is calculated and the LOS is decided. 3.6. Results of Questionnaires Survey A small part of questionnaires survey was carried out in this study to know the opinion of the pedestrians regarding street vendors based on their requirements. The format of questionnaires survey was prepared according to the study it includes total five questions in that 3 questions were asked to pedestrians, one question for vendors and one for both. The sample size was taken 150 including all three study area. The information obtained from the survey is plotted by using graphs. The results include all the three study areas pedestrian and vendor opinion according to the format set. Fig- 6: Percentage of vendors required Fig-7: Percentage of usefulness of vendors 88% 12% whether street vendors are required in this particular stretch YES NO 40% 56% 4% To what extent street vendors are useful very useful moderate not at all useful
- 5. International Research Journal of Engineering and Technology (IRJET) e-ISSN: 2395-0056 Volume: 04 Issue: 07 | July -2017 www.irjet.net p-ISSN: 2395-0072 © 2017, IRJET | Impact Factor value: 5.181 | ISO 9001:2008 Certified Journal | Page 226 Fig-8: Percentage of improvement Fig-9: Percentage of source of income of a family Fig-10: Percentage of alternate proposal by pedestrian choice Fig-11: Percentage of alternate proposal by vendor choice 4. PEDESTRIAN MICROSCOPIC SIMULATION IN VISSIM SOFTWARE 4.1. General VISSIM software is used in transportation system for microscopic traffic simulation which can be visualized in 3D including all modes of traffic such as motorized private transport, public transport, goods transport, pedestrian movement and bicycle travel. It is widely used for analysis by giving specified inputs to get required result. This software helps to know the present situation of the study area and also helps in providing different types of improvement methods for study area. Fig-12: Main Page of Vissim Software 80% 20% Do you feel relocation of street vendors will improve the present condition YES NO 98% 2% Is vending main sourse of income or is there any alternative bussiness only vending alternative bussiness 18% 75% 7% Choose the Best alternative proposal for improvement by pedestrians relocation to one particular area extra widening and arranging street vendors systematically 0% 100% 0% Choose the Best alternative proposal for improvement by vendors relocation to one particular area
- 6. International Research Journal of Engineering and Technology (IRJET) e-ISSN: 2395-0056 Volume: 04 Issue: 07 | July -2017 www.irjet.net p-ISSN: 2395-0072 © 2017, IRJET | Impact Factor value: 5.181 | ISO 9001:2008 Certified Journal | Page 227 Fig-13: Network Objects for Simulation 4.2. Generation of Pedestrian Microscopic Simulation Model To prepare pedestrian microscopic simulation model it is required to take number of variables. The different parameters which are used for simulation are measurements of study area, pedestrian volume, number of street vendors are included for generation of model. It is necessary to know the effect of street vendors on pedestrian flow and also the time spent by different pedestrian on different vendors which are depend on their personal behaviour and characteristics which affect the parameters like speed, flow, density. However there are no standards for such factors but anyhow by field observation the model is prepared for existing condition. Important network objects for simulation of pedestrian in Vissim are: 1. Areas 2. Obstacles 3. Ramp and stairs 4. Pedestrian inputs 5. Pedestrian routes 5. Pedestrian travel time Fig-14: steps for preparation of simulation model 4.3. Validation Results The results obtained from real time data analysis using HCM 2000 manual is validated to the results obtained by running simulation after preparation of simulation model so that the model matches the present condition of study area and further the model is used for improvement of the pedestrian LOS by following required design considerations. The results obtained from vissim that is the average travel time required by a pedestrian to travel to a required stretch of study area as prepared in model. The total stretch of study area is divided by average travel time obtained after simulation results the average travel speed of pedestrian in m/second is obtained and this travel speed result is taken to calculate pedestrian LOS referring the below table from HCM manual.
- 7. International Research Journal of Engineering and Technology (IRJET) e-ISSN: 2395-0056 Volume: 04 Issue: 07 | July -2017 www.irjet.net p-ISSN: 2395-0072 © 2017, IRJET | Impact Factor value: 5.181 | ISO 9001:2008 Certified Journal | Page 228 Table-4: Table used to find out Pedestrian LOS from HCM Manual 4.3.1. Avenue Road Travel speed in m/s is calculated as total length of stretch is divided by average travel time obtained after simulation 275/280 = 0.98 m/s which falls under category LOS ‘D’ by referring (figure no 6.1) since the LOS results obtained from manual calculation and results from vissim software of study stretch of avenue road is LOS ‘D’ hence the results are validated. Chart-1: Graph obtained for avenue road existing condition after simulation run 4.3.2. Sampige Road The travel speed m/s is obtained as 305/309 = 0.98 m/s this depicts the condition of LOS ‘D’ as mentioned in the above table. LOS results of calculated manual and results from vissim software of study stretch of Sampige is ‘D’ Chart-2: Graph obtained for Sampige road existing condition after simulation run 4.3.3. K R Market The travel speed m/s is obtained from calculation 270/346 = 0.78 m/s the value calculated indicates the LOS ‘E’. Since the LOS results obtained from manual calculation and results from vissim software of study stretch of K R market road is seen under the same condition hence the results are validated. Chart-3: Graph obtained for K R Market existing condition after simulation run. 5. DESIGN PROPOSAL FOR IMPROVEMENT OF LOS Improvement of pedestrian LOS is done by suggesting the different proposals without neglecting the vendors on footpath. In this project the improved LOS is gained by developing a another simulation model in vissim by
- 8. International Research Journal of Engineering and Technology (IRJET) e-ISSN: 2395-0056 Volume: 04 Issue: 07 | July -2017 www.irjet.net p-ISSN: 2395-0072 © 2017, IRJET | Impact Factor value: 5.181 | ISO 9001:2008 Certified Journal | Page 229 altering the existing condition of footpath such as widening of the footpath and arranging the vendors in proper manner without changing the speed and pedestrian volume. Since the traffic flow in all the three study stretch is in one particular direction (one-way) widening of footpath will not affect the traffic flow however in present condition the pedestrians are using the carriageway based on the field observation. The footpath is designed for widening and proper arrangements of vendors are done to attain the improvement in pedestrian LOS. 5.1 Sampige Road Extra 0.5m carriageway is used by pedestrian since the width of the carriageway is 11.3m (one-way) any how this width is covered by pedestrian widening of footpath will not affect the present traffic. Vissim result after simulation run travel speed = 305/300 = 1.101 m/s which takes LOS ‘C’. Fig-15: Systematic arrangement of street vendors for Sampige road Table-5: Details of street vendors for Sampige road Chart-4: Graph obtained for Sampige road after improvement Size of vendor stall (length X breadth) (m) Spacing of vendors @ (m) Number of vendors @ 2m spacing (4.5 - 5.5) X 1.25 41 From starting point - 45 2 30 2 12 1 34 2 19 2 13 from End point - 13.7 from Start point - 9 1 18.5 1 52 2 55 2 35 - 32 From end point -
- 9. International Research Journal of Engineering and Technology (IRJET) e-ISSN: 2395-0056 Volume: 04 Issue: 07 | July -2017 www.irjet.net p-ISSN: 2395-0072 © 2017, IRJET | Impact Factor value: 5.181 | ISO 9001:2008 Certified Journal | Page 230 Fig-16: size and spacing of vendors stall using Auto cadd 5.2 Avenue Road The existing footpath width of avenue road is 2.13m facing the worst condition of pedestrian LOS. Hence the extra carriageway used by pedestrian is 1.5m is included in the design proposal by preparing new improvement simulation model in vissim and without decreasing the number of vendors they are included in the design. After preparation of new improvement model the simulation results obtained the average travel speed = 275/243=1.13m/s which comes under LOS’C’ at least one level improvement is obtained. Fig-17: systematic arrangement of street vendors for avenue road Chart-5: Graph obtained for avenue road after improvement Table-6: Details of street vendors for avenue road Size of vendor stall (length X breadth) (m) Spacing of vendors @ (m) Number of street vendors (2 - 4) X 0.90 15 from start One at each total 18 in number 22 29 49 30 23 33 8 6.5 20 from End point 11 from start point 19 18 31 38 13 32 35 23 from end point
- 10. International Research Journal of Engineering and Technology (IRJET) e-ISSN: 2395-0056 Volume: 04 Issue: 07 | July -2017 www.irjet.net p-ISSN: 2395-0072 © 2017, IRJET | Impact Factor value: 5.181 | ISO 9001:2008 Certified Journal | Page 231 Fig-18:size and spacing of vendors stall using Auto cadd 5.3 K R Market The present width of carriageway of k r market is 7.6m in which 1m is used by the pedestrian movement so 1m widening of footpath on both side will not affect the traffic flow since the traffic flow in this location is one particular direction. Proper set up of vendors in improvement model results travel speed = 270/ 304 = 0.88 m/s which comes under LOS ‘D’ Fig-19: systematic arrangements of street vendors for K R Market Fig-20: Values generated for avenue K R Market after improvement
- 11. International Research Journal of Engineering and Technology (IRJET) e-ISSN: 2395-0056 Volume: 04 Issue: 07 | July -2017 www.irjet.net p-ISSN: 2395-0072 © 2017, IRJET | Impact Factor value: 5.181 | ISO 9001:2008 Certified Journal | Page 232 Chart-6: Graph obtained for K R Market after improvement Table- 7: Details of street vendors for K R Market Size of vendor stall (length X breadth) (m) Spacing of vendors @ (m) Number of street vendors (1.5 – 2.5) X 0.75 9.5 from start point One at each total 27 14.5 21 20 20 27 22 24 12.5 29 16 6 from end point 13 from start point 19.7 20.5 17.5 20.5 17.3 12 15 25 20 13 7.5 7.5 12.5 6.3 7.5 from end Fig-21: size and spacing of vendors stall using Auto cadd
- 12. International Research Journal of Engineering and Technology (IRJET) e-ISSN: 2395-0056 Volume: 04 Issue: 07 | July -2017 www.irjet.net p-ISSN: 2395-0072 © 2017, IRJET | Impact Factor value: 5.181 | ISO 9001:2008 Certified Journal | Page 233 Fig-22: 3D View during Simulation Run 6. CONCLUSIONS AND FUTURE SCOPE 6.1 Conclusion: It can be seen that after obtaining all the relevant data and analysing the same it can be drawn to certain conclusion as follows: It is seen in the above literature review that no much work is being carried out on this area in Bengaluru city Presence of street vendor in all the selected stretch have effect on the pedestrian movement and it has led to effect on LOS LOS obtained for existing condition in all three selected area where Same can be improved by arranging the street vendors in proper manner or relocating them from present location Micro simulation model was prepared for the same condition existing in the field and same was analysed to obtain LOS Validation of the results where compared with the value obtained in the field and validated for the same. Alternate proposal was made for present condition in the fields to improve the present scenario and it is evident from above values that LOS is improved from Same can be used in calculation of different junction and suggesting guidelines which can be used in different junction to improve the overall parameters of that particular junction. This study is required according to the questionnaires survey. 6.2 Future Scope: There are very few studies are carried out on a study of effect of street vendors for pedestrian level of service. Hence it is required to study and to provide improvement for footpath design guide lines. The same study can be carried for different states of India and IRC has to prepare generalize design guidelines for the design of footpath integrating street vendors for required areas. The more studies have to carry out using vitalization software like viswalk and compare the results and propose best design guidelines. REFERENCE [1]. SHARIT BHOWMIK AND DEBDULAL SAHA (2012), “Street Vending In Ten Cities in India” National Association of Street Vendors [2]. CECILIA FRIIS AND LINA SEVENSSON (2013), “Pedestrian Micro Simulation a Comparative Study On Vissim and Viswalk” [3]. ASHISH VERMA AND SHIRIN MARY ANTONY (2014), “Integration of Street Vendors in Footpath Design Guidelines for an Indian City” ISE Bengaluru [4]. Highway Capacity Manual 2000, TRB, National research council, Washington, D.C., 1999 [5] IRC, “Guidelines for pedestrian facilities-IRC: 103- 1983”, The Indian Roads Congress, New Delhi, 1983. [6] IRC, “Guidelines for pedestrian facilities-IRC: 103- 2012”, The Indian Roads Congress, New Delhi, 2012. [7] ARAVIND R, LAKSHMI S AND GUNASEKARANA K (2015), “A Study on Pedestrian Behaviour for Crosswalk” International Journal of Civil, Mechanical and Production Engineering Volume 1 [8]. Jaskiewicz,F.(2000), “Pedestrian Level of Service Based on Trip Quality” Transportation Research Board, Washington, D.C. [9]. Sharit Bhowmik and Debdulal Saha (2012), “Street Vending In Ten Cities in India” National Association of Street Vendors [10] CHHAYA BRAHMBHATTA, L.B.ZALA AND MUKTI ADVANI (2015), “Measurements of Flow Parameters a Case Study of Dakar Gujarat” IRJET [11] VISSIM 7, (2014), User Manual, PTV, Germany Advani, M. & Tiwari, G., (2006). “Bicycle - As a feeder mode for bus service.”, Cape Town
- 13. International Research Journal of Engineering and Technology (IRJET) e-ISSN: 2395-0056 Volume: 04 Issue: 07 | July -2017 www.irjet.net p-ISSN: 2395-0072 © 2017, IRJET | Impact Factor value: 5.181 | ISO 9001:2008 Certified Journal | Page 234 Mohan, D. & Tiwari, G., (2000). “Mobility, Environment and Saferty in Megacities: Dealing with a Complex Future.” IATSS Research, 24, (1) 39-46 Replogle, M., (1992). “Non-motorized vehicles in Asian cities, World Bank.” Asia Technical Department Series (162). Rites, (2007), “Comprehensive Traffic and Transportation Study for Bangalore City-2007.” UTTIPEC, (2010), “Street Design Guidelines.” Delhi Development Authority, Revision 1. BIOGRAPHIES Mr.Tilak .P.Kurugod has completed BE from Rural Engineering college and M.Tech from Reva college of Engineering, Bangalore. His area of interest is recent trends in transportation engineering