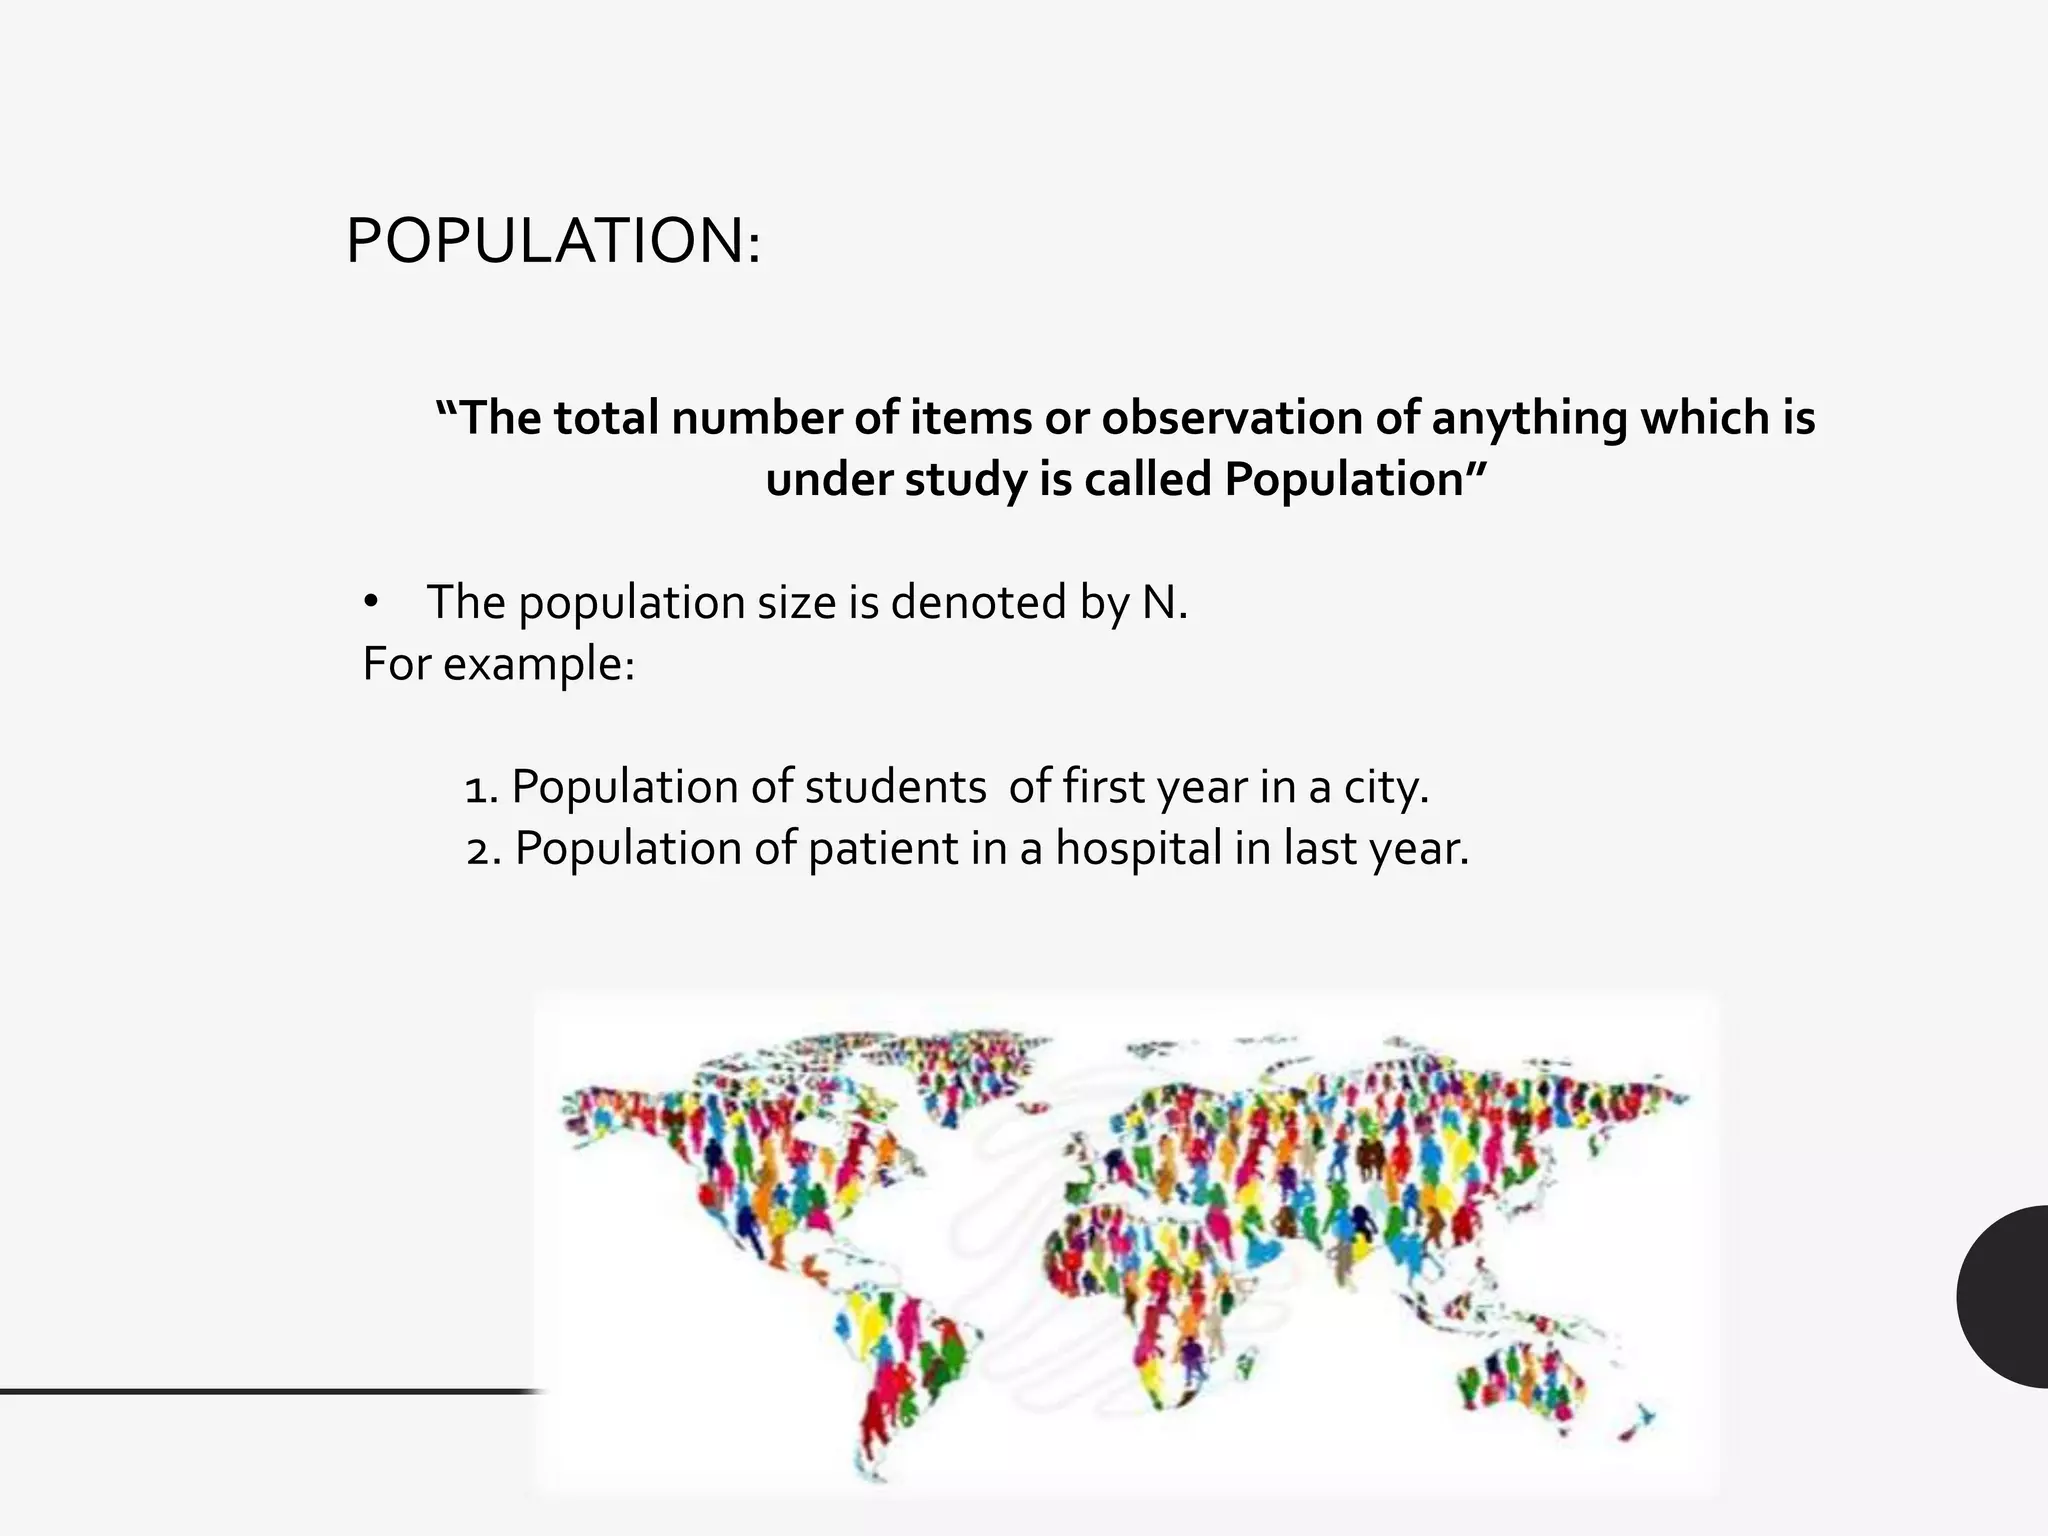
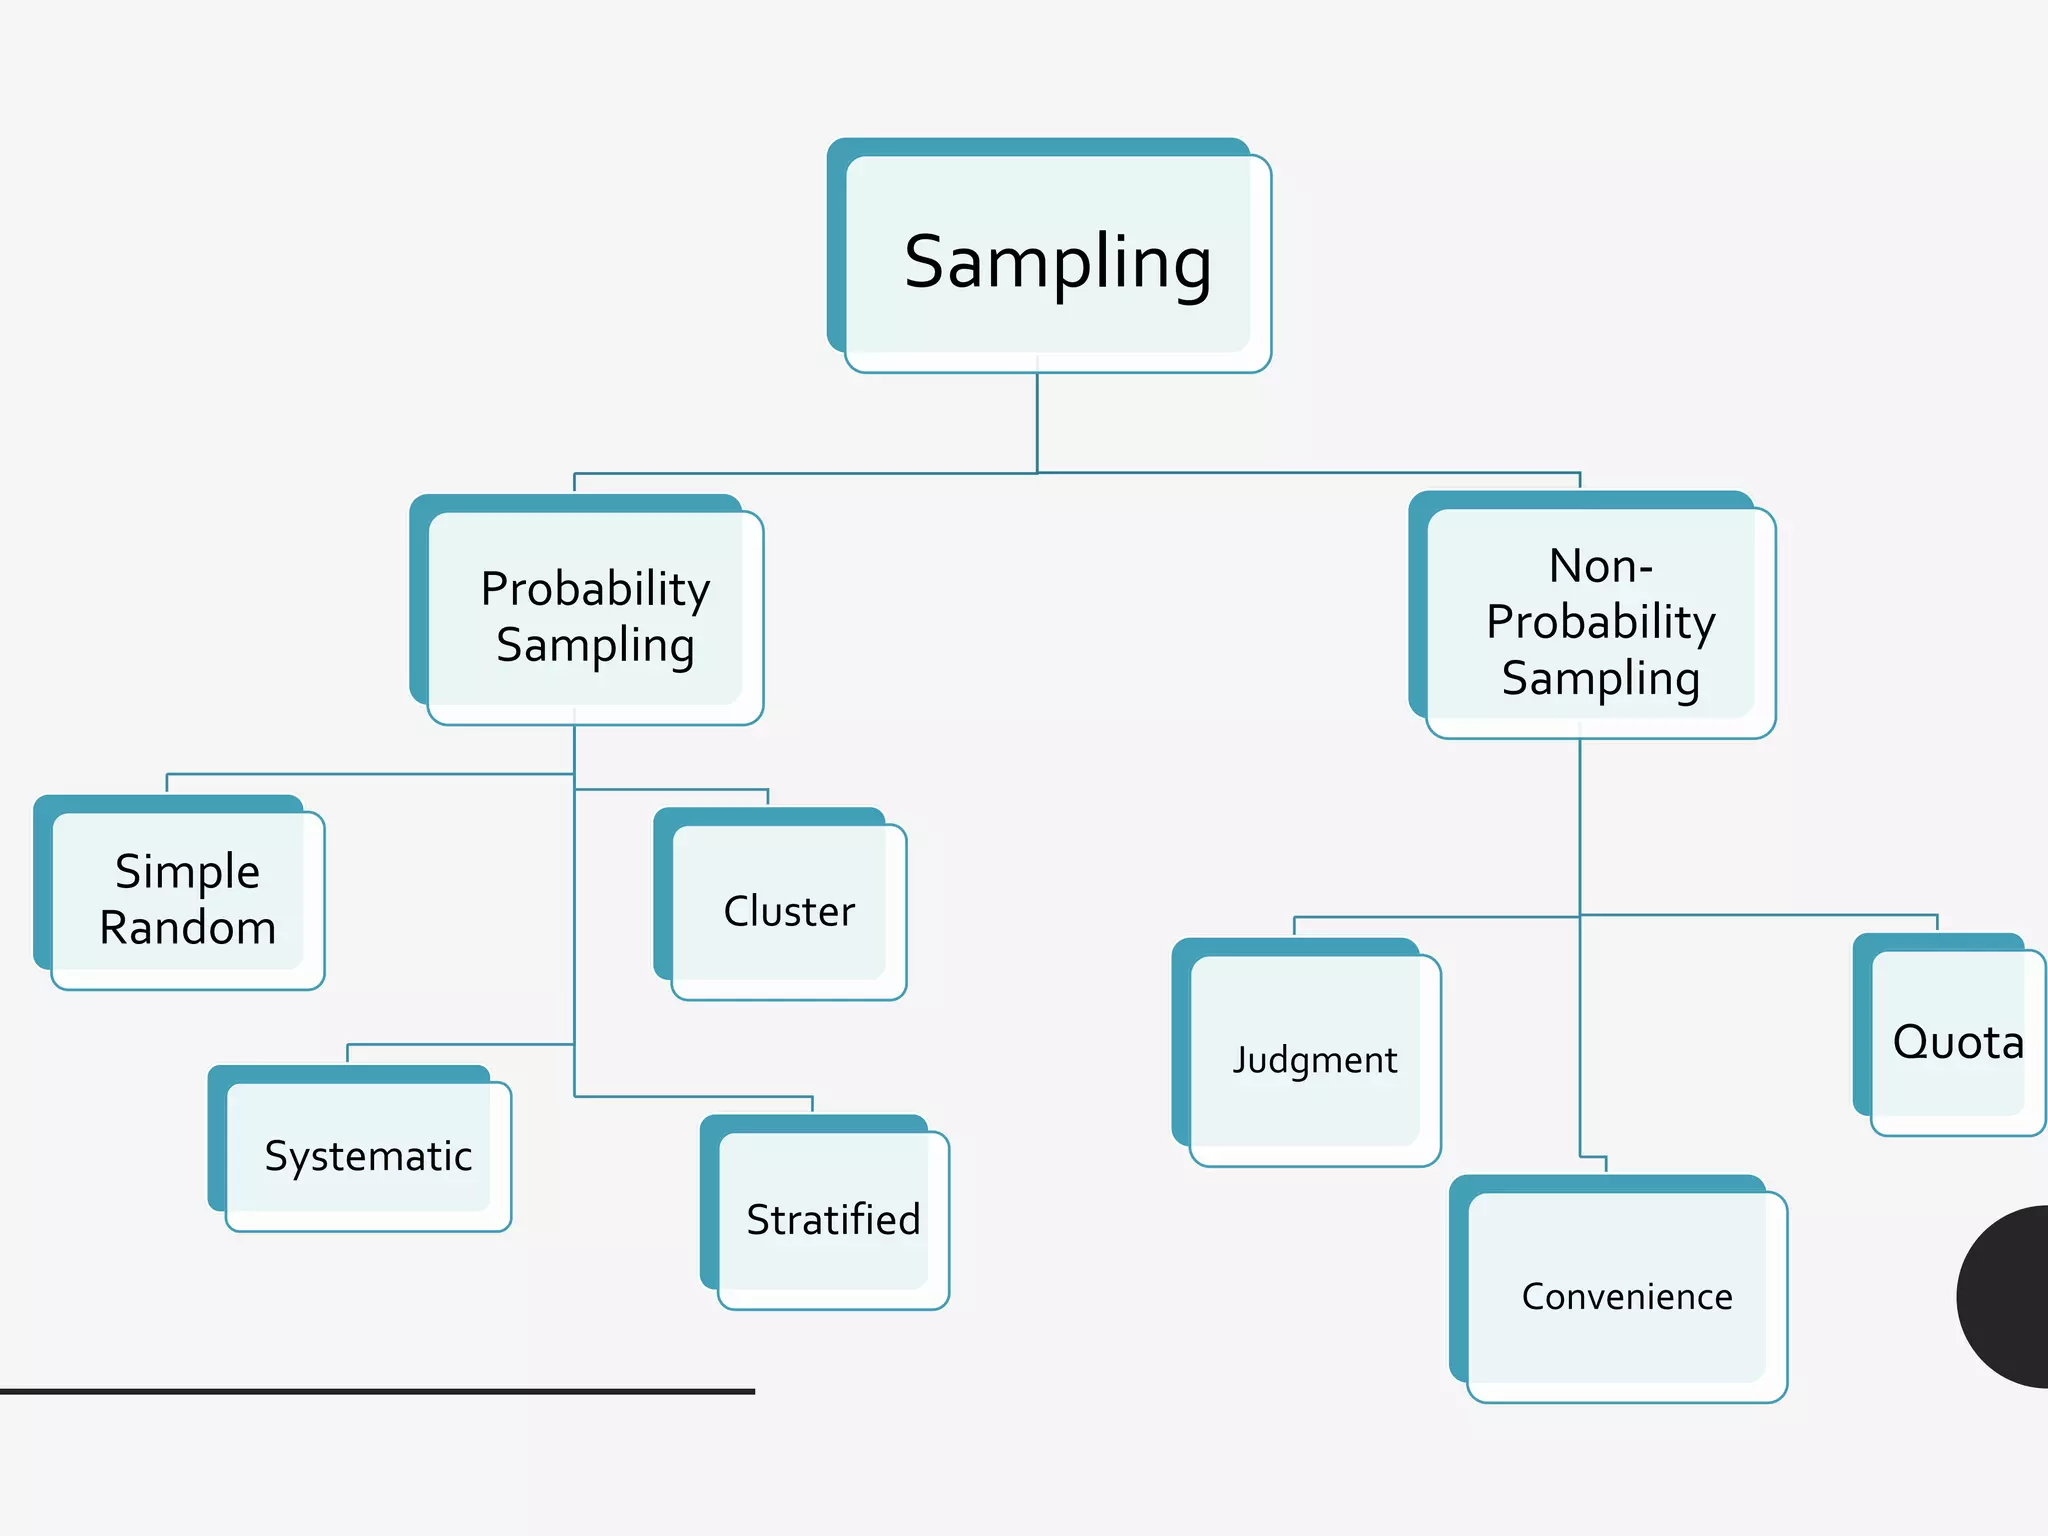
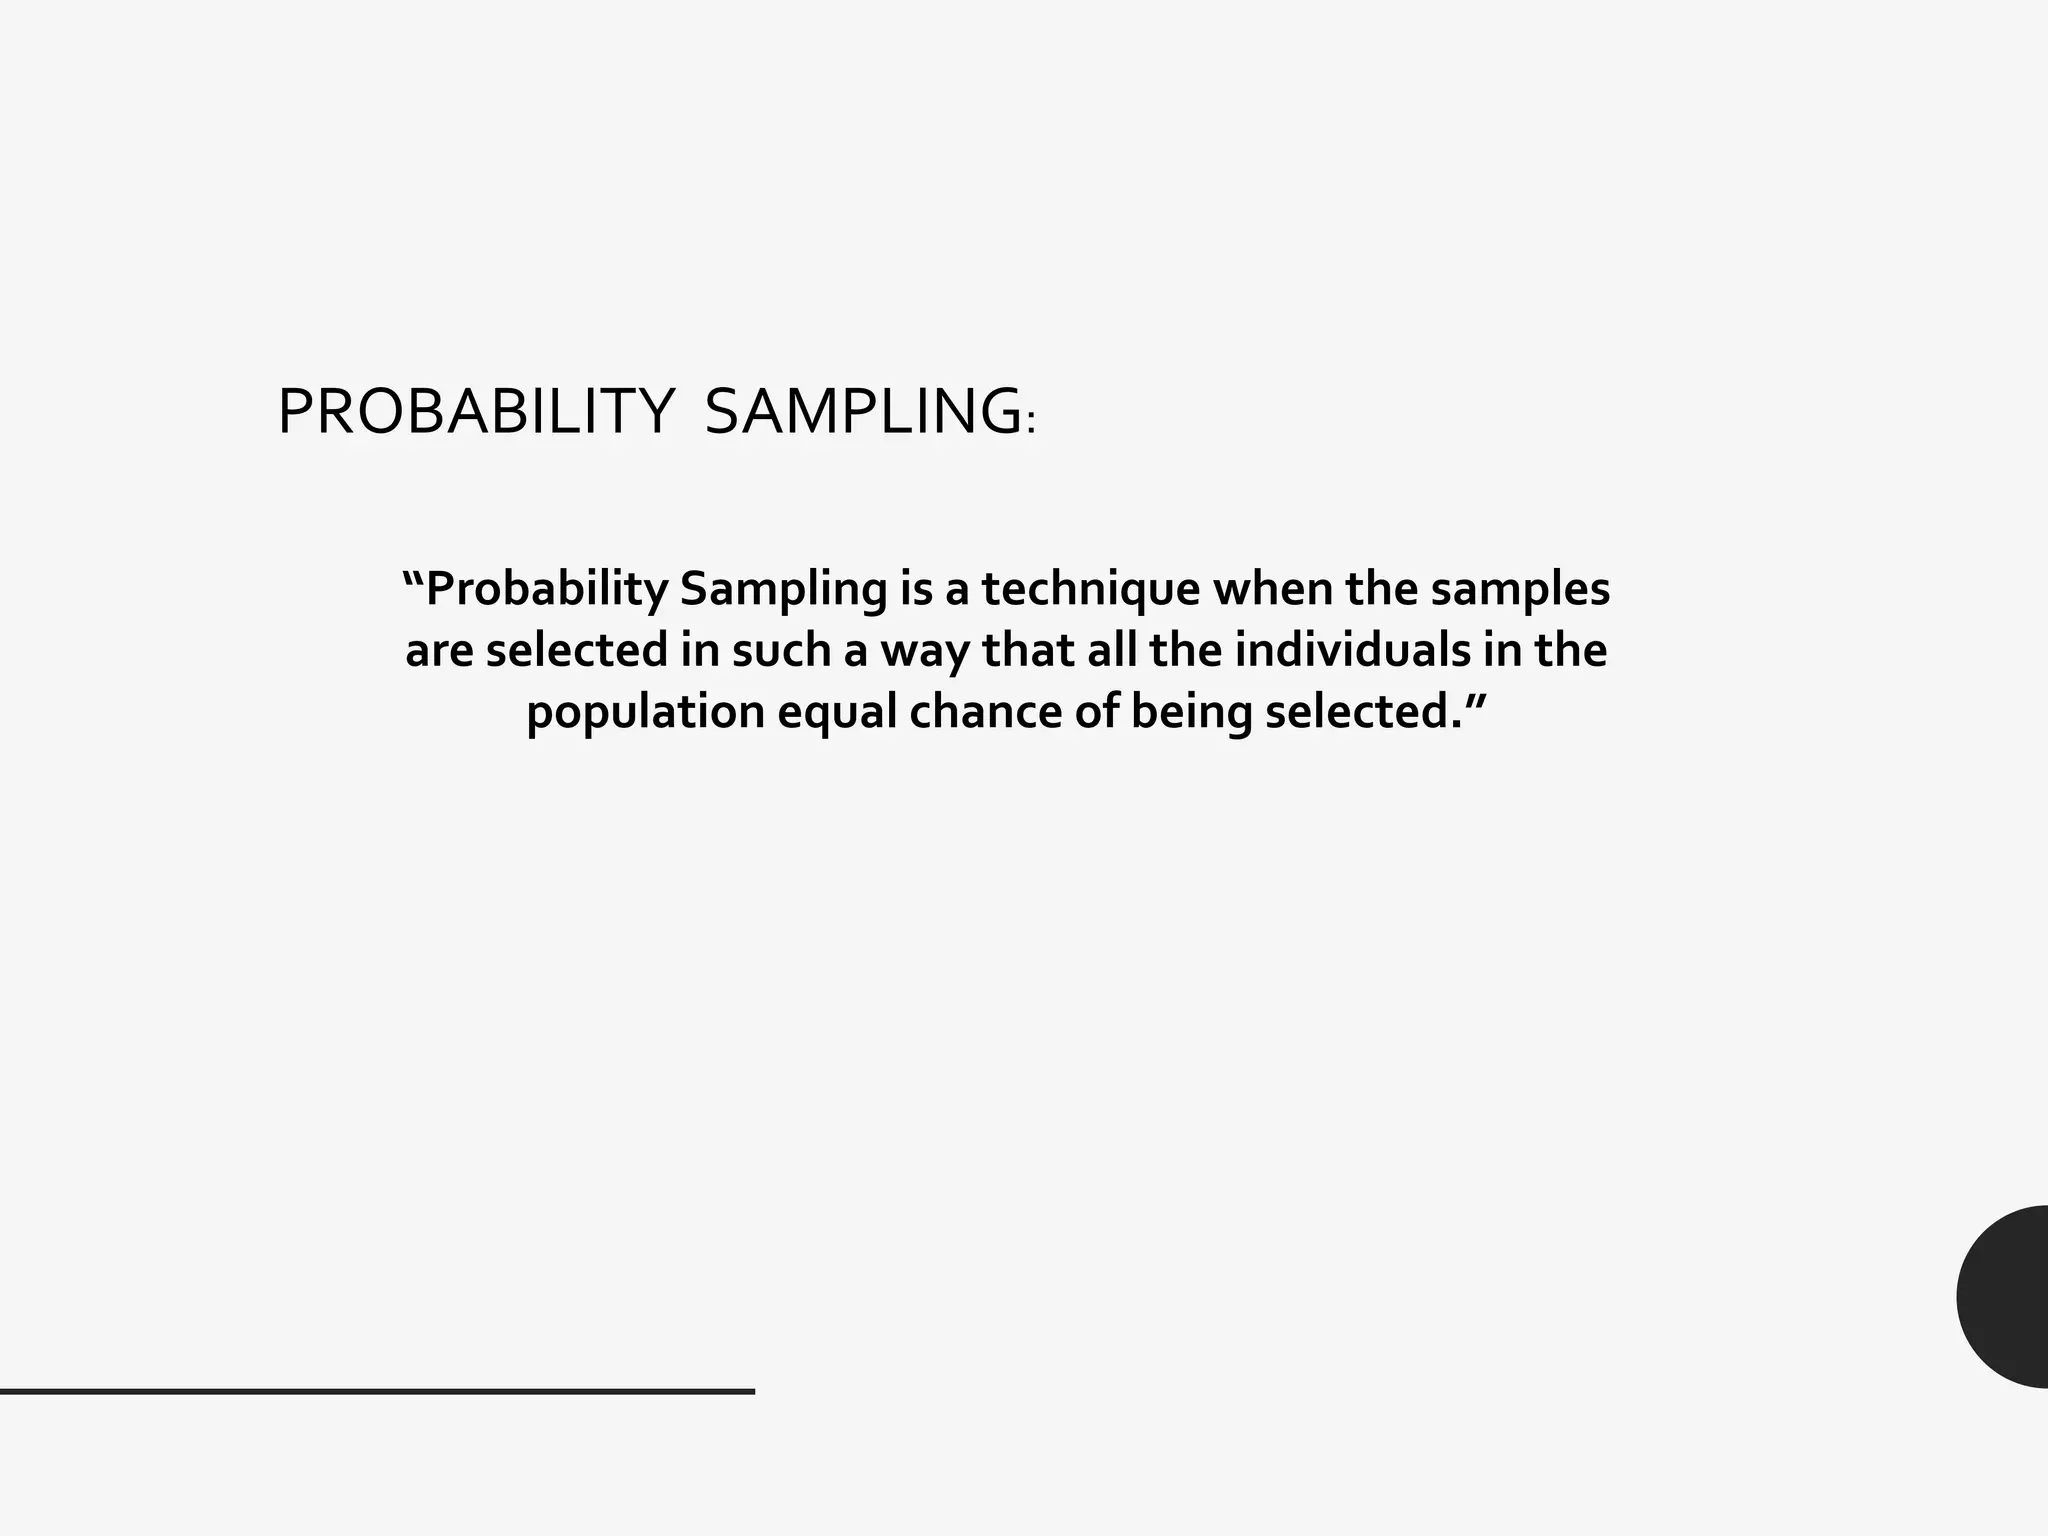
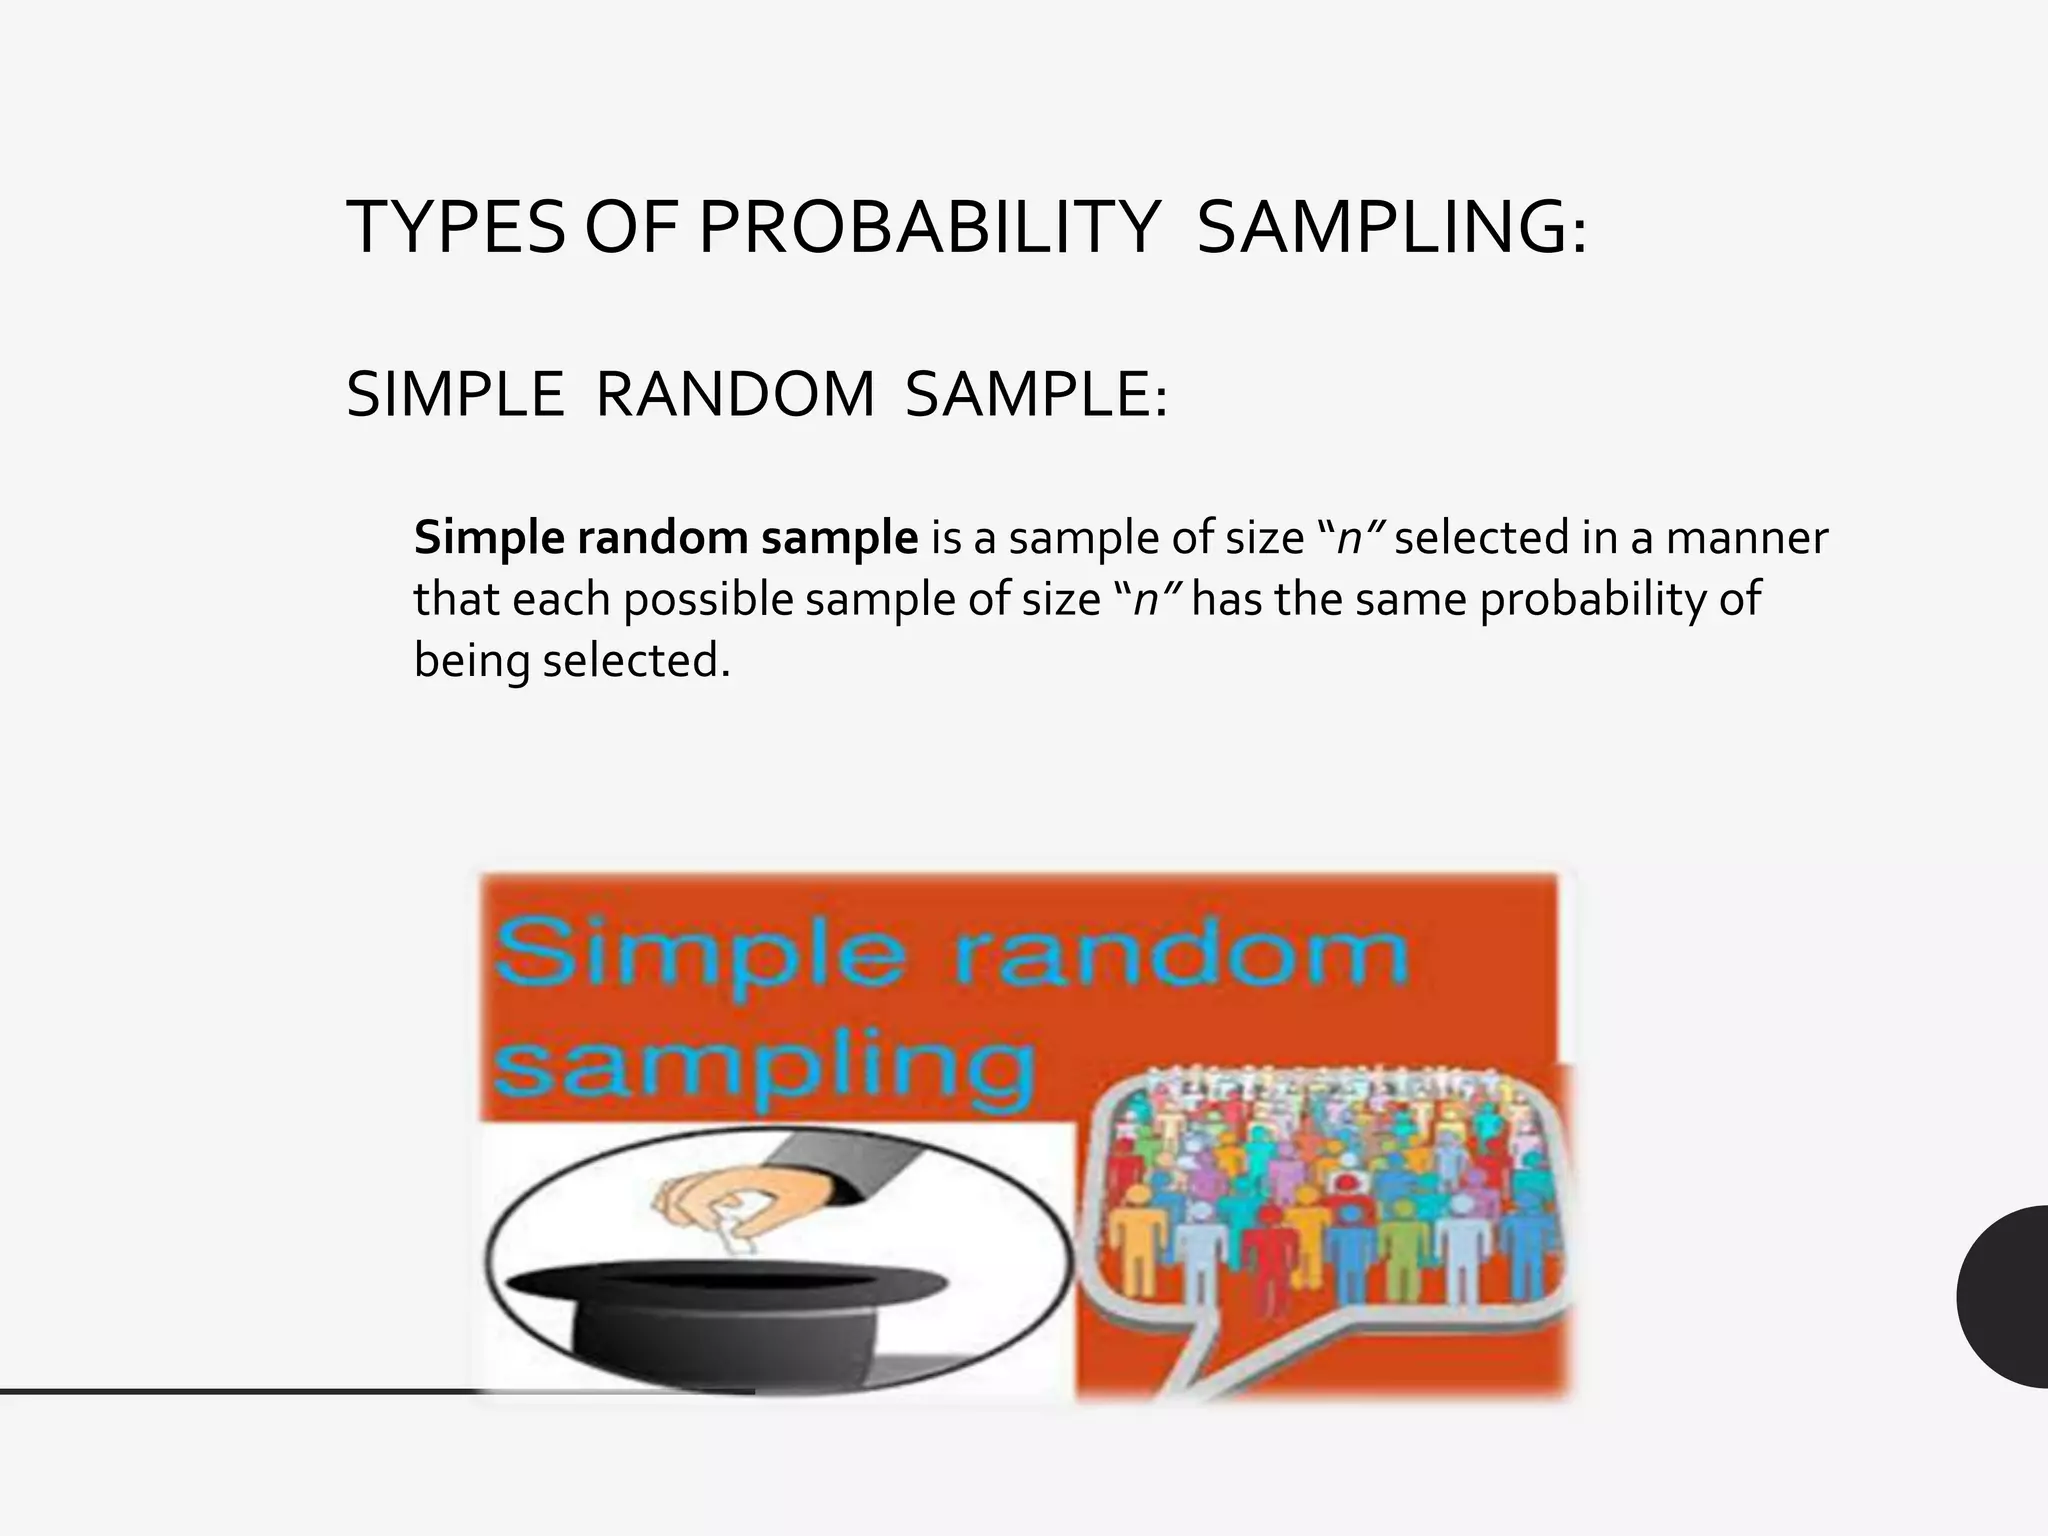
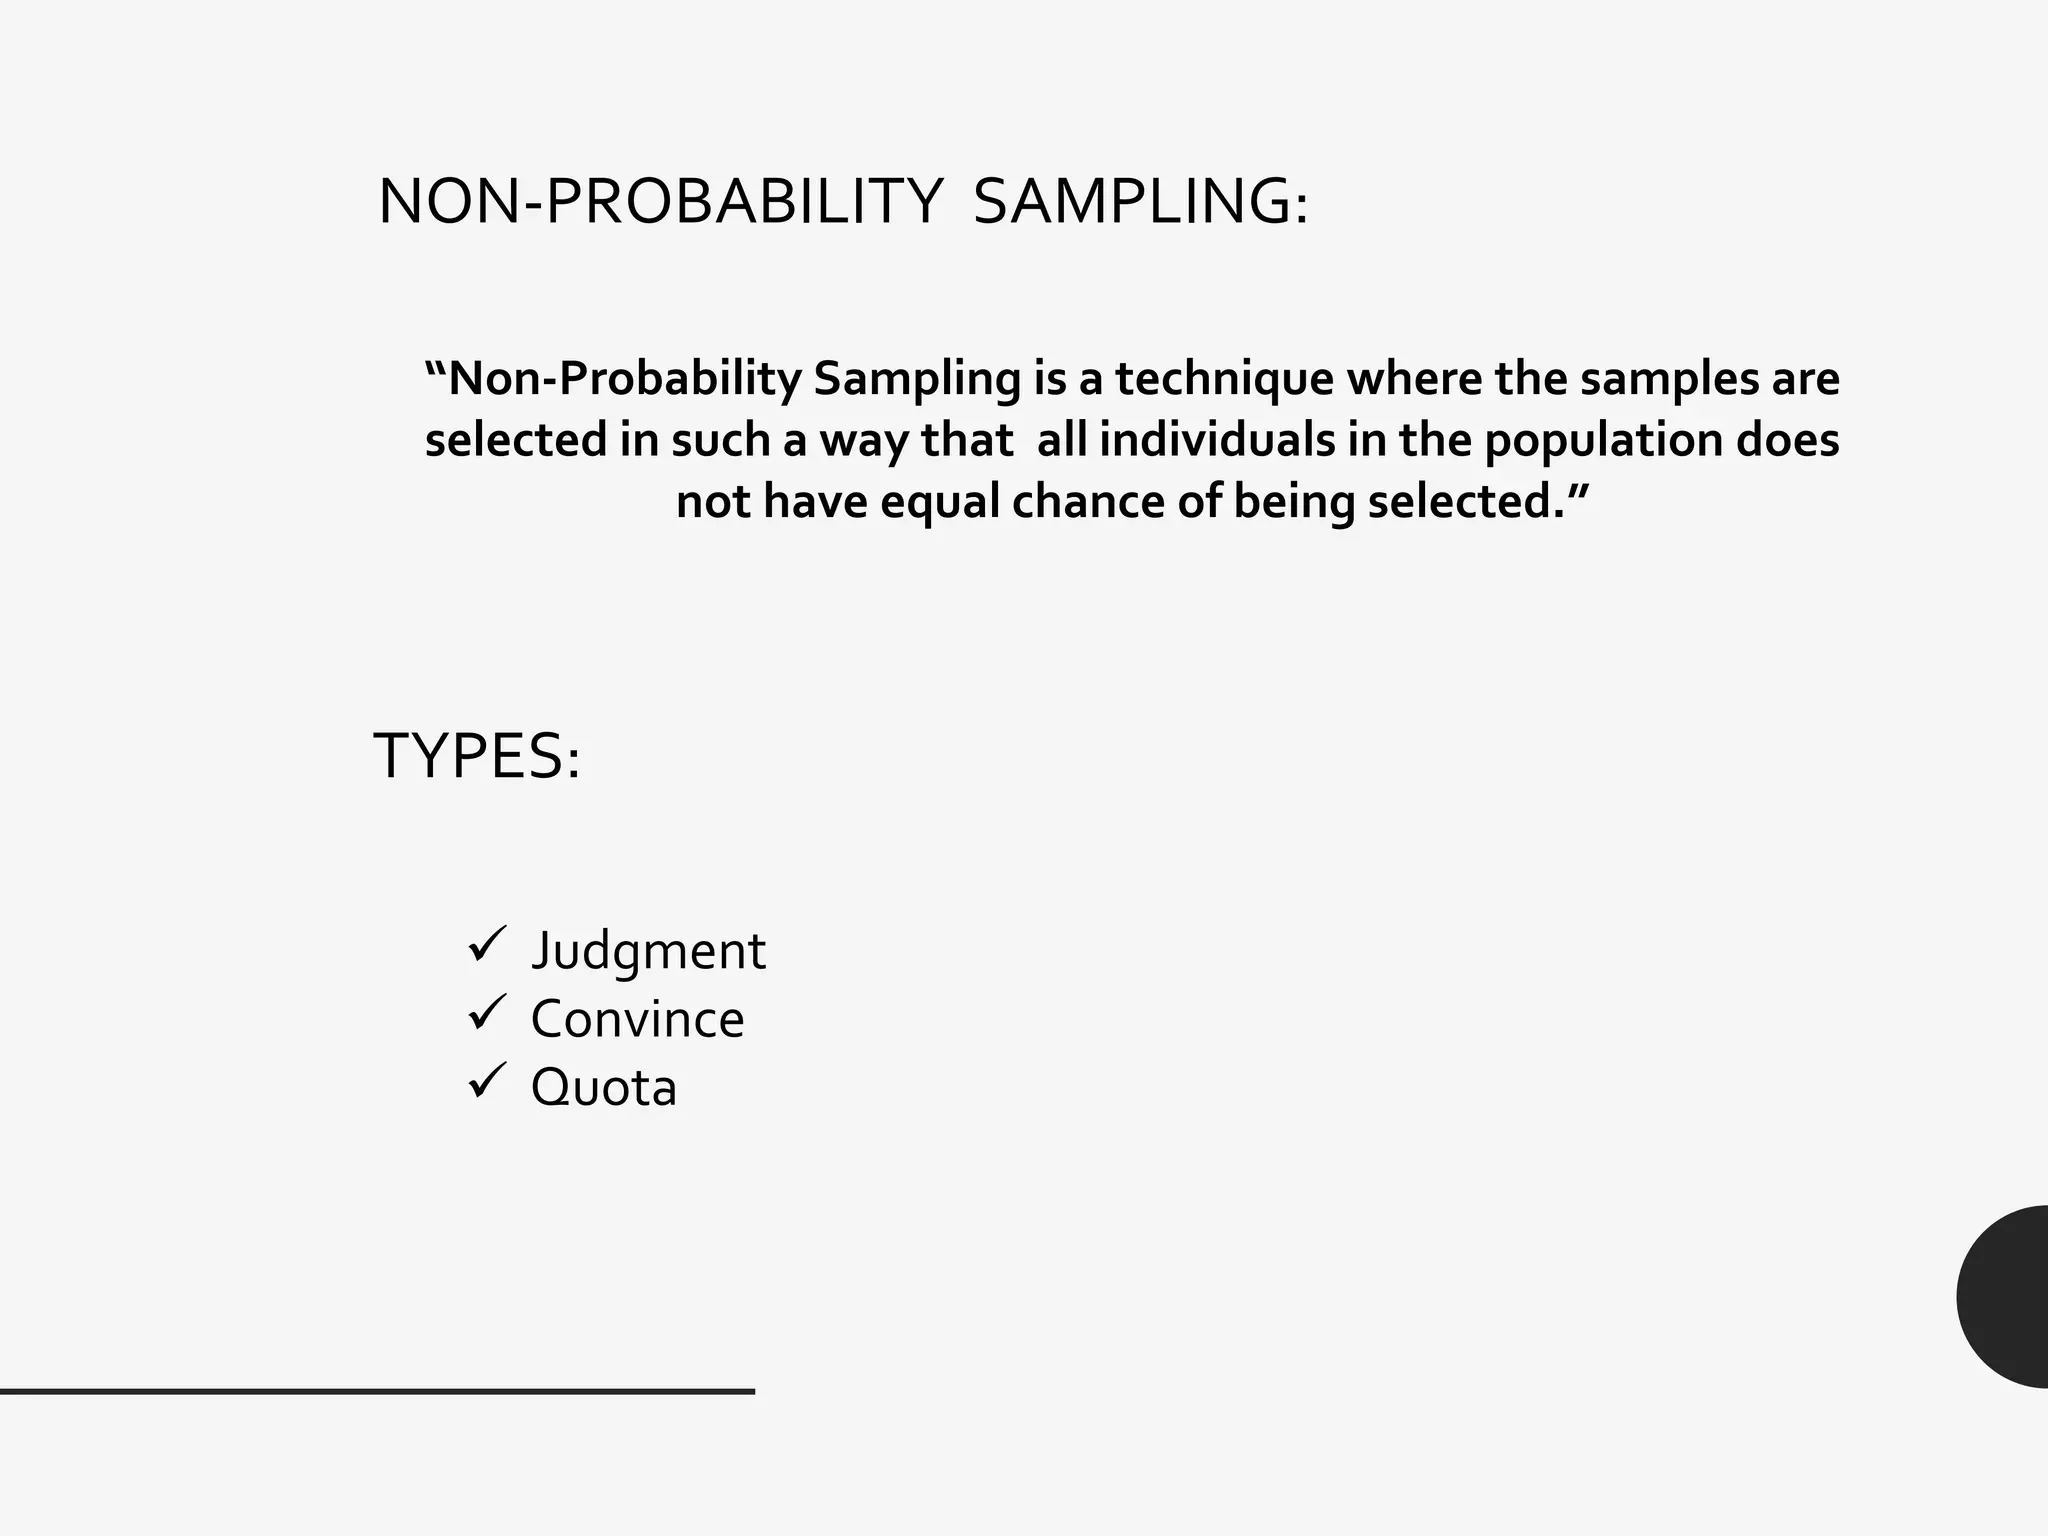
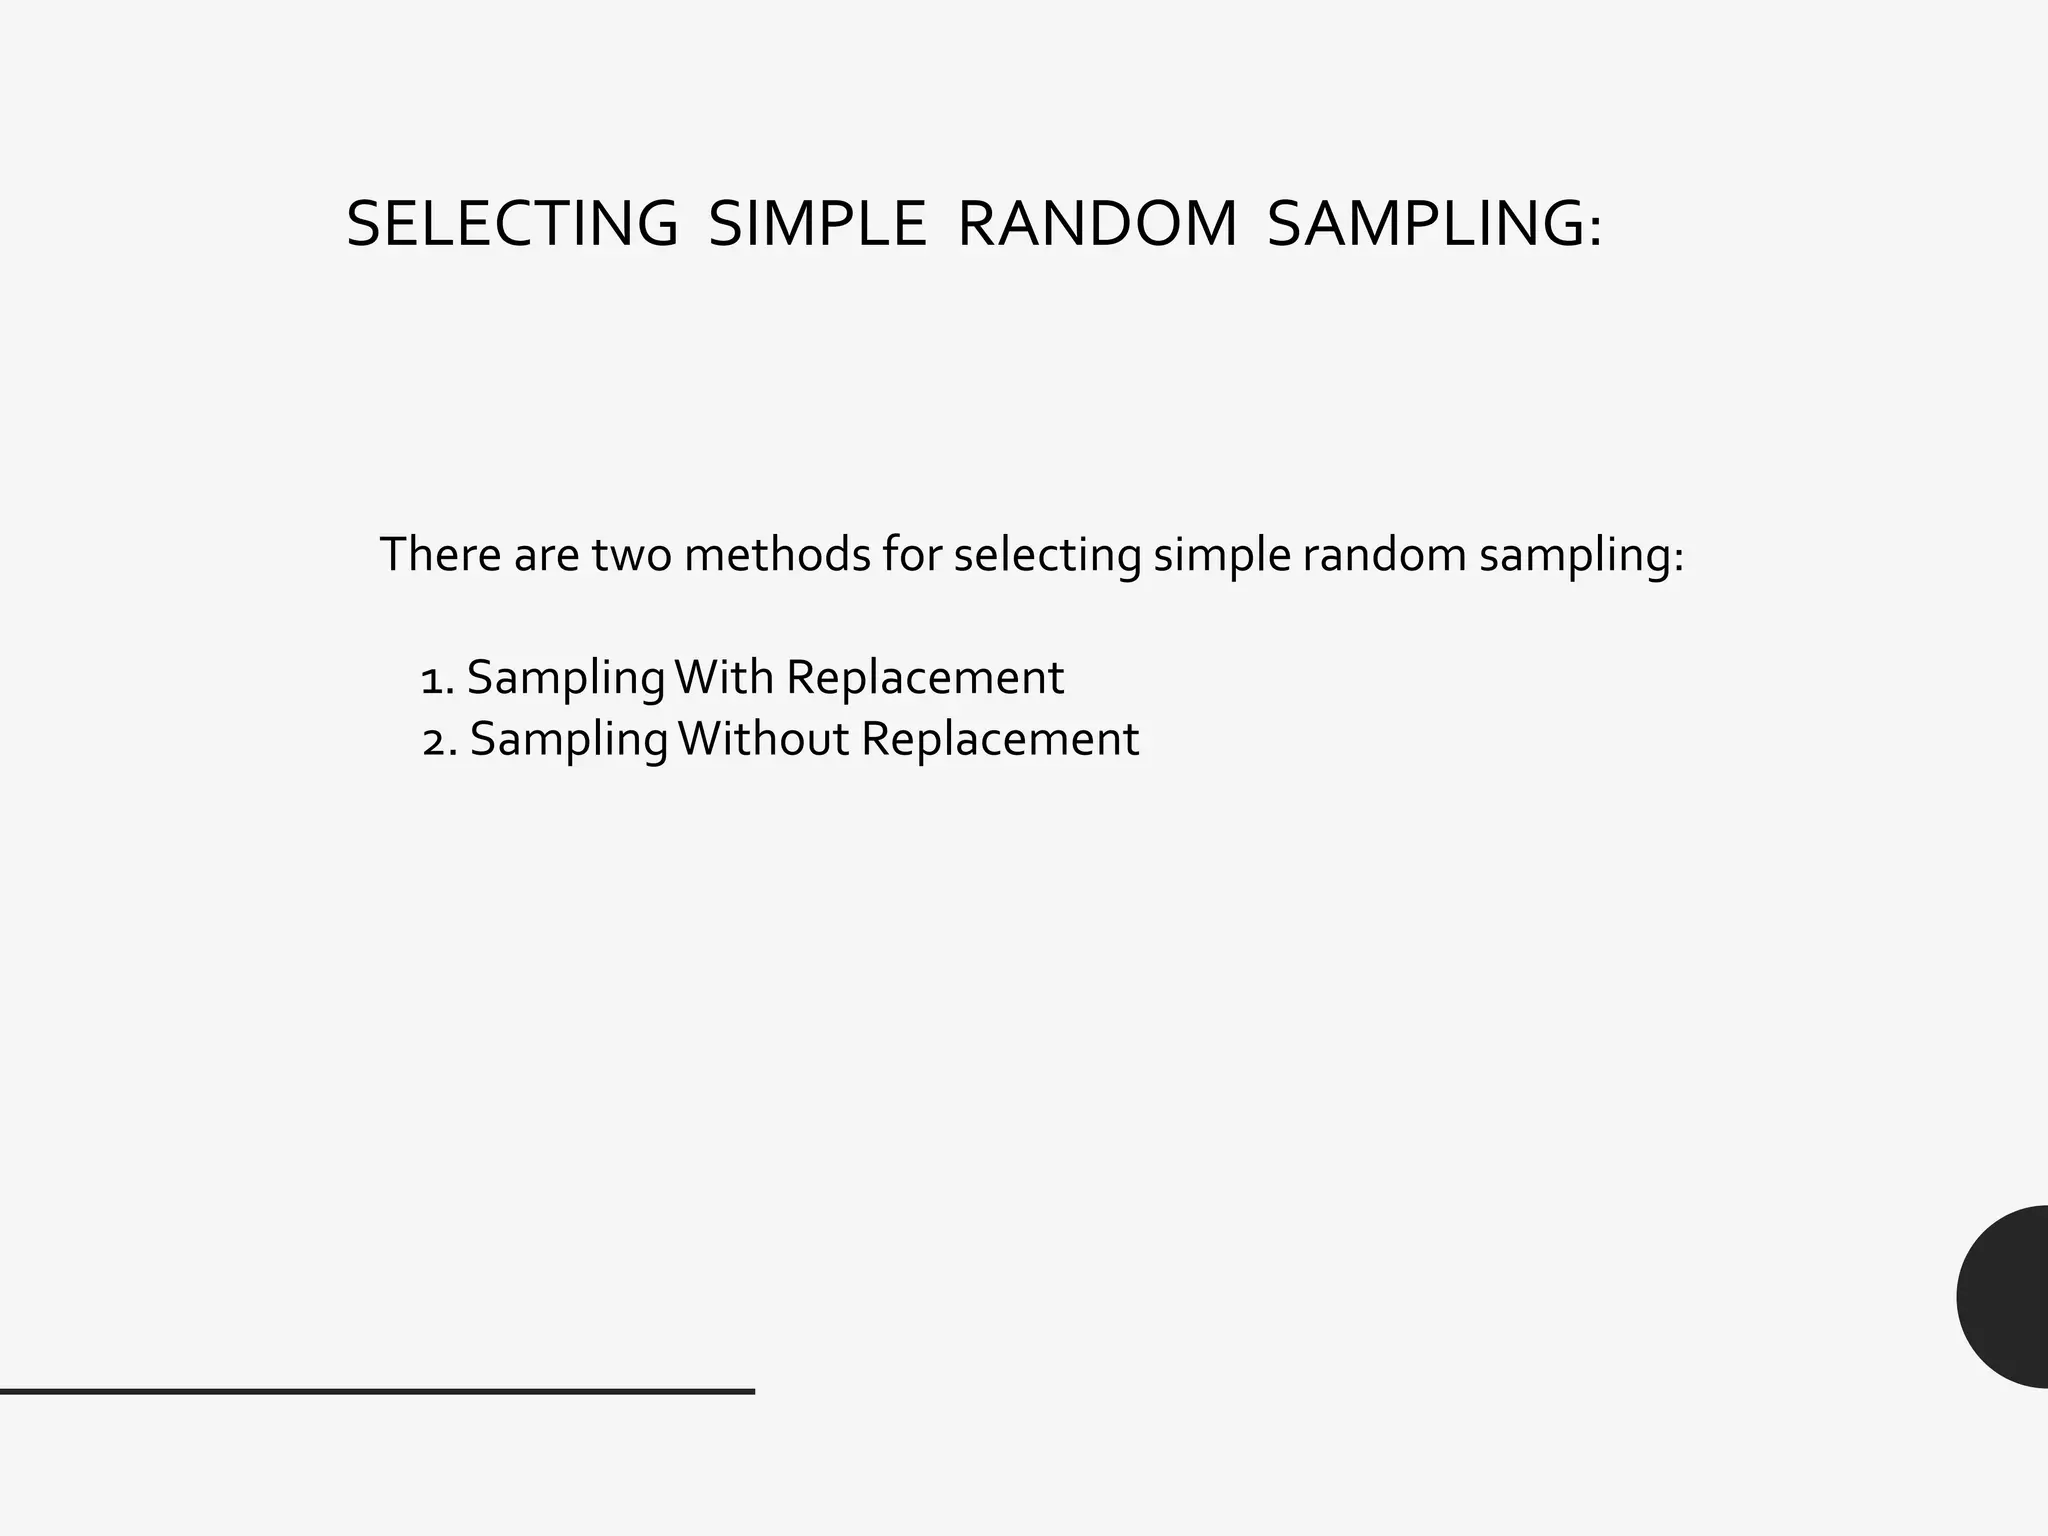
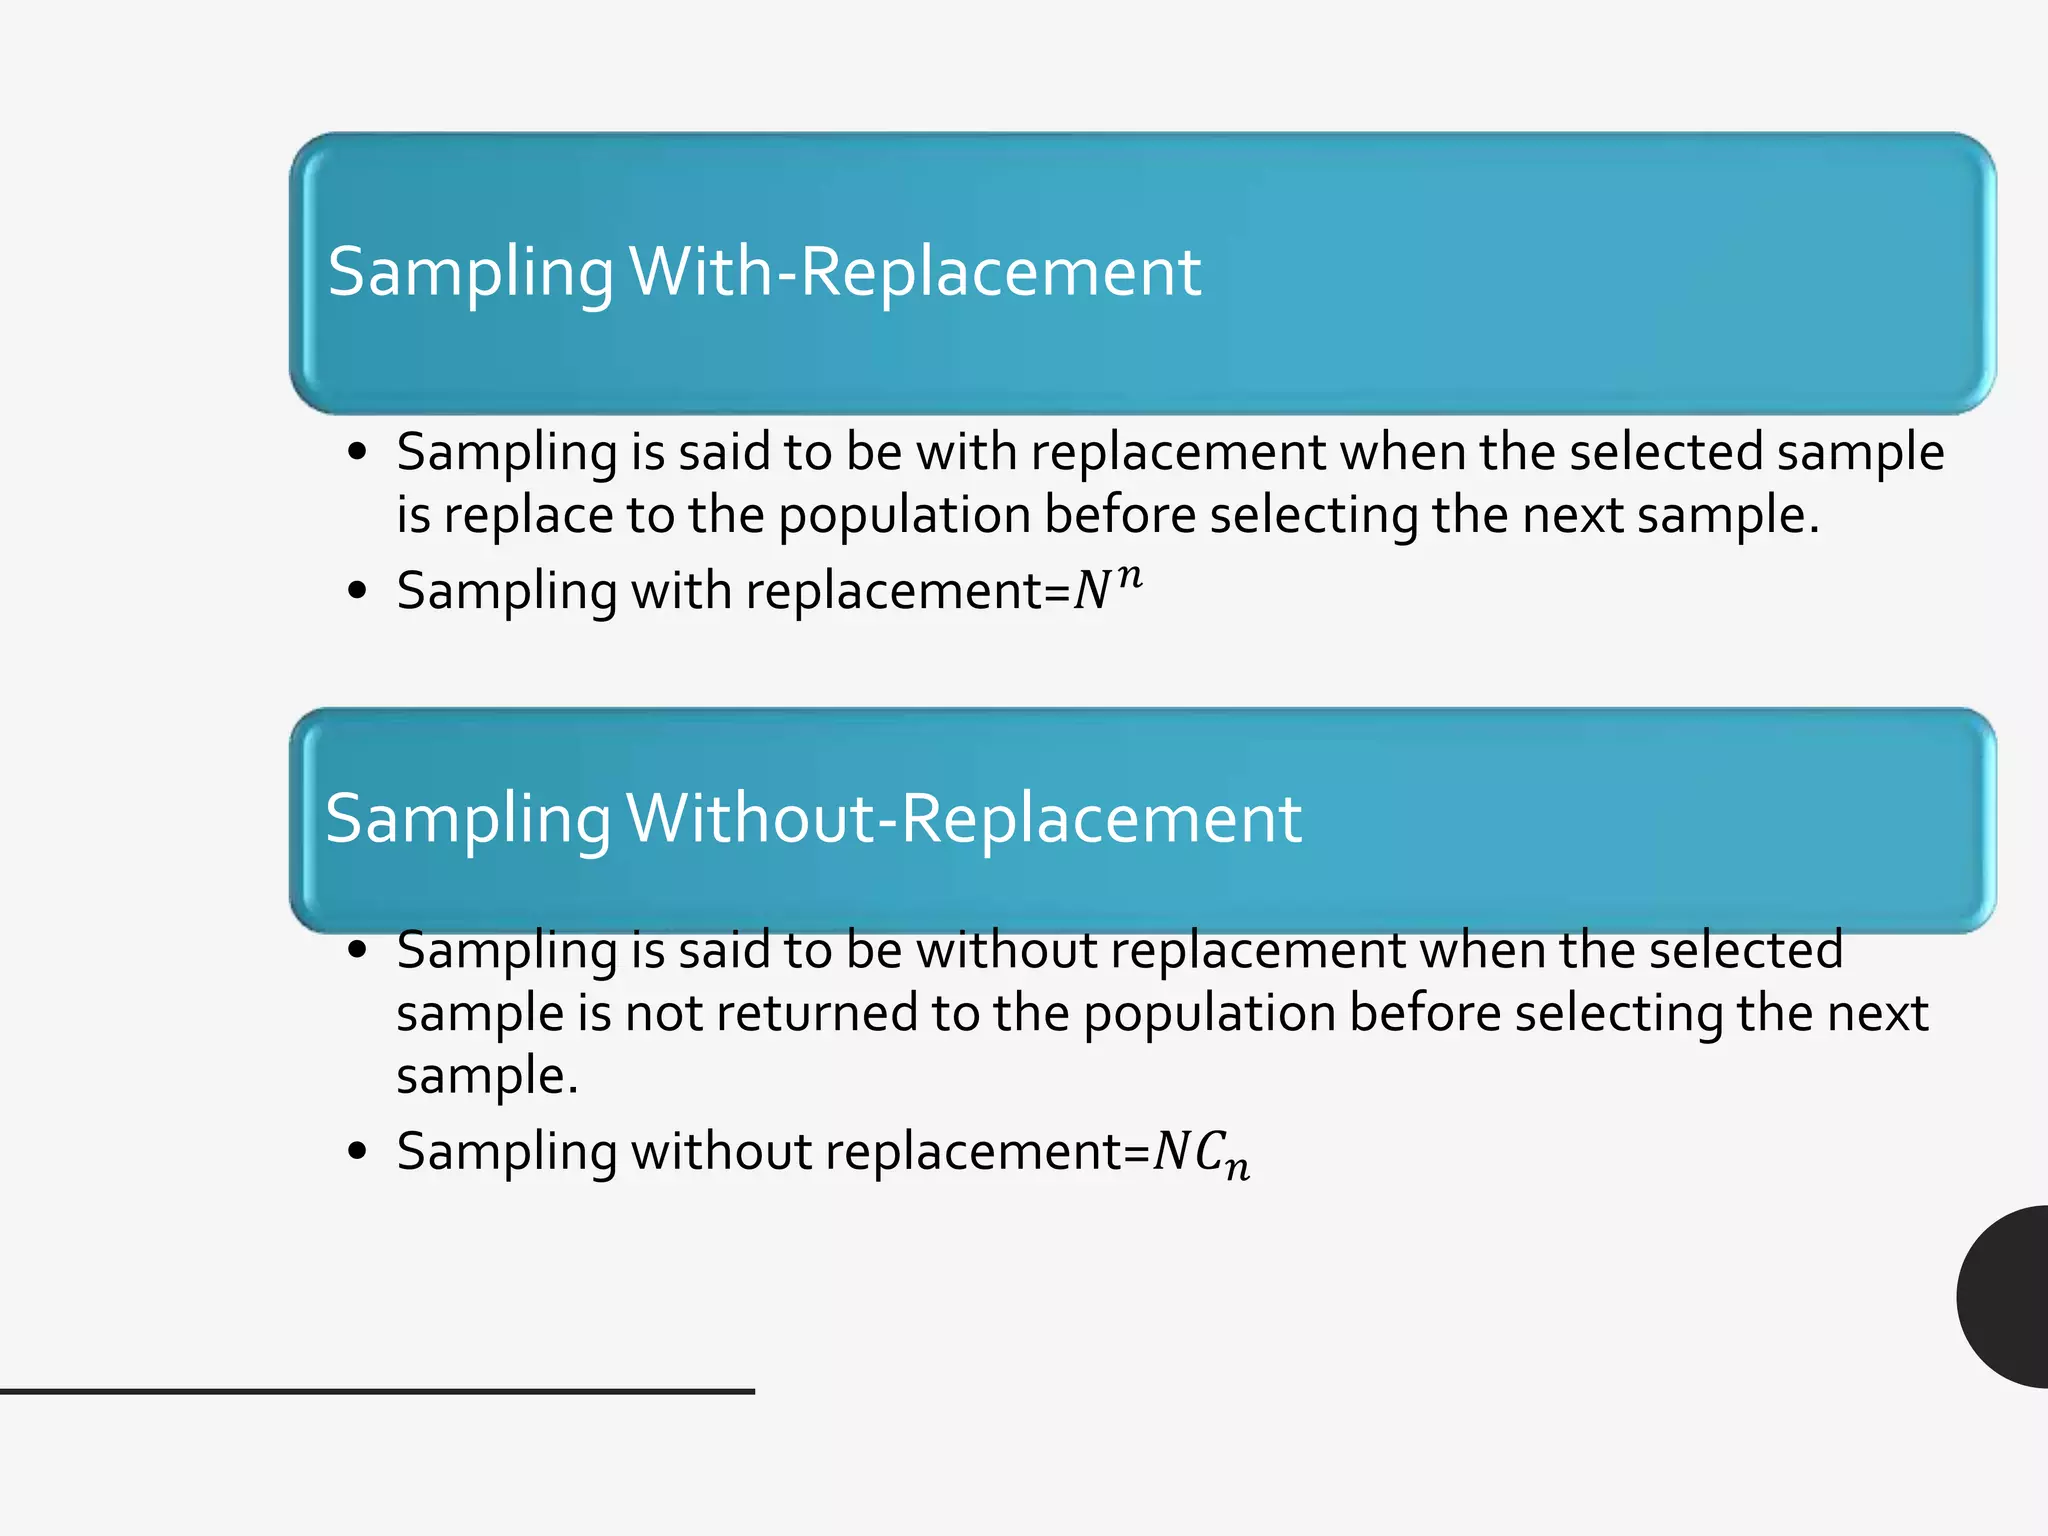
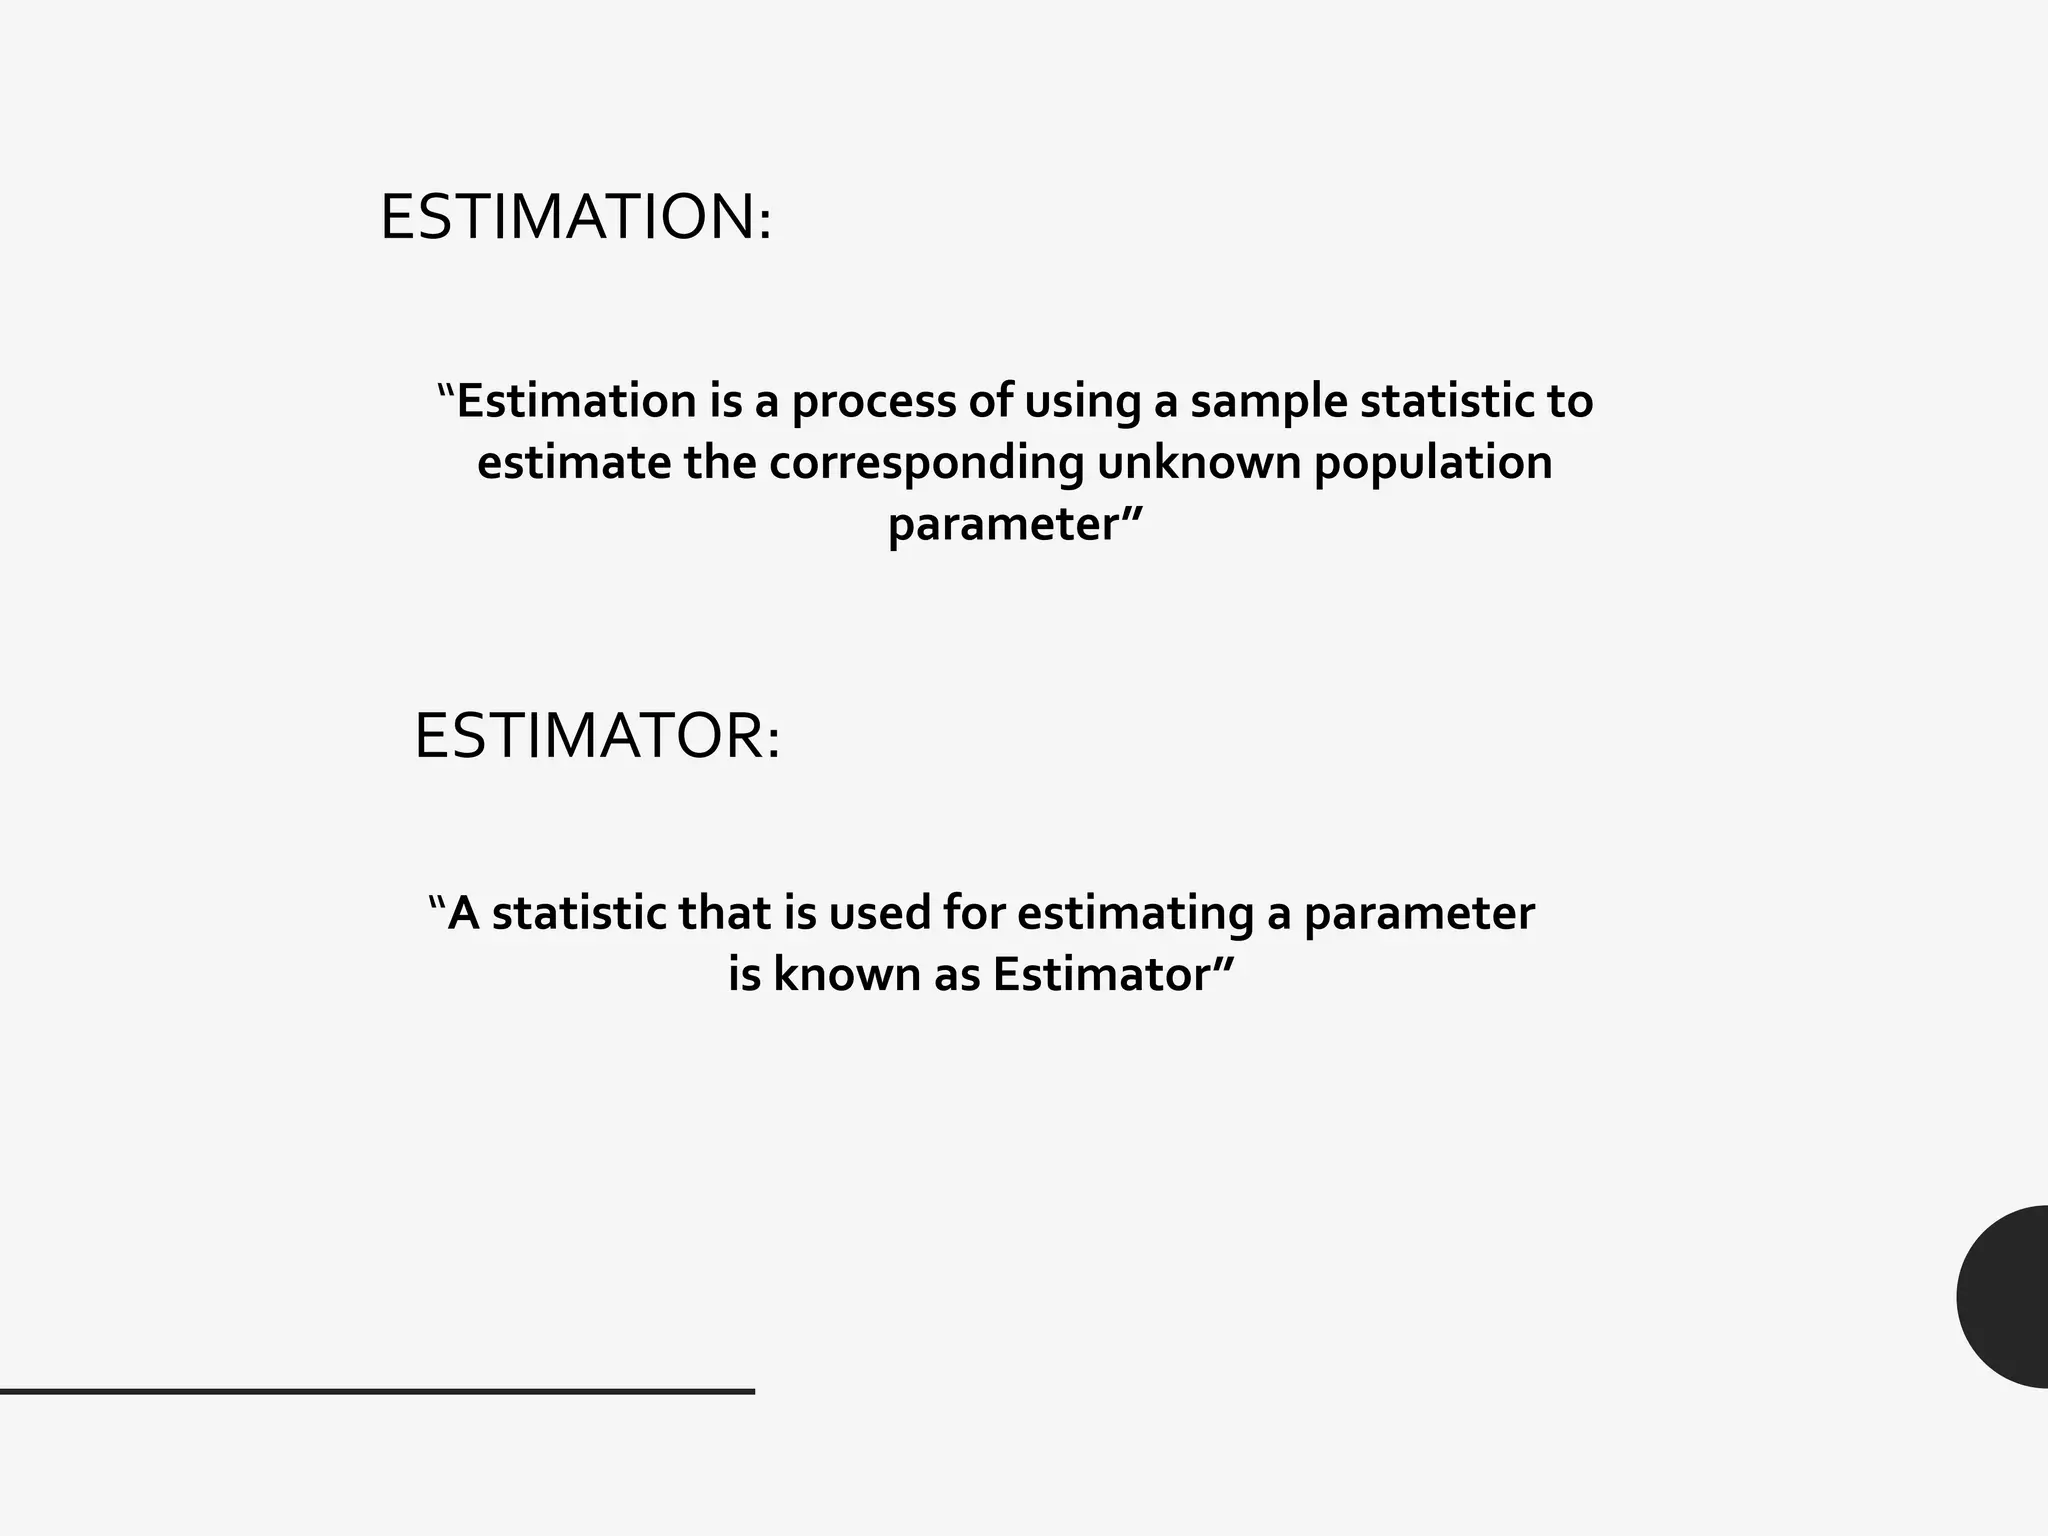
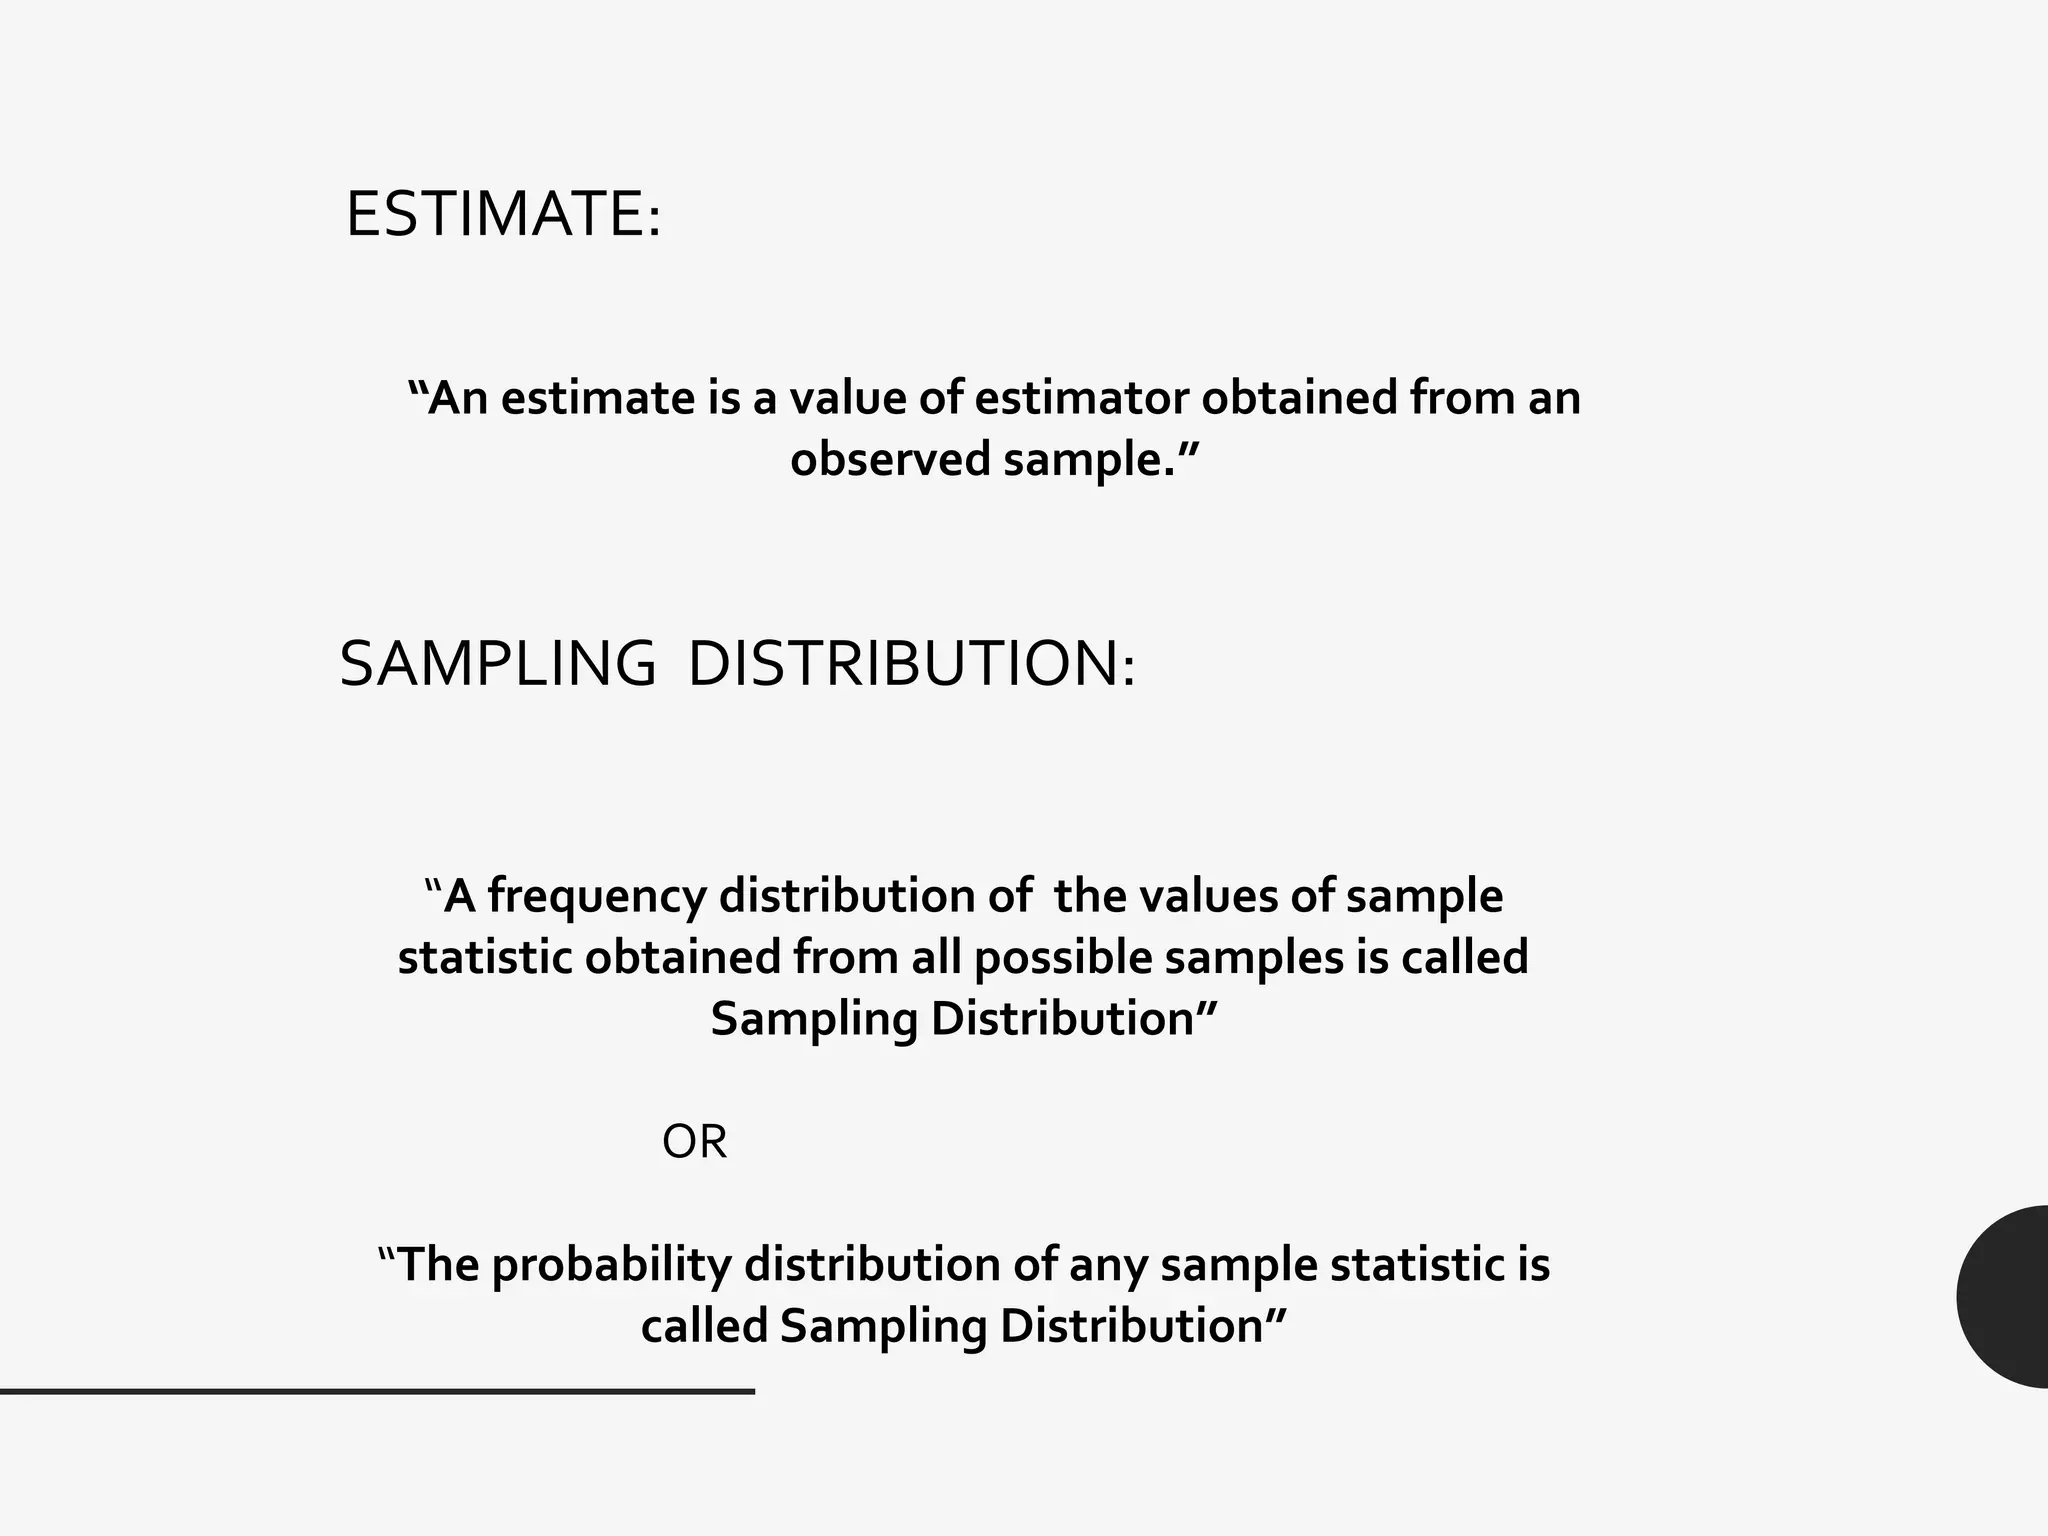
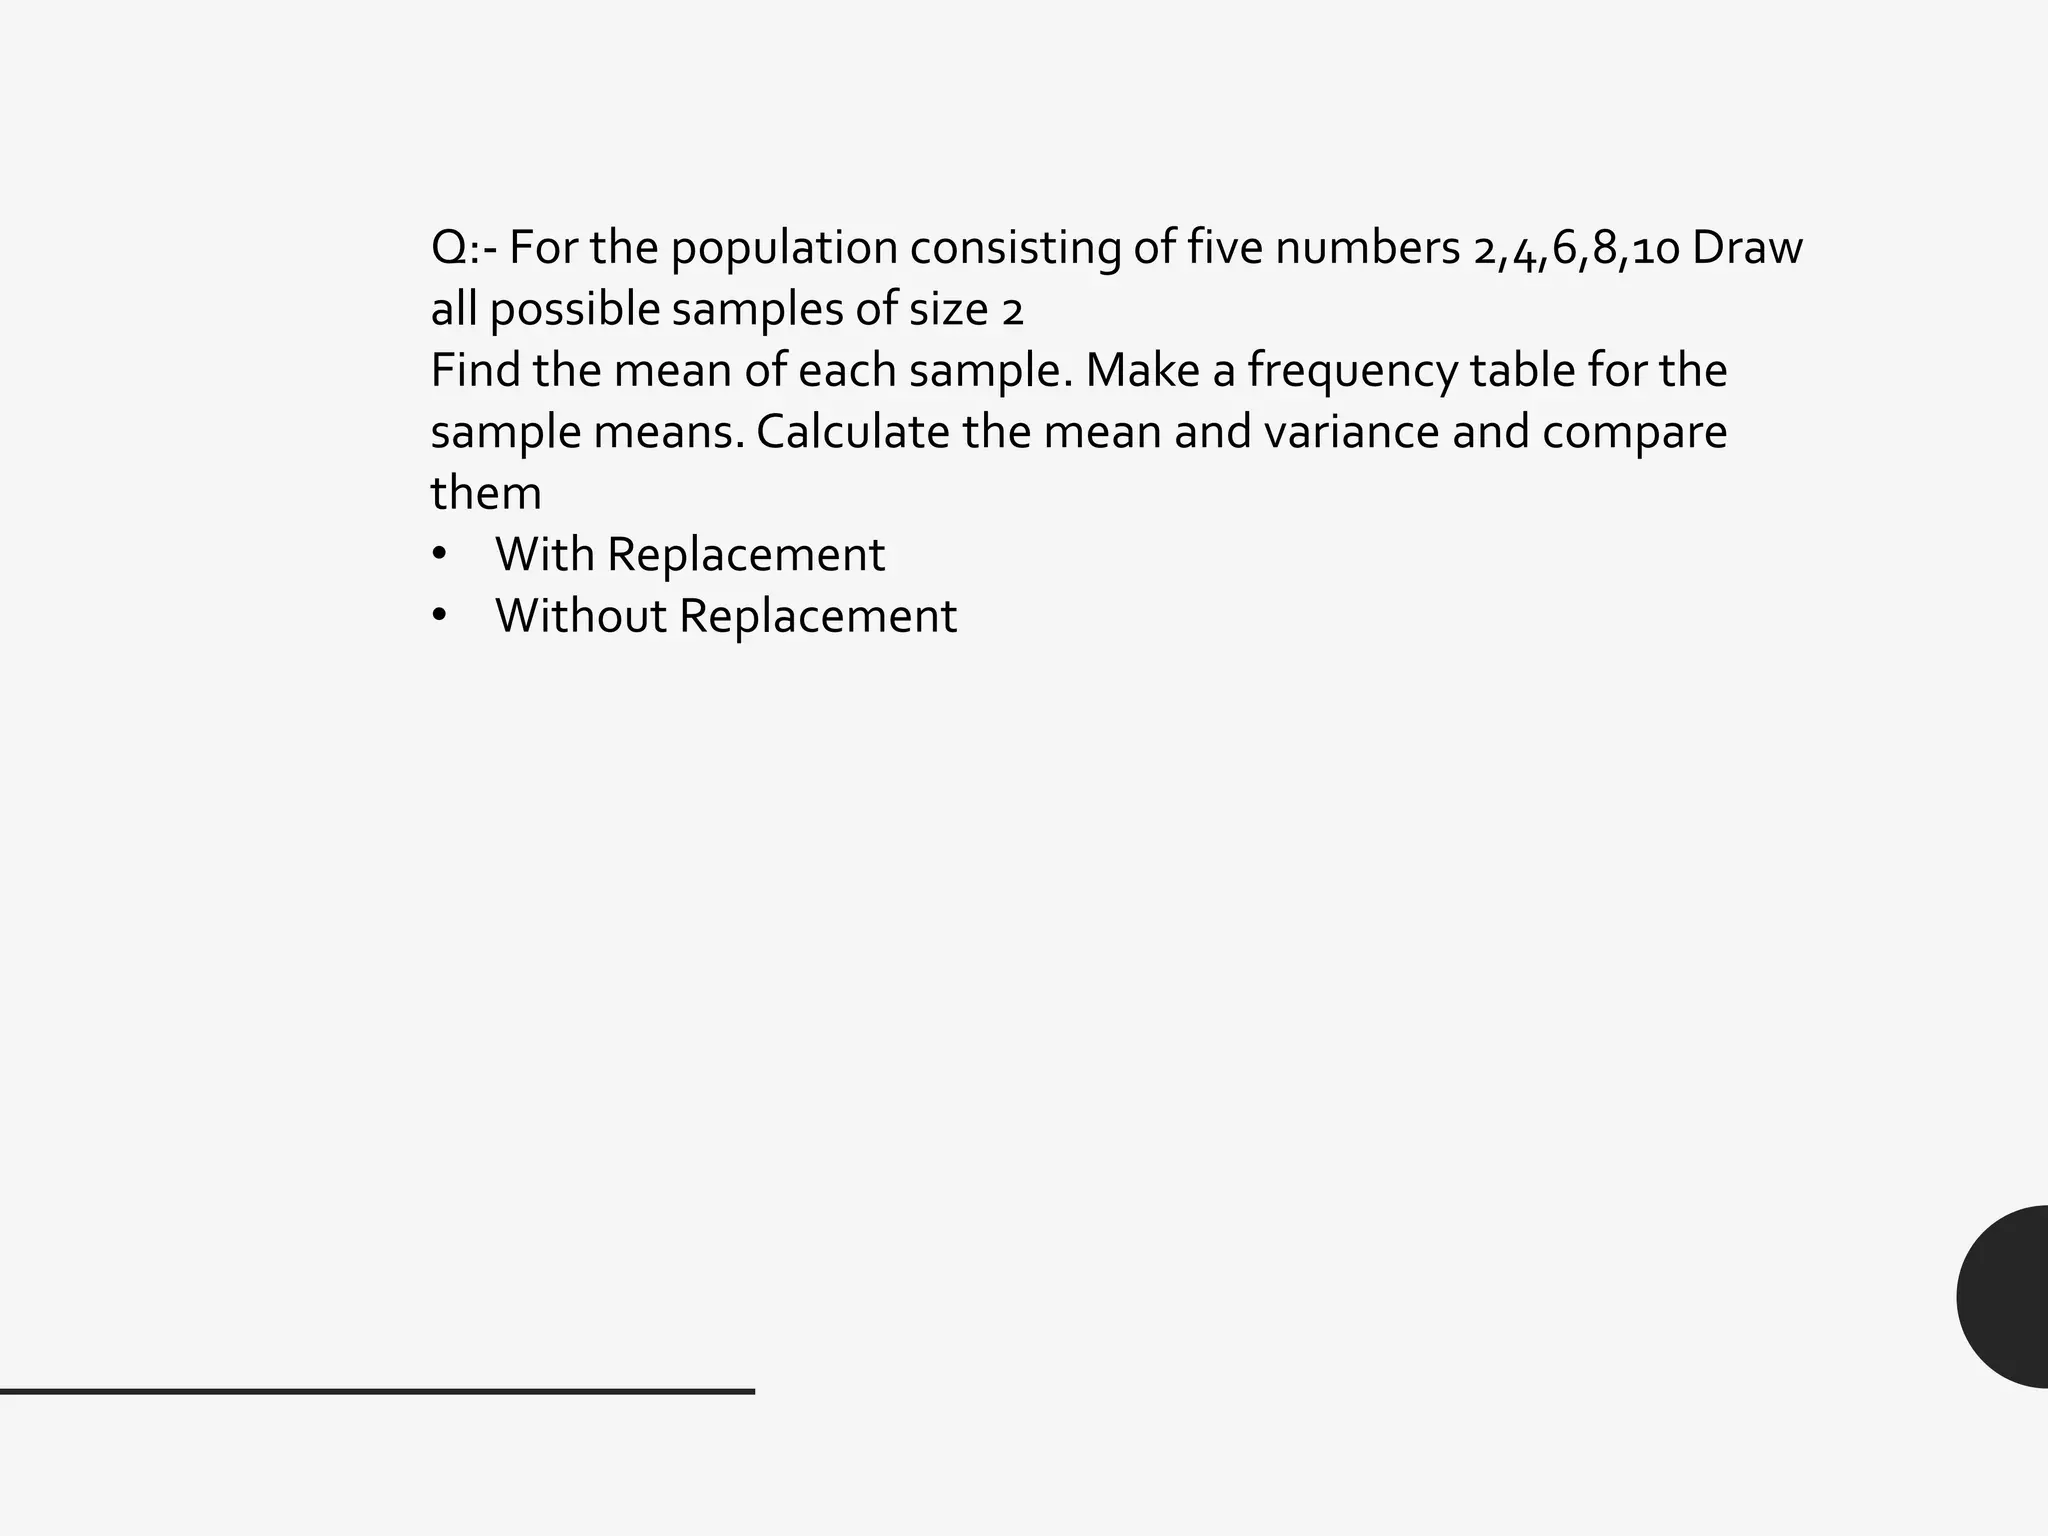
SAMPLING DISTRIBUTION ABOUT
SAMPLE MEAN
BY: HIRA KHALID
www.linkdln.com/in/hira-khalid
SAMPLING DISTRIBUTION
ABOUT
SAMPLE MEAN
POPULATION:
“The total number of items or observation of anything which is
under study is called Population”
• The population size is denoted by N.
For example:
1. Population of students of first year in a city.
2. Population of patient in a hospital in last year.
SAMPLE:
“Any representative part of population is called Sample”
• It is usually selected at random.
• The good sample is possibly small and shows all the
charisterists of that population.
• Sample size is denoted by “n”.
SAMPLING UNITS:
“Sampling units are those basic units of the population in
term of which the sample is selected”
• These units must be distinct and should not be
overlapping.
For example:
1. The sampling unit may be a student.
2. The sampling unit may be a city.
3. The sampling unit may be a field etc…
SAMPLED POPULATION:
“Population from which sample is drawn. Researcher
should define”
SAMPLING FRAME:
“A sampling frame is the source material or device from
which a sample is drawn”
It is a list of all those within a population who can be sampled
and may include individuals, households and institutions.
PARAMETER:
“The result which is obtained from all the units of the
population is called Parameter”
• It is always a constant value.
For example:
µ,σ,ρ etc…
STATISTIC:
“The result which is obtained from all the units of sample
is called Statistic”
For example:
SAMPLING:
“The procedure of selecting a sample from given
population is called Sampling”
Sampling
Probability
Sampling
Simple
Random
Systematic
Cluster
Stratified
Non-
Probability
Sampling
Judgment
Convenience
Quota
PROBABILITY SAMPLING:
“Probability Sampling is a technique when the samples
are selected in such a way that all the individuals in the
population equal chance of being selected.”
SIMPLE RANDOM SAMPLE:
Simple random sample is a sample of size “n” selected in a manner
that each possible sample of size “n” has the same probability of
being selected.
TYPES OF PROBABILITY SAMPLING:
STRATIFIED RANDOM
SAMPLING:
“Partition of data set and draw samples from
each partition is known as Stratified Random
Sampling”
SYSTEMATIC SAMPLING:
“In Systematic Sampling units are drawn from the list at
regular intervals”
• The first unit in the sample is selected at random from 1 to N
units in the population and then every Kth unit is included in
the sample.
• The regular interval is called Sampling interval.
CLUSTER:
A Cluster sample is obtained by dividing the population into
groups of individuals or a natural group
Clusters
Educational
institutions
Agriculture
House
holds
CLUSTER SAMPLING:
When the sample is drawn from these clusters
this is known as Cluster Sampling.
Difference between Stratified and
Cluster Sampling:
• In stratified groups are internally homogenous but externally
heterogeneous, means that in stratified we divide the data into
different categories according to charistics like same age of
different groups
• In cluster groups are internally heterogeneous but externally
homogenous means that in this we divide the data into
different clusters according to geographical location means
that data is divide into different groups according location
NON-PROBABILITY SAMPLING:
“Non-Probability Sampling is a technique where the samples are
selected in such a way that all individuals in the population does
not have equal chance of being selected.”
TYPES:
 Judgment
 Convince
 Quota
SELECTING SIMPLE RANDOM SAMPLING:
There are two methods for selecting simple random sampling:
1. SamplingWith Replacement
2. SamplingWithout Replacement
SamplingWith-Replacement
• Sampling is said to be with replacement when the selected sample
is replace to the population before selecting the next sample.
• Sampling with replacement=𝑁 𝑛
SamplingWithout-Replacement
• Sampling is said to be without replacement when the selected
sample is not returned to the population before selecting the next
sample.
• Sampling without replacement=𝑁𝐶 𝑛
ESTIMATION:
“Estimation is a process of using a sample statistic to
estimate the corresponding unknown population
parameter”
ESTIMATOR:
“A statistic that is used for estimating a parameter
is known as Estimator”
ESTIMATE:
“An estimate is a value of estimator obtained from an
observed sample.”
SAMPLING DISTRIBUTION:
“A frequency distribution of the values of sample
statistic obtained from all possible samples is called
Sampling Distribution”
OR
“The probability distribution of any sample statistic is
called Sampling Distribution”
SAMPLING DISTRIBUTION OF SAMPLE MEAN:
“The probability distribution of mean is called Sampling
Distribution of Sample Mean”
Here mean = 𝜇 𝑥
𝜇 𝑥 = 𝑥𝑓 𝑥
Variance = 𝜎 𝑥
2
𝜎 𝑥
2
= 𝑥 2
𝑓 𝑥
Q:- For the population consisting of five numbers 2,4,6,8,10 Draw
all possible samples of size 2
Find the mean of each sample. Make a frequency table for the
sample means. Calculate the mean and variance and compare
them
• With Replacement
• Without Replacement

Sampling Distribution

  • 1.
    SAMPLING DISTRIBUTION ABOUT SAMPLEMEAN BY: HIRA KHALID www.linkdln.com/in/hira-khalid
  • 2.
  • 3.
    POPULATION: “The total numberof items or observation of anything which is under study is called Population” • The population size is denoted by N. For example: 1. Population of students of first year in a city. 2. Population of patient in a hospital in last year.
  • 4.
    SAMPLE: “Any representative partof population is called Sample” • It is usually selected at random. • The good sample is possibly small and shows all the charisterists of that population. • Sample size is denoted by “n”.
  • 5.
    SAMPLING UNITS: “Sampling unitsare those basic units of the population in term of which the sample is selected” • These units must be distinct and should not be overlapping. For example: 1. The sampling unit may be a student. 2. The sampling unit may be a city. 3. The sampling unit may be a field etc… SAMPLED POPULATION: “Population from which sample is drawn. Researcher should define”
  • 6.
    SAMPLING FRAME: “A samplingframe is the source material or device from which a sample is drawn” It is a list of all those within a population who can be sampled and may include individuals, households and institutions.
  • 7.
    PARAMETER: “The result whichis obtained from all the units of the population is called Parameter” • It is always a constant value. For example: µ,σ,ρ etc… STATISTIC: “The result which is obtained from all the units of sample is called Statistic” For example:
  • 8.
    SAMPLING: “The procedure ofselecting a sample from given population is called Sampling”
  • 9.
  • 10.
    PROBABILITY SAMPLING: “Probability Samplingis a technique when the samples are selected in such a way that all the individuals in the population equal chance of being selected.”
  • 11.
    SIMPLE RANDOM SAMPLE: Simplerandom sample is a sample of size “n” selected in a manner that each possible sample of size “n” has the same probability of being selected. TYPES OF PROBABILITY SAMPLING:
  • 12.
    STRATIFIED RANDOM SAMPLING: “Partition ofdata set and draw samples from each partition is known as Stratified Random Sampling” SYSTEMATIC SAMPLING: “In Systematic Sampling units are drawn from the list at regular intervals” • The first unit in the sample is selected at random from 1 to N units in the population and then every Kth unit is included in the sample. • The regular interval is called Sampling interval.
  • 13.
    CLUSTER: A Cluster sampleis obtained by dividing the population into groups of individuals or a natural group Clusters Educational institutions Agriculture House holds
  • 14.
    CLUSTER SAMPLING: When thesample is drawn from these clusters this is known as Cluster Sampling.
  • 15.
    Difference between Stratifiedand Cluster Sampling: • In stratified groups are internally homogenous but externally heterogeneous, means that in stratified we divide the data into different categories according to charistics like same age of different groups • In cluster groups are internally heterogeneous but externally homogenous means that in this we divide the data into different clusters according to geographical location means that data is divide into different groups according location
  • 16.
    NON-PROBABILITY SAMPLING: “Non-Probability Samplingis a technique where the samples are selected in such a way that all individuals in the population does not have equal chance of being selected.” TYPES:  Judgment  Convince  Quota
  • 17.
    SELECTING SIMPLE RANDOMSAMPLING: There are two methods for selecting simple random sampling: 1. SamplingWith Replacement 2. SamplingWithout Replacement
  • 18.
    SamplingWith-Replacement • Sampling issaid to be with replacement when the selected sample is replace to the population before selecting the next sample. • Sampling with replacement=𝑁 𝑛 SamplingWithout-Replacement • Sampling is said to be without replacement when the selected sample is not returned to the population before selecting the next sample. • Sampling without replacement=𝑁𝐶 𝑛
  • 19.
    ESTIMATION: “Estimation is aprocess of using a sample statistic to estimate the corresponding unknown population parameter” ESTIMATOR: “A statistic that is used for estimating a parameter is known as Estimator”
  • 20.
    ESTIMATE: “An estimate isa value of estimator obtained from an observed sample.” SAMPLING DISTRIBUTION: “A frequency distribution of the values of sample statistic obtained from all possible samples is called Sampling Distribution” OR “The probability distribution of any sample statistic is called Sampling Distribution”
  • 21.
    SAMPLING DISTRIBUTION OFSAMPLE MEAN: “The probability distribution of mean is called Sampling Distribution of Sample Mean” Here mean = 𝜇 𝑥 𝜇 𝑥 = 𝑥𝑓 𝑥 Variance = 𝜎 𝑥 2 𝜎 𝑥 2 = 𝑥 2 𝑓 𝑥
  • 22.
    Q:- For thepopulation consisting of five numbers 2,4,6,8,10 Draw all possible samples of size 2 Find the mean of each sample. Make a frequency table for the sample means. Calculate the mean and variance and compare them • With Replacement • Without Replacement