SlideShare a Scribd company logo
1 of 13
What is a Gantt chart?
A Gantt chart, commonly used in project management, is one of the most popular and useful
ways of showing activities (tasks or events) displayed against time. On the left of the chart is a
list of the activities and along the top is a suitable time scale. Each activity is represented by a
bar; the position and length of the bar reflects the start date, duration and end date of the activity.
This allows you to see at a glance:
 What the various activities are
 When each activity begins and ends
 How long each activity is scheduled to last
 Where activities overlap with other activities, and by how much
 The start and end date of the whole project
To summarize, a Gantt chart shows you what has to be done (the activities) and when (the
schedule).
A simple Gantt chart
Gantt Chart History
The first Gantt chart was devised in the mid 1890s by Karol Adamiecki, a Polish engineer who
ran a steelworks in southern Poland and had become interested in management ideas and
techniques. Some 15 years after Adamiecki , Henry Gantt, an American engineer and
management consultant, devised his own version of the chart and it was this that became widely
known and popular in western countries. Consequently it was Henry Gantt whose name was to
become associated with charts of this type.
Karol Adamiecki Henry Gantt
Originally Gantt charts were prepared laboriously by hand; each time a project changed it was
necessary to amend or redraw the chart and this limited their usefulness, continual change being
a feature of most projects. Nowadays, however, with the advent of computers and project
management software, Gantt charts can be created, updated and printed easily.
Today, Gantt charts are most commonly used for tracking project schedules. For this it is useful
to be able to show additional information about the various tasks or phases of the project, for
example how the tasks relate to each other, how far each task has progressed, what resources are
being used for each task and so on.
Part of a more advanced Gantt chart
 What isa Gantt Chart?
 CreatingGantt Charts
 Gantt Chart Software
 Links
 Articles
 Contact Us
 Sitemap
Creating Gantt Charts
1. Linkingtasks
2. Addingconstraints
3. Includingresources
4. EnhancingGantt Charts
5. Reviewingthe project
Gantt charts are widely used in business to describe and monitor all kinds of projects according
to the rules of project management. In today's world they are usually created by computer
applications, such as Microsoft® Project, Primavera Project Planner® and MindView ™
Business Edition . Here, we refer to such applications as Gantt applications. Different Gantt
applications have different features and capabilities: in the discussion below we describe some of
the more common ones.
The first thing you will need before setting up a Gantt chart is a detailed project plan. A project
plan is a series of interdependent tasks that need to be performed in a particular order. When
moving into a new office for instance, you cannot start redesigning the office space before the
lease agreement has been signed. Project plans have a specific start date, corresponding to the
start of the first task (for instance defining the requirements for the new office), and a specific
end date, corresponding to the end of the last task (for instance moving in).
One way to create a project plan is to use a work breakdown structure, a technique for splitting
tasks into sub-tasks and creating a task hierarchy. Gantt applications will generally allow you to
reflect the project hierarchy in the Gantt's task list at the left of the chart.
Mind mapping software, which encourages creative thinking, will help you to develop a work
breakdown structure and ensure that nothing is omitted from the overall project plan. If the mind
mapping software incorporates Gantt charting (for example MindView Business Edition), it will
allow you to enter data as you develop the plan, saving time later. Make sure your plan is as
complete as possible and its assumptions are realistic.
Once the project plan is complete, enter the data into the Gantt application that will create the
chart:
 Define the projectsettings,suchasitsstart date,enddate andschedulingmode.The most
commonschedulingmode isforwardsfromthe projectstartdate.Inthismode the defaultisfor
tasksto start as soon as possible,whichmeansthatthe whole projectfinishesatthe earliest
possible date.
 Define the projectcalendar.Thissetsthe numberof workingdaysinthe week,the numberof
workinghoursinthe day, andso on.
 Enter or edittasknamesand durations.
 Setup a global resourceslistandassignresourcestotasks.Althoughyoucanoftendefine the
resourcesasyou needthem,itisusuallyquickertostartby settingupa global resourceslist
fromwhichyou can thenselectresourcestoassigntothe variousprojecttasks.See Including
resourcesina Gantt chart.
 Create linkstospecifythe dependenciesbetweenthe projecttasks.See Linkingtasksina Gantt
chart.
 Setconstraintson the tasksas necessary.See Addingconstraintstoa Gantt chart.
 Make final adjustmentstothe projectplan.See EnhancingaGantt chart.
 Once the projecthas actuallystarted,inspectitat regularintervalstodetectpotential problems
or schedulingconflictsandmake anycorrectionsrequired.SeeReviewingaprojectusinga Gantt
chart.
Note:If you used mind mapping software that incorporates Gantt chart creation during the
planning stage, much of this data will already be in place.
With all the data entered, the Gantt application displays the chart. Any change in the timing of a
task affects all the tasks that depend on it. If a task runs ahead of schedule, the Gantt application
automatically recalculates the dates of all the tasks that depend on it in order to take advantage of
the time gained. Conversely, if a task is delayed, all the tasks that depend on it are automatically
rescheduled, which may or may not impact the overall end date of the project.
By using the Gantt display you can build and manage complete project plans in this standard,
well-defined format. You can easily add or remove tasks, set or adjust the duration of tasks
(length of bars), link tasks (for example to make one task follow immediately after another), and
add constraints (for example to specify that a task must end no later than a given date).
To help you get started, some Gantt applications include various ready-made project plans for
common business activities (for example, organizing a tradeshow, producing a publication,
launching a product). You can use these for training purposes, or as a basis for your own project
plans.
Linking tasks in a Gantt chart
Project plans normally require tasks to be performed in a specific order. For instance, a
publication must be written and proofread before it can be printed. To achieve this, the Gantt
application lets you link tasks so that they depend on each other. By default, tasks are usually
linked in a 'Finish to Start' relationship (dependency), which means that the first task you select
(the predecessor task) must end before the next task you select (the successor task) can start, and
so on.
This is typically represented on the Gantt chart by lines with arrowheads joining each task to its
successor. The arrowhead indicates the direction of the link: it goes from the predecessor to the
successor.
A task can have more than one predecessor. In this case its start date is determined by the
predecessor link that gives it the latest start date. As dates and times change during the course of
the project, the predecessor link that determines the start date of the task may also change.
Similarly a task can have several successors. In this case the task determines the start date of all
its successor tasks.
When you are scheduling a project plan from its start date the Gantt application calculates the
end date of the project automatically, on the basis of the task durations, the task dependencies
and the project calendar.
The possibility of linking tasks in this way is what makes project management software
particularly powerful: you can change the duration of one or more tasks, add a task or remove a
task from a chain of linked tasks, and all the dates are recalculated automatically so as to
maintain the task dependencies you have defined.
Other linktypes
There are four possible relationships (dependencies) between tasks:
Finish to Start (FS) - the default: The task cannot start before its predecessor ends, although it
may start later. This is the most common type of relationship, and is described above.
Start to Start (SS): The task cannot start until the predecessor starts, although it may start later.
This can be useful if you have a task whose start date depends on the start date of another task.
Finish to Finish (FF): The task cannot end before the predecessor ends, although it may end
later.
Start to Finish (SF): The task cannot end before the predecessor starts, although it may end
later. This task relationship is rarely used.
Example
The following project plan for the preparation of a publication illustrates all these kinds of
relationships.
In this example:
 The writingtaskfollowsondirectlyfromthe planningtask.If the enddate of planningchanges,
so will the startof writing.Thisisthe normal Finishto Start relationship.
 The editingtaskstarts some waythroughthe writingtask.The writersandthe editorswork
togetherasa teamuntil the textiscomplete.Theirtaskseffectivelyendatthe same time.If the
enddate of writingchanges,sowill the enddate of editing.Thisisa Finishto Finishrelationship.
 The creationof artworkdependsonthe start of writing.Inthiscase a laghas beenintroducedso
that itdoesn'tstart exactlywhenwritingstarts.Evenso,if the start of writingchanges,sowill
the start of artworkcreation.Thisisa Start to Start relationship.
 The final changestaskdependsonthe endof artwork creation,butan overlapisincludedso
that itactuallybeginstwoworkingdaysbefore the enddate of artworkcreation.If artwork
creationisdelayed,sowill be the startof final changes.Thisisthe normal Finishto Start
relationship.
 Printingstartsafterfinal changesare complete.Thisisalsoa Finishto Start relationship.
 The transferringof paperfromthe warehouse tothe printersmustbe complete inorderfor
printingtostart, butis not relatedtoanyof the precedingtasks.The printershave limited
storage capacityand do not wantthe paper to arrive until itisneeded('justintime'orJIT
scheduling), sothe startof printingdrivesthe deliveryof paper.If the startof printingchanges
for some reason,sowill the enddate forgettingpapertothe printers.Thisisa Start to Finish
relationship.
Here each task has a single predecessor, the simplest arrangement. However, a task can have
several predecessors. In such situations you will need to think carefully about possible
undesirable consequences. For example, if you added another predecessor to the "Paper to
printers" task above, it would be possible for that predecessor to push out "Paper to printers" so
that its end date was later than the start of printing.
Usinglagand leadtimes in a Gantt chart
When linking tasks you can add a lead or lag time to extend a link backwards or forwards so that
the successor task starts earlier or later than it otherwise would. For a default 'Finish to Start'
link, this either introduces an overlap (lead time), so that the successor task starts before its
predecessor ends, or it introduces a delay (lag time) that makes the successor task start some time
after its predecessor ends.
When planning the production of a marketing brochure for instance, you could use lead time to
make the creation of artwork start a few days before the writing phase is over. The two tasks are
however still linked, which means that a delay of the writing phase will also delay the creation of
the artwork.
Adding constraints to a Gantt chart
Constraints define the degree of flexibility available to the Gantt application when scheduling or
rescheduling a task by imposing restrictions on its start or end date. The following task constraint
types offer different degrees of flexibility.
Two "constraints" are actually so flexible that they are not generally regarded as constraints at
all:
 As SoonAsPossible (ASAP):Thisisgenerallythe defaultconstraintwhenyouschedule your
projectfromits start date,as isnormallythe case.Youshouldtry to keepthisdefaultwhenever
possible asitgivesthe software the mostschedulingflexibility.If you applythisconstrainttoan
unlinkedtask,the taskwill be scheduledtostartat the projectstart date.If you applyitto a
linkedtask,itwill startassoon as the dependencieswithitspredecessortaskswill allow.
 As Late As Possible (ALAP):Thisis generallythe defaultconstraintwhenyouscheduleyour
projectfromits enddate.If youapplythisconstraintto an unlinkedtask,the taskwill be
scheduledsothatitsenddate coincideswiththe enddate of the overall project.If youapplyit
to a task linkedtoa successortask,the task will be scheduledtoendwhenthe successorneeds
to start. Onthe whole,youshouldavoidthisconstraintasitdoesnot leave anyslacktime to
deal withpossible problems.Anydelayonthe taskis likelytoimpactthe overall enddate.
The following constraints all restrict the Gantt application's flexibility when scheduling tasks.
Although you might be tempted to use them if you are new to project management, you need to
make sure you understand the implications. Keeping their use to a minimum (especially the last
two) will allow you to take full advantage of the automatic scheduling possibilities.
 Start No EarlierThan(SNET):Thismeansthat the task,whetherlinkedornot,maynot start
before the givendate.However,the Ganttapplicationstill hasthe flexibilitytostartthe task
laterthan the givendate.
 Start No LaterThan (SNLT):Thismeansthat the task, whetherlinkedornot,maynot start later
than the givendate.However,the Ganttapplicationstill hasthe flexibilitytostartthe task
earlierthanthe givendate.
 FinishNoEarlierThan(FNET):Thismeansthat the task,whetherlinkedornot,maynot end
before the givendate.However,the Ganttapplicationstill hasthe flexibilitytoendthe tasklater
than the givendate.
 FinishNoLaterThan (FNLT):Thismeansthat the task,whetherlinkedornot,maynot endlater
than the givendate.However,the Ganttapplicationstill hasthe flexibilitytoendthe taskearlier
than the givendate.
 Must Start On (MSO):Thisrigidconstraintmeansthat the task,whetherlinkedornot,muststart
on the givendate.Evenif the precedingtaskiscompletedearlier,the Ganttapplicationcannot
pull inthe constrainedtaskto take advantage of the time gained.
 Must FinishOn(MFO):Thisrigidconstraintmeansthat the task,whetherlinkedornot,must
endon the givendate.Asabove,evenif the precedingtaskiscompletedearlier,the Gantt
applicationcannotpull inthe constrainedtasktotake advantage of the time gained.
If you decide to apply one of these constraints to a task, it is good practice to attach a note or a
comment to the task to explain why you did so. If the constraint causes scheduling conflicts later
on as your project evolves, you will be able to refer to the note to decide whether to keep the
constraint, change it or remove it altogether. Such notes also allow you to distinguish easily
between the tasks you have constrained yourself deliberately and the tasks you may have
constrained inadvertently by moving their task bar or editing their start or end date manually.
The effect of a constraint is not always obvious when you schedule your project plan from its
end date, so take care to check that it does give the result you want.
Example
The following example shows some tasks in the preparation of a brochure for a mail shot. The
mail shot is scheduled for September 10th. The tasks are linked, but we have set a 'Must Finish
On' constraint on the printing task for September 7th, the latest date that will allow the mailing to
go ahead on the following Monday, September 10th. The constraint, as usual, overrides the link.
By setting a 'Must Finish On' constraint for September 7th, we have effectively moved the task
out so that it ends exactly on September 7th, regardless of whether it could have been completed
earlier or not.
The problem with this is that if the printing task takes longer than expected, the mailing date will
be missed. It would be much better to take advantage of the unused time after the end of the
corrections task to get started with printing. However, we still need to keep an eye on the
September 7th deadline. To do this, we remove the constraint from the printing task, so that the
link will determine its start date, and add a deadline marker instead.
Now there is a useful three day gap between the end of printing and the deadline, and the
deadline is clearly indicated. The deadline indicator will warn us if the task moves past its
deadline.
Interactionbetweentask dependencylinksandconstraints
Constraints combine with task dependency links to affect the timing of tasks. In some cases,
applying a constraint to a task, in addition to a task relationship, may create a scheduling
conflict. In most Gantt applications, when such a conflict arises the constraint takes precedence
over the task dependency.
Let us consider the example below. Here the "Print" task is linked to the "Final changes" task
with the default 'Finish to Start' relationship. The "Final changes" task ends on Oct 1st. In normal
circumstances, this would mean that the "Print" task cannot start before Oct 2nd. However,
because you imperatively need the printed materials on Sept 28th for a training session, you have
set a 'Must Finish On' constraint on the "Print" task for Sept 28th, as evidenced by the constraint
indicator. Since the constraint set on a task always overrides any relationship it may have with
other tasks, the start date of the "Print" task has been rescheduled automatically to end on Sept
28th.
In this case the constraint has led to an illogical relationship with the predecessor task: printing is
now scheduled to start before final changes are complete. In this example, the software flags this
as a possible problem using an icon, , which shows that a link has been overridden by a
constraint.
If you later decide to remove the constraint, for instance because the training session has been
postponed, the task dependency link is enforced again, as shown here:
Including resources in a Gantt chart
Many Gantt applications allow you to assign resources to your tasks and project plans. Resources
can be people, materials, equipment, budget amounts, or anything else. Typically, you might
enter the names of people who will work on the tasks as resources.
The Gantt display will indicate the resources that have been assigned to each task. You may also
be able to enter additional information, for example:
 Where the resource isa personor a team, the amountof time that the personor teamwill
spendonthe task. Thisis usuallydesignatedasa percentage,100% signifyingone personfull
time.Soyou wouldenter250% fora teamof three people where one of the people will be
workingonly50% of the time.
 Where the resource isa material,the amountneededforthe task.Fora material suchas sand it
mightbe 50 tons.
 The cost of the resource.Inthe case of a personthiscouldbe a dollarsperhour figure.Fora
material suchas sandit mightbe dollarsperton,for electricitydollarsperkWh.
 The rate of consumptionof amaterial resource.Some resourceshave afixedcostbutfor others
the cost dependsonthe durationof the task.For example,heatingmightbe estimatedinkWh
perday.
Some Gantt applications will adjust the length of each Gantt bar (task duration) according to the
amount of work the people assigned to the task can provide. Overuse of resources may be
flagged, as when a schedule change makes two tasks involving the same team of people overlap.
Enhancing a Gantt chart
Gantt applications generally include features to make your Gantt chart easier to use. These vary
from application to application; here are some examples:
 Addingexplanatorynotestotasks.Thisisespeciallyuseful fortasksthathave constraints.
Constraintsoverride linksandcanleadto illogicalitiesorschedule conflictsinthe plan,soyou
will needtokeepaneye onthem.
 Highlightingthe critical pathinorderto see at a glance the tasksthat are currentlydirectly
affectingyourprojectenddate.Ina projectplan,the critical path correspondstothe tasksor
chainof linkedtasksthatcannotbe delayedwithoutdelayingthe entire project.A task lieson
the critical path if a change toits start date or durationaffectsthe enddate of the project(or
the start date if youare schedulingfromthe endof the project).Keepingaclose eye onthe
statusof yourcritical tasks at any time istherefore keytogoodprojectmanagement.If the
overall projectdurationistoolong,the onlywayto make itshorterand bringinits enddate is to
shortenthe critical path.
 Settingmilestonesordeadlinestomarkkeydates.A milestone isataskwithzeroduration.It
appearson the Gantt chart as milestone symbol.Milestonesare generallyusedtoindicate
importantdatesonthe projectplan,oftenkeyeventsorgoals.Forexample,youmightuse
milestonestomarkdesiredcompletiondates,orprojectreview meetings.
A deadline marker does not affect any of the Gantt calculations, but places a visible marker on
the Gantt chart as a reminder. In most Gantt applications an indicator will warn you if a task
moves past its deadline marker.
 Givingtasks priorities.
 Showingapercentage completionforanytask,visible onthe taskbar.
 Customizingthe appearance of the projectplanonthe Gantt chart, forexample the colorof task
bars, the display(ornot) of informational labels.
Reviewing a project using a Gantt chart
It's a good idea to review your project plan regularly in order to locate conflicts or other
problems. You can then make appropriate changes to remove them.
Here are some questions to ask yourself:
 Is the projecton course?Viewthe enddate of the lasttask onthe Gantt chart. Checkthat it
looksreasonable.
 Has any task overshotitsdeadline?If so,youwill needtotake action:extendorremove the
deadline,allow more time forthe taskorassignmore people toit.
 Are all the linksbetweentasksnecessary?Byunlinkingtasksthatdon'tactuallydependoneach
other,youwill make use of all the slacktime available,therebyshorteningyourscheduleand
maximizingitsflexibility.
 Considerwhethersome taskscouldoverlapeachotherto reduce the overall durationof the
project.If so,assignappropriate leadtimes(see UsinglagandleadtimesinaGantt chart).
Anotherpossibilityistoredefinesome of your'Finish toStart' relationshipstoeither'Finishto
Finish'or'Start to Start' if the logicof yourschedule allowsit.
 Are the constraintsworkingasyou expect?If youhave beenaddinganexplanatorynote to
everyconstraintyouset,readthe notesto checkthat your intentionsare still beingmet.And
lookfortasks that have a constraintbut nonote:these mayhave beencreatedinadvertently
and be causingtrouble.Also,because constraintsgenerallyoverride links,theycanintroduce
schedule conflicts.
 Do the tasks that have constraintsfall where youexpectthemto?Dotheyfitlogicallywiththe
othertasks aroundthem?Checkthat theirstartand enddatesare neithertooearlynortoo late.
 Are there unexpectedoverlapsorgapsbetweenlinkedtasks?Oftenthisiscausedbya rigid
constrainton one or otherof the tasks.However,rememberthatoverlapsandgapscan alsobe
causedby intentional leadorlagtimes.
58
sponsoredads
What isa Gantt Chart? | CreatingGanttCharts | Gantt Chart Software |Links| Articles |Contact Us |
Sitemap
RelatedLinks:Free Ganttchart info · Gantt chart · Gantt chart tips · What isa Gantt chart · Gantt chart
info· BasicGantt Chart · Gantt
© 2012 - 2015 Gantt.com

More Related Content

What's hot

Apps4.Pro Planner Gantt chart (Chrome extension)
Apps4.Pro Planner Gantt chart (Chrome extension)Apps4.Pro Planner Gantt chart (Chrome extension)
Apps4.Pro Planner Gantt chart (Chrome extension)sanbss
 
Software project management tools
Software project management toolsSoftware project management tools
Software project management toolsChethanMp7
 
Ms project management
Ms  project managementMs  project management
Ms project managementchinunki4
 
Gantt template ws Assignment Help
Gantt template ws Assignment HelpGantt template ws Assignment Help
Gantt template ws Assignment HelpGlobal Web Tutors
 
09 gantt charts
09 gantt charts09 gantt charts
09 gantt chartsmike
 
Benchmarking and Gantt chart
Benchmarking and Gantt chartBenchmarking and Gantt chart
Benchmarking and Gantt chartAbhijeet Malkar
 
Project Management Through Gantt & Pert Chart
Project Management Through Gantt & Pert ChartProject Management Through Gantt & Pert Chart
Project Management Through Gantt & Pert ChartVinay Prajapati
 
Mba ii pmom_unit-4.3 scheduling-gantt chart a
Mba ii pmom_unit-4.3 scheduling-gantt chart aMba ii pmom_unit-4.3 scheduling-gantt chart a
Mba ii pmom_unit-4.3 scheduling-gantt chart aRai University
 
The gantt Chart
The gantt Chart The gantt Chart
The gantt Chart Nicola2903
 
Gantt Chart Templates by Creately
Gantt Chart Templates by CreatelyGantt Chart Templates by Creately
Gantt Chart Templates by CreatelyCreately
 

What's hot (20)

Gantt chart discuss 2
Gantt chart discuss 2Gantt chart discuss 2
Gantt chart discuss 2
 
Apps4.Pro Planner Gantt chart (Chrome extension)
Apps4.Pro Planner Gantt chart (Chrome extension)Apps4.Pro Planner Gantt chart (Chrome extension)
Apps4.Pro Planner Gantt chart (Chrome extension)
 
Gantt
GanttGantt
Gantt
 
Software project management tools
Software project management toolsSoftware project management tools
Software project management tools
 
Pert and gantt chart
Pert and gantt chartPert and gantt chart
Pert and gantt chart
 
Gantt chart & pert chart
Gantt chart & pert chartGantt chart & pert chart
Gantt chart & pert chart
 
Ms project management
Ms  project managementMs  project management
Ms project management
 
Gantt template ws Assignment Help
Gantt template ws Assignment HelpGantt template ws Assignment Help
Gantt template ws Assignment Help
 
Introduction, development and analysis of banana curve in project management....
Introduction, development and analysis of banana curve in project management....Introduction, development and analysis of banana curve in project management....
Introduction, development and analysis of banana curve in project management....
 
09 gantt charts
09 gantt charts09 gantt charts
09 gantt charts
 
Gantt chart
Gantt chartGantt chart
Gantt chart
 
Benchmarking and Gantt chart
Benchmarking and Gantt chartBenchmarking and Gantt chart
Benchmarking and Gantt chart
 
Project Management Through Gantt & Pert Chart
Project Management Through Gantt & Pert ChartProject Management Through Gantt & Pert Chart
Project Management Through Gantt & Pert Chart
 
Mba ii pmom_unit-4.3 scheduling-gantt chart a
Mba ii pmom_unit-4.3 scheduling-gantt chart aMba ii pmom_unit-4.3 scheduling-gantt chart a
Mba ii pmom_unit-4.3 scheduling-gantt chart a
 
Gantt chart
Gantt chartGantt chart
Gantt chart
 
The gantt Chart
The gantt Chart The gantt Chart
The gantt Chart
 
Gantt and PERT chart
Gantt and PERT chartGantt and PERT chart
Gantt and PERT chart
 
Gantt pert
Gantt pertGantt pert
Gantt pert
 
Gantt Chart Templates by Creately
Gantt Chart Templates by CreatelyGantt Chart Templates by Creately
Gantt Chart Templates by Creately
 
MS Project
MS Project MS Project
MS Project
 

Similar to What is a Gantt Chart? (38

Events Planning - Midterm 2 quiz.docx
Events Planning - Midterm 2 quiz.docxEvents Planning - Midterm 2 quiz.docx
Events Planning - Midterm 2 quiz.docxMIkeBryanjoaquin
 
Gantt Charts and PERT# Charts: Different But Not So Different
Gantt Charts and PERT# Charts: Different But Not So DifferentGantt Charts and PERT# Charts: Different But Not So Different
Gantt Charts and PERT# Charts: Different But Not So DifferentAnkitGrewal14
 
WBS Gantt chart and project management for Jira users
WBS Gantt chart and project management for Jira usersWBS Gantt chart and project management for Jira users
WBS Gantt chart and project management for Jira usersTam Nguyen, PMP, CSM
 
GANTT CHART nursing Management for Msc nursing
GANTT CHART nursing Management for Msc nursingGANTT CHART nursing Management for Msc nursing
GANTT CHART nursing Management for Msc nursingThangamjayarani
 
An Introduction to Gantt Charts
An Introduction to Gantt Charts An Introduction to Gantt Charts
An Introduction to Gantt Charts Litunya Laurean
 
Are Gantt charts your worst nightmares well, not anymore!
Are Gantt charts your worst nightmares well, not anymore!Are Gantt charts your worst nightmares well, not anymore!
Are Gantt charts your worst nightmares well, not anymore!Wilsonlarasuper
 
Modelingprogramstructure
ModelingprogramstructureModelingprogramstructure
Modelingprogramstructurelearnt
 
Project control tools by Samuel obino mokaya
Project control tools by Samuel obino mokayaProject control tools by Samuel obino mokaya
Project control tools by Samuel obino mokayaDiscover JKUAT
 
Choosing the Right Visualization Tool- Gantt Chart vs. Timeline - Slideshare....
Choosing the Right Visualization Tool- Gantt Chart vs. Timeline - Slideshare....Choosing the Right Visualization Tool- Gantt Chart vs. Timeline - Slideshare....
Choosing the Right Visualization Tool- Gantt Chart vs. Timeline - Slideshare....Yoroflow
 
TID Chapter 6 Introduction To Microsoft Project
TID Chapter 6 Introduction To Microsoft ProjectTID Chapter 6 Introduction To Microsoft Project
TID Chapter 6 Introduction To Microsoft ProjectWanBK Leo
 
Construction Project Schedule Template- Residential Building
Construction Project Schedule Template- Residential BuildingConstruction Project Schedule Template- Residential Building
Construction Project Schedule Template- Residential BuildingSHAZEBALIKHAN1
 
44259126 ms-project-presentation
44259126 ms-project-presentation44259126 ms-project-presentation
44259126 ms-project-presentationFarrukh Raja
 
Lab 2 create a gantt chart and pert chart using ms project
Lab 2 create a gantt chart and pert chart using ms projectLab 2 create a gantt chart and pert chart using ms project
Lab 2 create a gantt chart and pert chart using ms projectFarah Ahmed
 
Ms project presentation
Ms project presentationMs project presentation
Ms project presentationKhem Singh
 
Scrum With Ms Project
Scrum With Ms ProjectScrum With Ms Project
Scrum With Ms Projectbobby
 
dokumen.tips_ms-project-presentation.pptx
dokumen.tips_ms-project-presentation.pptxdokumen.tips_ms-project-presentation.pptx
dokumen.tips_ms-project-presentation.pptxSunilHotkar2
 
ms-project-presentation.pptx
ms-project-presentation.pptxms-project-presentation.pptx
ms-project-presentation.pptxSunilHotkar2
 
MS Project Presentation
MS Project PresentationMS Project Presentation
MS Project PresentationKhem Singh
 

Similar to What is a Gantt Chart? (38 (20)

Events Planning - Midterm 2 quiz.docx
Events Planning - Midterm 2 quiz.docxEvents Planning - Midterm 2 quiz.docx
Events Planning - Midterm 2 quiz.docx
 
What is a Gantt chart
What is a Gantt chartWhat is a Gantt chart
What is a Gantt chart
 
Gantt Charts and PERT# Charts: Different But Not So Different
Gantt Charts and PERT# Charts: Different But Not So DifferentGantt Charts and PERT# Charts: Different But Not So Different
Gantt Charts and PERT# Charts: Different But Not So Different
 
WBS Gantt chart and project management for Jira users
WBS Gantt chart and project management for Jira usersWBS Gantt chart and project management for Jira users
WBS Gantt chart and project management for Jira users
 
GANTT CHART nursing Management for Msc nursing
GANTT CHART nursing Management for Msc nursingGANTT CHART nursing Management for Msc nursing
GANTT CHART nursing Management for Msc nursing
 
An Introduction to Gantt Charts
An Introduction to Gantt Charts An Introduction to Gantt Charts
An Introduction to Gantt Charts
 
Are Gantt charts your worst nightmares well, not anymore!
Are Gantt charts your worst nightmares well, not anymore!Are Gantt charts your worst nightmares well, not anymore!
Are Gantt charts your worst nightmares well, not anymore!
 
Modelingprogramstructure
ModelingprogramstructureModelingprogramstructure
Modelingprogramstructure
 
Project control tools by Samuel obino mokaya
Project control tools by Samuel obino mokayaProject control tools by Samuel obino mokaya
Project control tools by Samuel obino mokaya
 
Choosing the Right Visualization Tool- Gantt Chart vs. Timeline - Slideshare....
Choosing the Right Visualization Tool- Gantt Chart vs. Timeline - Slideshare....Choosing the Right Visualization Tool- Gantt Chart vs. Timeline - Slideshare....
Choosing the Right Visualization Tool- Gantt Chart vs. Timeline - Slideshare....
 
TID Chapter 6 Introduction To Microsoft Project
TID Chapter 6 Introduction To Microsoft ProjectTID Chapter 6 Introduction To Microsoft Project
TID Chapter 6 Introduction To Microsoft Project
 
Construction Project Schedule Template- Residential Building
Construction Project Schedule Template- Residential BuildingConstruction Project Schedule Template- Residential Building
Construction Project Schedule Template- Residential Building
 
44259126 ms-project-presentation
44259126 ms-project-presentation44259126 ms-project-presentation
44259126 ms-project-presentation
 
Unit II.pptx
Unit II.pptxUnit II.pptx
Unit II.pptx
 
Lab 2 create a gantt chart and pert chart using ms project
Lab 2 create a gantt chart and pert chart using ms projectLab 2 create a gantt chart and pert chart using ms project
Lab 2 create a gantt chart and pert chart using ms project
 
Ms project presentation
Ms project presentationMs project presentation
Ms project presentation
 
Scrum With Ms Project
Scrum With Ms ProjectScrum With Ms Project
Scrum With Ms Project
 
dokumen.tips_ms-project-presentation.pptx
dokumen.tips_ms-project-presentation.pptxdokumen.tips_ms-project-presentation.pptx
dokumen.tips_ms-project-presentation.pptx
 
ms-project-presentation.pptx
ms-project-presentation.pptxms-project-presentation.pptx
ms-project-presentation.pptx
 
MS Project Presentation
MS Project PresentationMS Project Presentation
MS Project Presentation
 

Recently uploaded

Sanyam Choudhary Chemistry practical.pdf
Sanyam Choudhary Chemistry practical.pdfSanyam Choudhary Chemistry practical.pdf
Sanyam Choudhary Chemistry practical.pdfsanyamsingh5019
 
Interactive Powerpoint_How to Master effective communication
Interactive Powerpoint_How to Master effective communicationInteractive Powerpoint_How to Master effective communication
Interactive Powerpoint_How to Master effective communicationnomboosow
 
URLs and Routing in the Odoo 17 Website App
URLs and Routing in the Odoo 17 Website AppURLs and Routing in the Odoo 17 Website App
URLs and Routing in the Odoo 17 Website AppCeline George
 
Mastering the Unannounced Regulatory Inspection
Mastering the Unannounced Regulatory InspectionMastering the Unannounced Regulatory Inspection
Mastering the Unannounced Regulatory InspectionSafetyChain Software
 
Privatization and Disinvestment - Meaning, Objectives, Advantages and Disadva...
Privatization and Disinvestment - Meaning, Objectives, Advantages and Disadva...Privatization and Disinvestment - Meaning, Objectives, Advantages and Disadva...
Privatization and Disinvestment - Meaning, Objectives, Advantages and Disadva...RKavithamani
 
Accessible design: Minimum effort, maximum impact
Accessible design: Minimum effort, maximum impactAccessible design: Minimum effort, maximum impact
Accessible design: Minimum effort, maximum impactdawncurless
 
Arihant handbook biology for class 11 .pdf
Arihant handbook biology for class 11 .pdfArihant handbook biology for class 11 .pdf
Arihant handbook biology for class 11 .pdfchloefrazer622
 
“Oh GOSH! Reflecting on Hackteria's Collaborative Practices in a Global Do-It...
“Oh GOSH! Reflecting on Hackteria's Collaborative Practices in a Global Do-It...“Oh GOSH! Reflecting on Hackteria's Collaborative Practices in a Global Do-It...
“Oh GOSH! Reflecting on Hackteria's Collaborative Practices in a Global Do-It...Marc Dusseiller Dusjagr
 
Introduction to ArtificiaI Intelligence in Higher Education
Introduction to ArtificiaI Intelligence in Higher EducationIntroduction to ArtificiaI Intelligence in Higher Education
Introduction to ArtificiaI Intelligence in Higher Educationpboyjonauth
 
The basics of sentences session 2pptx copy.pptx
The basics of sentences session 2pptx copy.pptxThe basics of sentences session 2pptx copy.pptx
The basics of sentences session 2pptx copy.pptxheathfieldcps1
 
Kisan Call Centre - To harness potential of ICT in Agriculture by answer farm...
Kisan Call Centre - To harness potential of ICT in Agriculture by answer farm...Kisan Call Centre - To harness potential of ICT in Agriculture by answer farm...
Kisan Call Centre - To harness potential of ICT in Agriculture by answer farm...Krashi Coaching
 
Separation of Lanthanides/ Lanthanides and Actinides
Separation of Lanthanides/ Lanthanides and ActinidesSeparation of Lanthanides/ Lanthanides and Actinides
Separation of Lanthanides/ Lanthanides and ActinidesFatimaKhan178732
 
Call Girls in Dwarka Mor Delhi Contact Us 9654467111
Call Girls in Dwarka Mor Delhi Contact Us 9654467111Call Girls in Dwarka Mor Delhi Contact Us 9654467111
Call Girls in Dwarka Mor Delhi Contact Us 9654467111Sapana Sha
 
Employee wellbeing at the workplace.pptx
Employee wellbeing at the workplace.pptxEmployee wellbeing at the workplace.pptx
Employee wellbeing at the workplace.pptxNirmalaLoungPoorunde1
 
BASLIQ CURRENT LOOKBOOK LOOKBOOK(1) (1).pdf
BASLIQ CURRENT LOOKBOOK  LOOKBOOK(1) (1).pdfBASLIQ CURRENT LOOKBOOK  LOOKBOOK(1) (1).pdf
BASLIQ CURRENT LOOKBOOK LOOKBOOK(1) (1).pdfSoniaTolstoy
 
1029-Danh muc Sach Giao Khoa khoi 6.pdf
1029-Danh muc Sach Giao Khoa khoi  6.pdf1029-Danh muc Sach Giao Khoa khoi  6.pdf
1029-Danh muc Sach Giao Khoa khoi 6.pdfQucHHunhnh
 

Recently uploaded (20)

TataKelola dan KamSiber Kecerdasan Buatan v022.pdf
TataKelola dan KamSiber Kecerdasan Buatan v022.pdfTataKelola dan KamSiber Kecerdasan Buatan v022.pdf
TataKelola dan KamSiber Kecerdasan Buatan v022.pdf
 
Sanyam Choudhary Chemistry practical.pdf
Sanyam Choudhary Chemistry practical.pdfSanyam Choudhary Chemistry practical.pdf
Sanyam Choudhary Chemistry practical.pdf
 
Interactive Powerpoint_How to Master effective communication
Interactive Powerpoint_How to Master effective communicationInteractive Powerpoint_How to Master effective communication
Interactive Powerpoint_How to Master effective communication
 
URLs and Routing in the Odoo 17 Website App
URLs and Routing in the Odoo 17 Website AppURLs and Routing in the Odoo 17 Website App
URLs and Routing in the Odoo 17 Website App
 
Mastering the Unannounced Regulatory Inspection
Mastering the Unannounced Regulatory InspectionMastering the Unannounced Regulatory Inspection
Mastering the Unannounced Regulatory Inspection
 
Privatization and Disinvestment - Meaning, Objectives, Advantages and Disadva...
Privatization and Disinvestment - Meaning, Objectives, Advantages and Disadva...Privatization and Disinvestment - Meaning, Objectives, Advantages and Disadva...
Privatization and Disinvestment - Meaning, Objectives, Advantages and Disadva...
 
Accessible design: Minimum effort, maximum impact
Accessible design: Minimum effort, maximum impactAccessible design: Minimum effort, maximum impact
Accessible design: Minimum effort, maximum impact
 
Arihant handbook biology for class 11 .pdf
Arihant handbook biology for class 11 .pdfArihant handbook biology for class 11 .pdf
Arihant handbook biology for class 11 .pdf
 
“Oh GOSH! Reflecting on Hackteria's Collaborative Practices in a Global Do-It...
“Oh GOSH! Reflecting on Hackteria's Collaborative Practices in a Global Do-It...“Oh GOSH! Reflecting on Hackteria's Collaborative Practices in a Global Do-It...
“Oh GOSH! Reflecting on Hackteria's Collaborative Practices in a Global Do-It...
 
Introduction to ArtificiaI Intelligence in Higher Education
Introduction to ArtificiaI Intelligence in Higher EducationIntroduction to ArtificiaI Intelligence in Higher Education
Introduction to ArtificiaI Intelligence in Higher Education
 
Código Creativo y Arte de Software | Unidad 1
Código Creativo y Arte de Software | Unidad 1Código Creativo y Arte de Software | Unidad 1
Código Creativo y Arte de Software | Unidad 1
 
The basics of sentences session 2pptx copy.pptx
The basics of sentences session 2pptx copy.pptxThe basics of sentences session 2pptx copy.pptx
The basics of sentences session 2pptx copy.pptx
 
Kisan Call Centre - To harness potential of ICT in Agriculture by answer farm...
Kisan Call Centre - To harness potential of ICT in Agriculture by answer farm...Kisan Call Centre - To harness potential of ICT in Agriculture by answer farm...
Kisan Call Centre - To harness potential of ICT in Agriculture by answer farm...
 
Separation of Lanthanides/ Lanthanides and Actinides
Separation of Lanthanides/ Lanthanides and ActinidesSeparation of Lanthanides/ Lanthanides and Actinides
Separation of Lanthanides/ Lanthanides and Actinides
 
Call Girls in Dwarka Mor Delhi Contact Us 9654467111
Call Girls in Dwarka Mor Delhi Contact Us 9654467111Call Girls in Dwarka Mor Delhi Contact Us 9654467111
Call Girls in Dwarka Mor Delhi Contact Us 9654467111
 
Employee wellbeing at the workplace.pptx
Employee wellbeing at the workplace.pptxEmployee wellbeing at the workplace.pptx
Employee wellbeing at the workplace.pptx
 
BASLIQ CURRENT LOOKBOOK LOOKBOOK(1) (1).pdf
BASLIQ CURRENT LOOKBOOK  LOOKBOOK(1) (1).pdfBASLIQ CURRENT LOOKBOOK  LOOKBOOK(1) (1).pdf
BASLIQ CURRENT LOOKBOOK LOOKBOOK(1) (1).pdf
 
Mattingly "AI & Prompt Design: Structured Data, Assistants, & RAG"
Mattingly "AI & Prompt Design: Structured Data, Assistants, & RAG"Mattingly "AI & Prompt Design: Structured Data, Assistants, & RAG"
Mattingly "AI & Prompt Design: Structured Data, Assistants, & RAG"
 
INDIA QUIZ 2024 RLAC DELHI UNIVERSITY.pptx
INDIA QUIZ 2024 RLAC DELHI UNIVERSITY.pptxINDIA QUIZ 2024 RLAC DELHI UNIVERSITY.pptx
INDIA QUIZ 2024 RLAC DELHI UNIVERSITY.pptx
 
1029-Danh muc Sach Giao Khoa khoi 6.pdf
1029-Danh muc Sach Giao Khoa khoi  6.pdf1029-Danh muc Sach Giao Khoa khoi  6.pdf
1029-Danh muc Sach Giao Khoa khoi 6.pdf
 

What is a Gantt Chart? (38

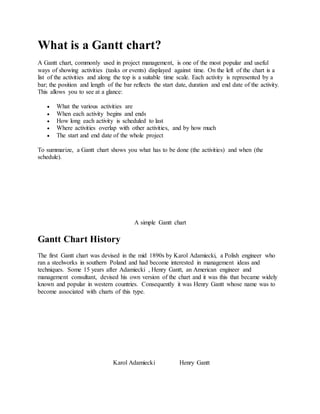
  • 1. What is a Gantt chart? A Gantt chart, commonly used in project management, is one of the most popular and useful ways of showing activities (tasks or events) displayed against time. On the left of the chart is a list of the activities and along the top is a suitable time scale. Each activity is represented by a bar; the position and length of the bar reflects the start date, duration and end date of the activity. This allows you to see at a glance:  What the various activities are  When each activity begins and ends  How long each activity is scheduled to last  Where activities overlap with other activities, and by how much  The start and end date of the whole project To summarize, a Gantt chart shows you what has to be done (the activities) and when (the schedule). A simple Gantt chart Gantt Chart History The first Gantt chart was devised in the mid 1890s by Karol Adamiecki, a Polish engineer who ran a steelworks in southern Poland and had become interested in management ideas and techniques. Some 15 years after Adamiecki , Henry Gantt, an American engineer and management consultant, devised his own version of the chart and it was this that became widely known and popular in western countries. Consequently it was Henry Gantt whose name was to become associated with charts of this type. Karol Adamiecki Henry Gantt
  • 2. Originally Gantt charts were prepared laboriously by hand; each time a project changed it was necessary to amend or redraw the chart and this limited their usefulness, continual change being a feature of most projects. Nowadays, however, with the advent of computers and project management software, Gantt charts can be created, updated and printed easily. Today, Gantt charts are most commonly used for tracking project schedules. For this it is useful to be able to show additional information about the various tasks or phases of the project, for example how the tasks relate to each other, how far each task has progressed, what resources are being used for each task and so on. Part of a more advanced Gantt chart  What isa Gantt Chart?  CreatingGantt Charts  Gantt Chart Software  Links
  • 3.  Articles  Contact Us  Sitemap Creating Gantt Charts 1. Linkingtasks 2. Addingconstraints 3. Includingresources 4. EnhancingGantt Charts 5. Reviewingthe project Gantt charts are widely used in business to describe and monitor all kinds of projects according to the rules of project management. In today's world they are usually created by computer applications, such as Microsoft® Project, Primavera Project Planner® and MindView ™ Business Edition . Here, we refer to such applications as Gantt applications. Different Gantt applications have different features and capabilities: in the discussion below we describe some of the more common ones. The first thing you will need before setting up a Gantt chart is a detailed project plan. A project plan is a series of interdependent tasks that need to be performed in a particular order. When moving into a new office for instance, you cannot start redesigning the office space before the lease agreement has been signed. Project plans have a specific start date, corresponding to the start of the first task (for instance defining the requirements for the new office), and a specific end date, corresponding to the end of the last task (for instance moving in). One way to create a project plan is to use a work breakdown structure, a technique for splitting tasks into sub-tasks and creating a task hierarchy. Gantt applications will generally allow you to reflect the project hierarchy in the Gantt's task list at the left of the chart. Mind mapping software, which encourages creative thinking, will help you to develop a work breakdown structure and ensure that nothing is omitted from the overall project plan. If the mind mapping software incorporates Gantt charting (for example MindView Business Edition), it will
  • 4. allow you to enter data as you develop the plan, saving time later. Make sure your plan is as complete as possible and its assumptions are realistic. Once the project plan is complete, enter the data into the Gantt application that will create the chart:  Define the projectsettings,suchasitsstart date,enddate andschedulingmode.The most commonschedulingmode isforwardsfromthe projectstartdate.Inthismode the defaultisfor tasksto start as soon as possible,whichmeansthatthe whole projectfinishesatthe earliest possible date.  Define the projectcalendar.Thissetsthe numberof workingdaysinthe week,the numberof workinghoursinthe day, andso on.  Enter or edittasknamesand durations.  Setup a global resourceslistandassignresourcestotasks.Althoughyoucanoftendefine the resourcesasyou needthem,itisusuallyquickertostartby settingupa global resourceslist fromwhichyou can thenselectresourcestoassigntothe variousprojecttasks.See Including resourcesina Gantt chart.  Create linkstospecifythe dependenciesbetweenthe projecttasks.See Linkingtasksina Gantt chart.  Setconstraintson the tasksas necessary.See Addingconstraintstoa Gantt chart.  Make final adjustmentstothe projectplan.See EnhancingaGantt chart.  Once the projecthas actuallystarted,inspectitat regularintervalstodetectpotential problems or schedulingconflictsandmake anycorrectionsrequired.SeeReviewingaprojectusinga Gantt chart. Note:If you used mind mapping software that incorporates Gantt chart creation during the planning stage, much of this data will already be in place. With all the data entered, the Gantt application displays the chart. Any change in the timing of a task affects all the tasks that depend on it. If a task runs ahead of schedule, the Gantt application automatically recalculates the dates of all the tasks that depend on it in order to take advantage of the time gained. Conversely, if a task is delayed, all the tasks that depend on it are automatically rescheduled, which may or may not impact the overall end date of the project. By using the Gantt display you can build and manage complete project plans in this standard, well-defined format. You can easily add or remove tasks, set or adjust the duration of tasks (length of bars), link tasks (for example to make one task follow immediately after another), and add constraints (for example to specify that a task must end no later than a given date). To help you get started, some Gantt applications include various ready-made project plans for common business activities (for example, organizing a tradeshow, producing a publication, launching a product). You can use these for training purposes, or as a basis for your own project plans.
  • 5. Linking tasks in a Gantt chart Project plans normally require tasks to be performed in a specific order. For instance, a publication must be written and proofread before it can be printed. To achieve this, the Gantt application lets you link tasks so that they depend on each other. By default, tasks are usually linked in a 'Finish to Start' relationship (dependency), which means that the first task you select (the predecessor task) must end before the next task you select (the successor task) can start, and so on. This is typically represented on the Gantt chart by lines with arrowheads joining each task to its successor. The arrowhead indicates the direction of the link: it goes from the predecessor to the successor. A task can have more than one predecessor. In this case its start date is determined by the predecessor link that gives it the latest start date. As dates and times change during the course of the project, the predecessor link that determines the start date of the task may also change. Similarly a task can have several successors. In this case the task determines the start date of all its successor tasks. When you are scheduling a project plan from its start date the Gantt application calculates the end date of the project automatically, on the basis of the task durations, the task dependencies and the project calendar. The possibility of linking tasks in this way is what makes project management software particularly powerful: you can change the duration of one or more tasks, add a task or remove a task from a chain of linked tasks, and all the dates are recalculated automatically so as to maintain the task dependencies you have defined. Other linktypes There are four possible relationships (dependencies) between tasks:
  • 6. Finish to Start (FS) - the default: The task cannot start before its predecessor ends, although it may start later. This is the most common type of relationship, and is described above. Start to Start (SS): The task cannot start until the predecessor starts, although it may start later. This can be useful if you have a task whose start date depends on the start date of another task. Finish to Finish (FF): The task cannot end before the predecessor ends, although it may end later. Start to Finish (SF): The task cannot end before the predecessor starts, although it may end later. This task relationship is rarely used. Example The following project plan for the preparation of a publication illustrates all these kinds of relationships. In this example:  The writingtaskfollowsondirectlyfromthe planningtask.If the enddate of planningchanges, so will the startof writing.Thisisthe normal Finishto Start relationship.  The editingtaskstarts some waythroughthe writingtask.The writersandthe editorswork togetherasa teamuntil the textiscomplete.Theirtaskseffectivelyendatthe same time.If the enddate of writingchanges,sowill the enddate of editing.Thisisa Finishto Finishrelationship.  The creationof artworkdependsonthe start of writing.Inthiscase a laghas beenintroducedso that itdoesn'tstart exactlywhenwritingstarts.Evenso,if the start of writingchanges,sowill the start of artworkcreation.Thisisa Start to Start relationship.  The final changestaskdependsonthe endof artwork creation,butan overlapisincludedso that itactuallybeginstwoworkingdaysbefore the enddate of artworkcreation.If artwork creationisdelayed,sowill be the startof final changes.Thisisthe normal Finishto Start relationship.  Printingstartsafterfinal changesare complete.Thisisalsoa Finishto Start relationship.  The transferringof paperfromthe warehouse tothe printersmustbe complete inorderfor printingtostart, butis not relatedtoanyof the precedingtasks.The printershave limited storage capacityand do not wantthe paper to arrive until itisneeded('justintime'orJIT scheduling), sothe startof printingdrivesthe deliveryof paper.If the startof printingchanges
  • 7. for some reason,sowill the enddate forgettingpapertothe printers.Thisisa Start to Finish relationship. Here each task has a single predecessor, the simplest arrangement. However, a task can have several predecessors. In such situations you will need to think carefully about possible undesirable consequences. For example, if you added another predecessor to the "Paper to printers" task above, it would be possible for that predecessor to push out "Paper to printers" so that its end date was later than the start of printing. Usinglagand leadtimes in a Gantt chart When linking tasks you can add a lead or lag time to extend a link backwards or forwards so that the successor task starts earlier or later than it otherwise would. For a default 'Finish to Start' link, this either introduces an overlap (lead time), so that the successor task starts before its predecessor ends, or it introduces a delay (lag time) that makes the successor task start some time after its predecessor ends. When planning the production of a marketing brochure for instance, you could use lead time to make the creation of artwork start a few days before the writing phase is over. The two tasks are however still linked, which means that a delay of the writing phase will also delay the creation of the artwork. Adding constraints to a Gantt chart Constraints define the degree of flexibility available to the Gantt application when scheduling or rescheduling a task by imposing restrictions on its start or end date. The following task constraint types offer different degrees of flexibility. Two "constraints" are actually so flexible that they are not generally regarded as constraints at all:  As SoonAsPossible (ASAP):Thisisgenerallythe defaultconstraintwhenyouschedule your projectfromits start date,as isnormallythe case.Youshouldtry to keepthisdefaultwhenever possible asitgivesthe software the mostschedulingflexibility.If you applythisconstrainttoan unlinkedtask,the taskwill be scheduledtostartat the projectstart date.If you applyitto a linkedtask,itwill startassoon as the dependencieswithitspredecessortaskswill allow.  As Late As Possible (ALAP):Thisis generallythe defaultconstraintwhenyouscheduleyour projectfromits enddate.If youapplythisconstraintto an unlinkedtask,the taskwill be scheduledsothatitsenddate coincideswiththe enddate of the overall project.If youapplyit to a task linkedtoa successortask,the task will be scheduledtoendwhenthe successorneeds to start. Onthe whole,youshouldavoidthisconstraintasitdoesnot leave anyslacktime to deal withpossible problems.Anydelayonthe taskis likelytoimpactthe overall enddate.
  • 8. The following constraints all restrict the Gantt application's flexibility when scheduling tasks. Although you might be tempted to use them if you are new to project management, you need to make sure you understand the implications. Keeping their use to a minimum (especially the last two) will allow you to take full advantage of the automatic scheduling possibilities.  Start No EarlierThan(SNET):Thismeansthat the task,whetherlinkedornot,maynot start before the givendate.However,the Ganttapplicationstill hasthe flexibilitytostartthe task laterthan the givendate.  Start No LaterThan (SNLT):Thismeansthat the task, whetherlinkedornot,maynot start later than the givendate.However,the Ganttapplicationstill hasthe flexibilitytostartthe task earlierthanthe givendate.  FinishNoEarlierThan(FNET):Thismeansthat the task,whetherlinkedornot,maynot end before the givendate.However,the Ganttapplicationstill hasthe flexibilitytoendthe tasklater than the givendate.  FinishNoLaterThan (FNLT):Thismeansthat the task,whetherlinkedornot,maynot endlater than the givendate.However,the Ganttapplicationstill hasthe flexibilitytoendthe taskearlier than the givendate.  Must Start On (MSO):Thisrigidconstraintmeansthat the task,whetherlinkedornot,muststart on the givendate.Evenif the precedingtaskiscompletedearlier,the Ganttapplicationcannot pull inthe constrainedtaskto take advantage of the time gained.  Must FinishOn(MFO):Thisrigidconstraintmeansthat the task,whetherlinkedornot,must endon the givendate.Asabove,evenif the precedingtaskiscompletedearlier,the Gantt applicationcannotpull inthe constrainedtasktotake advantage of the time gained. If you decide to apply one of these constraints to a task, it is good practice to attach a note or a comment to the task to explain why you did so. If the constraint causes scheduling conflicts later on as your project evolves, you will be able to refer to the note to decide whether to keep the constraint, change it or remove it altogether. Such notes also allow you to distinguish easily between the tasks you have constrained yourself deliberately and the tasks you may have constrained inadvertently by moving their task bar or editing their start or end date manually. The effect of a constraint is not always obvious when you schedule your project plan from its end date, so take care to check that it does give the result you want. Example The following example shows some tasks in the preparation of a brochure for a mail shot. The mail shot is scheduled for September 10th. The tasks are linked, but we have set a 'Must Finish On' constraint on the printing task for September 7th, the latest date that will allow the mailing to go ahead on the following Monday, September 10th. The constraint, as usual, overrides the link. By setting a 'Must Finish On' constraint for September 7th, we have effectively moved the task out so that it ends exactly on September 7th, regardless of whether it could have been completed earlier or not.
  • 9. The problem with this is that if the printing task takes longer than expected, the mailing date will be missed. It would be much better to take advantage of the unused time after the end of the corrections task to get started with printing. However, we still need to keep an eye on the September 7th deadline. To do this, we remove the constraint from the printing task, so that the link will determine its start date, and add a deadline marker instead. Now there is a useful three day gap between the end of printing and the deadline, and the deadline is clearly indicated. The deadline indicator will warn us if the task moves past its deadline. Interactionbetweentask dependencylinksandconstraints Constraints combine with task dependency links to affect the timing of tasks. In some cases, applying a constraint to a task, in addition to a task relationship, may create a scheduling conflict. In most Gantt applications, when such a conflict arises the constraint takes precedence over the task dependency. Let us consider the example below. Here the "Print" task is linked to the "Final changes" task with the default 'Finish to Start' relationship. The "Final changes" task ends on Oct 1st. In normal circumstances, this would mean that the "Print" task cannot start before Oct 2nd. However, because you imperatively need the printed materials on Sept 28th for a training session, you have set a 'Must Finish On' constraint on the "Print" task for Sept 28th, as evidenced by the constraint indicator. Since the constraint set on a task always overrides any relationship it may have with other tasks, the start date of the "Print" task has been rescheduled automatically to end on Sept 28th.
  • 10. In this case the constraint has led to an illogical relationship with the predecessor task: printing is now scheduled to start before final changes are complete. In this example, the software flags this as a possible problem using an icon, , which shows that a link has been overridden by a constraint. If you later decide to remove the constraint, for instance because the training session has been postponed, the task dependency link is enforced again, as shown here: Including resources in a Gantt chart Many Gantt applications allow you to assign resources to your tasks and project plans. Resources can be people, materials, equipment, budget amounts, or anything else. Typically, you might enter the names of people who will work on the tasks as resources. The Gantt display will indicate the resources that have been assigned to each task. You may also be able to enter additional information, for example:  Where the resource isa personor a team, the amountof time that the personor teamwill spendonthe task. Thisis usuallydesignatedasa percentage,100% signifyingone personfull time.Soyou wouldenter250% fora teamof three people where one of the people will be workingonly50% of the time.  Where the resource isa material,the amountneededforthe task.Fora material suchas sand it mightbe 50 tons.  The cost of the resource.Inthe case of a personthiscouldbe a dollarsperhour figure.Fora material suchas sandit mightbe dollarsperton,for electricitydollarsperkWh.  The rate of consumptionof amaterial resource.Some resourceshave afixedcostbutfor others the cost dependsonthe durationof the task.For example,heatingmightbe estimatedinkWh perday. Some Gantt applications will adjust the length of each Gantt bar (task duration) according to the amount of work the people assigned to the task can provide. Overuse of resources may be flagged, as when a schedule change makes two tasks involving the same team of people overlap.
  • 11. Enhancing a Gantt chart Gantt applications generally include features to make your Gantt chart easier to use. These vary from application to application; here are some examples:  Addingexplanatorynotestotasks.Thisisespeciallyuseful fortasksthathave constraints. Constraintsoverride linksandcanleadto illogicalitiesorschedule conflictsinthe plan,soyou will needtokeepaneye onthem.  Highlightingthe critical pathinorderto see at a glance the tasksthat are currentlydirectly affectingyourprojectenddate.Ina projectplan,the critical path correspondstothe tasksor chainof linkedtasksthatcannotbe delayedwithoutdelayingthe entire project.A task lieson the critical path if a change toits start date or durationaffectsthe enddate of the project(or the start date if youare schedulingfromthe endof the project).Keepingaclose eye onthe statusof yourcritical tasks at any time istherefore keytogoodprojectmanagement.If the overall projectdurationistoolong,the onlywayto make itshorterand bringinits enddate is to shortenthe critical path.  Settingmilestonesordeadlinestomarkkeydates.A milestone isataskwithzeroduration.It appearson the Gantt chart as milestone symbol.Milestonesare generallyusedtoindicate importantdatesonthe projectplan,oftenkeyeventsorgoals.Forexample,youmightuse milestonestomarkdesiredcompletiondates,orprojectreview meetings. A deadline marker does not affect any of the Gantt calculations, but places a visible marker on the Gantt chart as a reminder. In most Gantt applications an indicator will warn you if a task moves past its deadline marker.  Givingtasks priorities.  Showingapercentage completionforanytask,visible onthe taskbar.  Customizingthe appearance of the projectplanonthe Gantt chart, forexample the colorof task bars, the display(ornot) of informational labels.
  • 12. Reviewing a project using a Gantt chart It's a good idea to review your project plan regularly in order to locate conflicts or other problems. You can then make appropriate changes to remove them. Here are some questions to ask yourself:  Is the projecton course?Viewthe enddate of the lasttask onthe Gantt chart. Checkthat it looksreasonable.  Has any task overshotitsdeadline?If so,youwill needtotake action:extendorremove the deadline,allow more time forthe taskorassignmore people toit.  Are all the linksbetweentasksnecessary?Byunlinkingtasksthatdon'tactuallydependoneach other,youwill make use of all the slacktime available,therebyshorteningyourscheduleand maximizingitsflexibility.  Considerwhethersome taskscouldoverlapeachotherto reduce the overall durationof the project.If so,assignappropriate leadtimes(see UsinglagandleadtimesinaGantt chart). Anotherpossibilityistoredefinesome of your'Finish toStart' relationshipstoeither'Finishto Finish'or'Start to Start' if the logicof yourschedule allowsit.  Are the constraintsworkingasyou expect?If youhave beenaddinganexplanatorynote to everyconstraintyouset,readthe notesto checkthat your intentionsare still beingmet.And lookfortasks that have a constraintbut nonote:these mayhave beencreatedinadvertently and be causingtrouble.Also,because constraintsgenerallyoverride links,theycanintroduce schedule conflicts.  Do the tasks that have constraintsfall where youexpectthemto?Dotheyfitlogicallywiththe othertasks aroundthem?Checkthat theirstartand enddatesare neithertooearlynortoo late.  Are there unexpectedoverlapsorgapsbetweenlinkedtasks?Oftenthisiscausedbya rigid constrainton one or otherof the tasks.However,rememberthatoverlapsandgapscan alsobe causedby intentional leadorlagtimes. 58 sponsoredads
  • 13. What isa Gantt Chart? | CreatingGanttCharts | Gantt Chart Software |Links| Articles |Contact Us | Sitemap RelatedLinks:Free Ganttchart info · Gantt chart · Gantt chart tips · What isa Gantt chart · Gantt chart info· BasicGantt Chart · Gantt © 2012 - 2015 Gantt.com