Downloaded 19 times

![5Logic Gantt Chart Requiescat in Pace
©2012-2013PMAConsultantsLLC
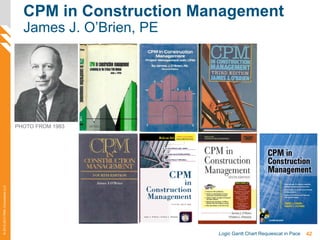
Back in 1965, the Gantt Chart
was Viewed with Some Skepticism
O’Brien, J. (1965). CPM in construction management [p 3]. New York: McGraw-Hill, Inc.
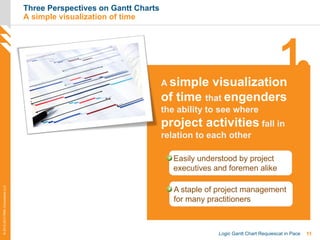
If the bar graph is so well suited to construction
activity, why look for another planning aid? The reason lies in
the fact that the bar graph is limited in what it can present. In
the preparation of the bar chart, the scheduler is almost
necessarily influenced by desired completion dates, often
actually working backward from the completion dates. The
resultant mixture of planning and scheduling is often no better
than wishful thinking.
If a bar graph is carefully prepared, the scheduler
goes through the same thinking process that the CPM planner
does. However, the bar graph cannot show (or record) the
interrelationships and interdependencies which control the
progress of the project. At a later date, even the originator is
often hard pressed to explain his plan using the bar graph.](https://image.slidesharecdn.com/logicganttchartrip-2013-slideshare-190829181153/85/What-are-the-disadvantages-of-Gantt-charts-5-320.jpg)
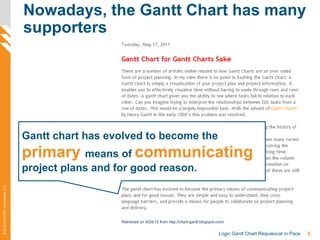
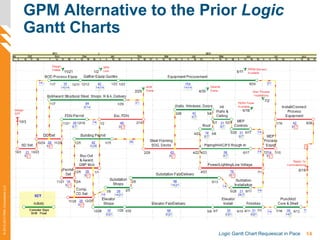
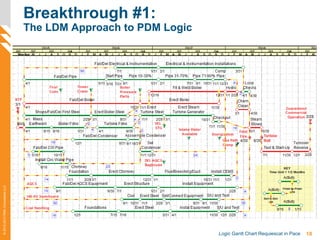
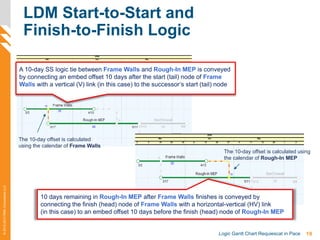
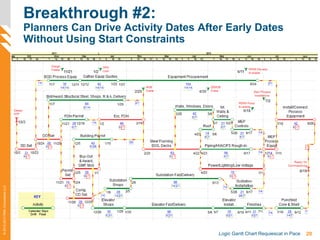
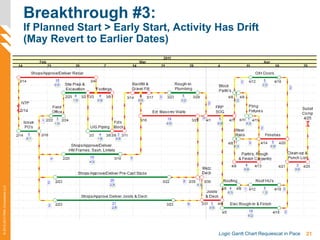
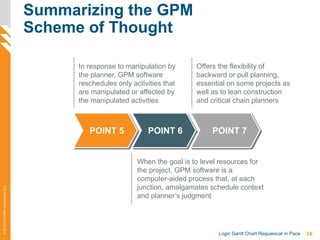
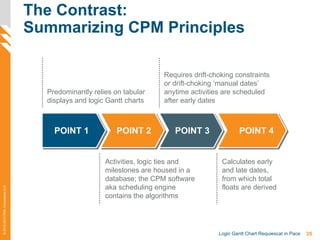
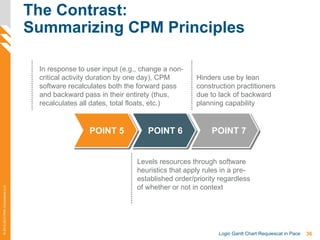
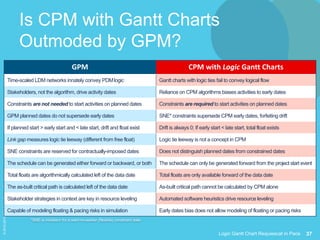


This document provides an overview of the Gantt chart and the Graphical Path Method (GPM) scheduling technique. It begins with a brief history of the Gantt chart and its evolution. It then outlines some key breakthroughs of the GPM approach, including its use of a time-scaled logic diagramming method network, calculation of activity floats and link gaps, and flexibility to generate schedules in either direction. The document contrasts GPM with the Critical Path Method (CPM), noting advantages of GPM such as not requiring constraints and allowing backward scheduling. It concludes by suggesting GPM may render Gantt charts and CPM outdated due to its enhanced capabilities.