2. All dry ingredients were mixed for 15 min in a mixer. Micro compo-
nents were mixed by the progressive enlargement method. The oils
were added to the diets and mixed for an other 15 min. Distilled
water was then added the mix to produce a homogeneous dough. The
experimental diets were obtained through a 2-mm die using a laborato-
ry pellet machine (Institute of Chemical Engineering, South China
University of Technology, Guangzhou, China). The diets were then air-
dried overnight and stored at −20 °C until used.
2.2. Fish and feeding trial
Juvenile giant croaker were obtained from the Zhejiang province Key
Lab of Mariculture and Enhancement (Zhoushan, China) and acclima-
tized to laboratory conditions for 14 days. A total of 225 juveniles
(6.67 ± 0.18 g) were then randomly allocated into 15 cylindrical plastic
tanks (350 L) at a density of 15 fish per tank. Each dietary treatment was
randomly assigned to three tanks. Fish were hand-fed to apparent sati-
ation twice a day (08:00 and 16:30 h) for 8 weeks.
Sand-filtered seawater was provided at a flow rate of 1.5 L min−1
to
each tank with continuous aeration. All tanks had similar light condi-
tions. During the trial, water temperature was maintained at 27.6 ±
0.74 °C, salinity was 27.11 ± 0.98 g L−1
, and dissolved oxygen was
not less than 6 mg/L. Uneaten feed and faeces were removed before
feeding. The tanks were cleaned fortnightly. Fish in each tank were
counted and weighed at the beginning and end of the experiment
after they were starved for 24 h.
2.3. Sample and analytical methods
Eighteen fish at the beginning of the trial and six fish from per tank
at termination were randomly sampled for whole body composition
analysis (moisture, ash, protein, lipid and energy) and nutrient reten-
tion calculation. At the end of the experiment, other six fish per replicate
were anesthetized with MS-222 at a concentration of 150 mg l−1
prior
to samplings. Liver, viscera and intraperitonial fat were taken for calcu-
lating hepatosomatic index (HSI), viscerosomatic index (VSI) and
intraperitonial fat index (IPF), respectively. Liver and dorsal muscle
samples were also collected for subsequent proximate chemical compo-
sition analyses. All samples were stored at −75 °C.
All chemical composition analyses of diets, whole body and tissues
were conducted by standard methods (AOAC, 1995). Moisture was de-
termined by oven drying at 105 °C for 24 h. Crude protein (N × 6.25)
was measured by using an Auto Kjeldahl System (K358/K355, BUCHI,
Flawil, Switzerland). Crude lipid was determined by petroleum ether
extraction using a Soxtec System HT (E-816, BUCHI, Flawil,
Switzerland). Ash was determined by muffle furnace at 550 °C for
24 h. Gross energy contents were analyzed using an adiabatic bomb cal-
orimeter (HER-15E, Shanghai shangli, Shanghai, China).
2.4. Statistical analysis
Data were analyzed using one-way ANOVA, and differences of
means were evaluated for significance by the multiple-range tests of
Tukey (P b 0.05) for homogeneous variances (Levene-test). The
Kruskal-Wallis non-parametric test and Dunn's multiple comparison
test were applied (P b 0.05), where the requirement of normality and
equality of variance were not met. All statistical analyses were per-
formed using the SPSS 18.0 (IBM, Chicago, USA) for Windows. The
second-order polynomial regression model (Robbins et al., 1979) was
used to estimate the appropriate supplementation of dietary lipid for
N. japonica on the basis of WG.
3. Results
3.1. Growth performance and morphometrical parameters
The growth performance of juvenile N. japonica was presented in
Table 2. The experiment showed that the test diets were well accepted
by fish, and no fish died during the growth trial. The growth of fish
were significantly affected by dietary lipid levels (P b 0.05). Fish fed
diets with low lipid levels (5–13%) showed significantly higher weight
gain (WG) and special growth ratio (SGR) than those fed high lipid
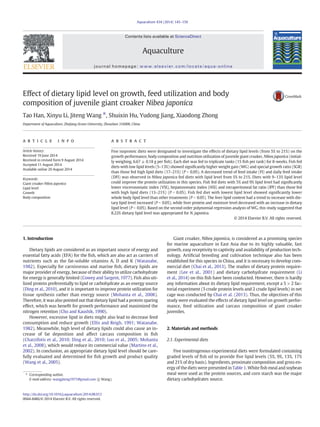
diets (17–21%) (P b 0.05). Based on the second order polynomial re-
gression analysis of WG (Fig. 1), diet containing 8.22% lipid provided
maximum growth of Nibea japonica. Protein efficiency ratio (PER)
increased with dietary lipid level increased from 5% to 13%, and fish
fed diets with 9–17% lipid had significantly higher PER than other treat-
ments (P b 0.05). Moreover, fish fed diets with 9–17% lipid had signifi-
cantly lower feed conversion ratio (FCR) than other treatments. Daily
feed intake (DFI) and feed intake (FI) showed a decreasing trend with
dietary lipid increased, and they were significantly lower in fish fed
diets with 17–21% lipid levels than those fed diets with 5–9% lipid levels
(P b 0.05).
Morphometrical parameters of juvenile N. japonica were presented
in Table 3. The condition factor (CF) of the experiment fish were not sig-
nificantly affected by the dietary treatments (P N 0.05). In addition, fish
fed diets with 5% and 9% lipid levels had significantly lower VSI, HSI and
IPF values than those fed with high lipid diets (13–21%) (P b 0.05).
3.2. Whole body and tissue composition
Whole body and tissue composition of juvenile N. japonica were pre-
sented in Table 4. In treatment groups, the whole-body composition
was significantly affected by dietary lipids (P b 0.05). Fish fed diet
with lowest lipid level showed significantly lower whole body lipid
level than other treatments (P b 0.05). The whole body protein content
was significantly lower in fish fed high lipid diets (17% and 21%) than
Table 1
Composition and proximate analyses of the experimental diets (as fed basis) (g/100 g dry
diets).
Diet (dietary lipid levels %)
1 (5) 2 (9) 3 (13) 4 (17) 5 (21)
Ingredient (g/100 g)
White fishmeala
36.0 36.0 36.0 36.0 36.0
Soybean mealb
33.0 33.0 33.0 33.0 33.0
Lecithinb
0.5 0.5 0.5 0.5 0.5
Fish oilc
0.0 3.8 7.6 11.4 15.2
Corn starch 20.0 15.7 8.5 1.0 0.0
Ascorbyl-2-monophosphate 1.0 1.0 1.0 1.0 1.0
Choline chloride (50%) 0.5 0.5 0.5 0.5 0.5
Vitamin mixd
2.0 2.0 2.0 2.0 2.0
Mineral mixe
3.0 3.0 3.0 3.0 3.0
Carboxymethyl cellulose 4.0 4.0 4.0 4.0 4.0
Cellulose 0.0 0.5 3.9 7.6 4.8
Proximate analysis (g/100 g dry diet)
Moisture 11.90 11.68 11.03 10.80 9.88
Crude protein 45.65 46.15 46.07 47.13 45.68
Crude lipid 5.12 8.99 12.74 16.66 20.57
Ash 11.88 12.00 11.92 11.72 11.68
Gross energy (kJ/g) 16.07 16.81 17.46 18.26 19.21
P:E (mg/kJ) 28.41 27.45 26.39 25.81 23.78
a
Imported from American seafood company, purchased from Zhejiang Longma
Biological Technology Co., Ltd, Huzhou, China.
b
Purchased from Zhoushan Zhonghai Cereals And Oils Industry Co., Ltd, Zhoushan,
China.
c
Supplied by Evergreen Group, Guangdong, China.
d
Vitamin premix contained (g kg−1
premix): thiamin, 5.00; riboflavin, 5.00; pyridox-
ine, 4.00; nicotinic acid, 20.00; calcium pantothenate, 10.00; biotin, 0.60; folic acid, 1.50;
inositol, 200.00; a-tocopherol, 40.00; retinol, 5.00; cyanocobalamin, 0.01; menadione,
4.00; cholecalciferol, 4.8; cellulose, 700.10.
e
Mineral premix contained (g kg−1
premix) calcium biphosphate, 122.87; calcium
lactate, 474.22; sodium biphosphate, 42.03; potassium sulphate dibasic, 163.83; ferrous
sulphate, 10.78; ferric citrate, 38.26; magnesium sulphate, 44.19; zinc sulphate, 4.74;
manganese sulphate, 0.33; copper sulphate, 0.22; cobalt chloride, 0.43; potassium iodide,
0.02; sodium chloride, 32.33; and potassium chloride, 65.75.
146 T. Han et al. / Aquaculture 434 (2014) 145–150
3. those in low lipid diets (5–13%) (P b 0.05). Moreover, the dorsal muscle
composition showed no significant difference among each treatments
(P N 0.05). The liver composition was significantly affected by dietary
lipids (P b 0.05). The liver lipid content had a trend to increase with
dietary lipid level increased, while liver protein and moisture level
decreased with an increase in dietary lipid level.
3.3. Energy retention and deposition of nitrogen and lipid
Nitrogen, energy and lipid utilization of juvenile N. japonica were
presented in Table 5. Daily nitrogen intake (DNI) and daily nitrogen
gain (DNG) decreased with dietary lipid level increased (P b 0.05). Ni-
trogen retention (NR), daily energy gain (DEG) and energy retention
(ER) increased with dietary lipid level increased from 5% to 13%, after
that decreased. Daily lipid intake (DLI) increased accompanying the di-
etary lipid level increased. Fish fed lowest lipid diet had significantly
lower daily lipid gain (DLG) than other treatments (P b 0.05).
4. Discussion
This study showed that the test diets were well accepted by fish, and
no fish died during the growth trial. It is also clear that N. japonica was
capable of achieving a well growth performance over a range of dietary
lipid levels (5–13%). Furthermore, animals need energy for the major
cellular functions involved in maintenance as well as production
(Kaushik and Medale, 1994). It also has been well documented that n-
3 highly unsaturated fatty acids (mainly from fish oil and fish meal)
are necessary for the growth and survival of marine fish (Glencross,
2009; Turchini et al., 2009). In this study, fish fed diet with lowest
lipid level (16.07 kJ/g energy content) showed a good performance,
which also indicated that 5% dietary lipid has been met both the energy
and n-3 highly unsaturated fatty acids requirements of this species.
However, based on the second order polynomial regression analysis of
WG, diet containing 8.22% lipid provided maximum growth of
N. japonica. Chai et al. (2013) also suggested that 9% dietary lipid was
the more suitable than 16% dietary lipid for N. japonica reared in net
pens. Similar results were also observed in other fish species, such as
9.6% dietary lipid for Puntius gonionotus (Mohanta et al., 2008) and 9%
dietary lipid for Epinephelus malabaricus (Lin and Shiau, 2003).
However, a significant decrease in growth rate was also observed in
dietary lipid level more than 13% in this study. Some previous studies
also have reported that excess dietary lipid level could result in reduce
fish growth (Chatzifotis et al., 2010; Luo et al., 2005; Pei et al., 2004;
Wang et al., 2005). Sargent et al. (1989) suggested that the growth re-
duction at excess dietary lipid levels could be due to the inhibition of
de-novo fatty acid synthesis and reduction of the ability of fish to digest
and assimilate it. Furthermore, fish usually regulated their feed con-
sumption to meet the energy requirement (Hemre et al., 1995; Sveier
Table 2
Growth performances of juvenile Nibea japonica fed diets containing different lipid levels.
Diet (dietary lipid levels %)
1 (5) 2 (9) 3 (13) 4 (17) 5 (21) P Pooled SE⁎
IBW (g)1
6.6 6.74 6.79 6.37 6.79 KW, 0.450 0.09
FBW (g)2
60.95cd
67.26d
61.69cd
44.50b
34.67a
KW, 0.022 3.34
WG (%)3
816.57c
900.78c
809.63c
598.36b
412.21a
KW, 0.026 49.50
SGR (% day−1
)4
4.10c
4.26c
4.09c
3.60b
3.02a
KW, 0.025 0.13
FCR5
1.06c
0.93b
0.87a
0.86a
1.01c
AN, 0.000 0.22
PER6
2.04a
2.34b
2.48b
2.43b
2.14a
AN, 0.000 0.48
PPV7
0.53c
0.64d
0.67d
0.44b
0.37a
KW, 0.010 0.03
DFI (g ABW−1
day−1
)8
3.05d
2.72c
2.49b
2.31a
2.38ab
AN, 0.000 0.07
FI (g/fish)9
57.77c
56.36c
46.73b
32.93a
26.63a
AN, 0.000 3.42
Average body weight (ABW) = (initial body weight + final body weight)/2.
⁎ Standard error of the mean (pooled). AN = one way ANOVA, KW = Kruskal Wallis and P values are given. Values in a same column that do not share same superscripts are signif-
icantly different (P b 0.05).
1
Initial body wet weight (g).
2
Final body wet weight (g).
3
Weight gain (WG) = 100 × (final body weight − initial body weight)/initial body weight.
4
Special growth ratio (SGR) = 100 × (ln (final weight) – ln (initial weight))/56 days.
5
Feed conversion ratio (FCR) = total feed intake/weight gain.
6
Protein efficiency ratio (PER) = weight gain/protein intake.
7
Productive protein value (PPV) = protein gain/protein intake.
8
Daily feed intake = 100 × total feed intake/ABW × 56 days.
9
Feed intake = total feed (g)/fish number.
Fig. 1. Relationship of weight gain (WG, %) with dietary lipid levels of juvenile Nibea japon-
ica fed the experiment diet.
Table 3
Morphometrical parameters of juvenile Nibea japonica fed diets containing different lipid
levels.
Diet (dietary lipid levels %)
1 (5) 2 (9) 3 (13) 4 (17) 5 (21) P Pooled SE⁎
VSI (%)1
5.27a
5.12a
5.75b
6.52c
6.75c
AN, 0.000 0.18
HIS (%)2
2.02a
2.08a
2.35b
2.82c
2.93c
AN, 0.000 0.10
IPF (%)3
0.05a
0.16b
0.35c
0.29c
0.29c
KW, 0.020 0.03
CF4
1.61 1.47 1.48 1.48 1.48 AN, 0.242 0.02
⁎ Standard error of the mean (pooled). AN = one way ANOVA, KW = Kruskal Wallis
and P values are given. Values in a same column that do not share same superscripts are
significantly different (P b 0.05).
1
Viscerosomatic index (VSI) = 100 × viscera weight/fish wet weight.
2
Hepatosomatic index (HSI) = 100× liver wet weight/fish wet weight.
3
Intraperitoneal fat ratio (IPF) =100 × intraperitoneal fat weight/fish wet weight.
4
Condition factor (CF) = fish wet weight/(body length) 3
.
147
T. Han et al. / Aquaculture 434 (2014) 145–150
4. et al., 1999). Some researchers also suggested that fish fed diet contain-
ing excess energy led to growth depression by feed intake (Ellis and
Reigh, 1991; El-Sayed and Garling Jr, 1988) and nitrogen intake reduc-
tion (Khan and Abidi, 2012). In agreement, a decreased trend of FI, DFI
and DNI was observed in N. japonica fed diets with lipid level from 5%
to 21% (energy content from 16.07 kJ/g to 19.21 kJ/g), which could part-
ly explain the fish fed high lipid and energy diets obtained a poor
growth in this study.
Our previous study demonstrated that N. japonica could utilize high
dietary carbohydrate as much as 24% (energy content was 16.97 kJ/g)
(Li et al., 2014). In the present study, corn starch was used as the
major dietary carbohydrate source (0–20%) to compensate for the vari-
ous dietary lipid levels. Juvenile N. japonica fed diet 1 (5% lipid level and
20% corn starch level) obtained a good growth performance, while fish
showed a significantly higher DEI than other groups. Moreover, signifi-
cantly lower energy retention (ER) was also obtained in fish fed diet 1
than those in other treatments (except the diet 5 group). These results
might indicate that the utilization of dietary carbohydrate as energy
source was poorer than dietary lipid in N. japonica. Similar results
were also reported in other species by previous studies (Ellis and
Reigh, 1991; Hu et al., 2007; Li et al., 2014).
The protein sparing effect of lipid has been reported in many fish
species (Chatzifotis et al., 2010; Ding et al., 2010; Luo et al., 2005;
Song et al., 2009). Therefore, in consideration of a protein-sparing effect
in the high-lipid diet, the nutritional strategy is to increase dietary pro-
tein utilization by increasing adequate lipid levels without inhibiting the
growth (Ai et al., 2004; Sargent et al., 2002). Although fish fed diet with
9–17% lipid levels showed a higher PER than those fed diet 1, a decrease
in body protein and an increase in body lipid contents were observed
with fish fed high lipid level diets. These observations might indicate
that fish fed high lipid diets gain more fat causing the different PER
values, which were further supported by the result that there is a diver-
gence between PPV and PER values in diet 4 and diet 1 groups. In agree-
ment, this study also showed that DLI increased accompanying the
Table 4
Whole body, muscle and liver composition of juvenile Nibea japonica fed diets containing different lipid levels.
Diet (dietary lipid levels %)
Diet Initial 1 (5) 2 (9) 3 (13) 4 (17) 5 (21) P Pooled Sem⁎
Whole fish
Moisture (%) 76.39 74.64d
72.86b
71.85a
73.52bc
74.02cd
KW, 0.010 0.27
Protein (%) 17.72 17.76c
17.72c
17.78c
16.25b
15.76a
AN, 0.032 0.24
Lipid (%) 1.77 2.72a
4.52b
4.74bc
5.34c
4.97bc
KW, 0.001 0.25
Ash (%) 4.43 3.93a
4.01a
4.01a
4.11ab
4.28b
AN, 0.011 0.04
Dorsal muscle
Moisture (%) 78.42 78.38 77.76 78.51 78.27 AN, 0.415 0.13
Protein (%) 19.58 19.35 19.92 19.61 19.70 AN, 0.787 0.13
Lipid (%) 0.61 0.71 1.14 1.72 1.13 KW, 0.157 0.16
Liver
Moisture (%) 61.15c
54.18b
49.43a
49.11a
48.26a
KW, 0.019 1.30
Protein (%) 11.48ab
11.91b
10.79a
10.68a
10.79a
AN, 0.094 0.18
Lipid (%) 20.78a
26.20ab
31.39bc
31.31bc
38.69 KW, 0.020 1.81
⁎ Standard error of the mean (pooled). AN = one way ANOVA, KW = Kruskal Wallis and P values are given. Values in a same column that do not share same superscripts are signif-
icantly different (P b 0.05).
Table 5
Nitrogen, energy and lipid utilization by juvenile Nibea japonica fed diets containing different lipid levels.
Diet (dietary lipid levels %)
1 (5) 2 (9) 3 (13) 4 (17) 5 (21) P Pooled SE⁎
Nitrogen
DNI (g kg−1
ABW day−1
)1
1.99c
1.78b
1.65a
1.61a
1.62a
AN, 0.000 0.04
DNG2
(g kg−1
ABW day−1
)2
0.82c
0.83c
0.82c
0.69b
0.59a
AN, 0.000 0.03
NR (%intake)3
41.01b
46.5c
49.40d
42.66b
36.27a
AN, 0.000 1.24
Energy
DEI (kJ kg−1
ABW day−1
)4
4.92c
4.62b
4.40ab
4.29a
4.62b
AN, 0.002 0.07
DEG (kJ kg−1
ABW day−1
)5
1.49b
1.72c
1.73c
1.59b
1.392a
AN, 0.000 0.04
ER (%intake)6
30.32a
37.32b
39.46c
37.08b
30.08a
AN, 0.000 1.07
Lipid
DLI (g kg−1
ABW day−1
)7
1.35 ± 0.02a
2.16b
2.81c
3.38d
4.33e
AN, 0.000 0.27
DLG (g kg−1
ABW day−1
)8
0.81a
1.41b
1.46b
1.59b
1.38b
AN, 0.000 0.08
LR (%intake)9
60.41cd
65.28d
52.13bc
47.08b
31.89a
AN, 0.001 3.40
⁎ Standard error of the mean (pooled). AN = one way ANOVA, KW = Kruskal Wallis and P values are given. Values in a same column that do not share same superscripts are signif-
icantly different (P b 0.05).
1
Daily nitrogen intake = feed intake nitrogen/ABW × days.
2
Daily nitrogen gain = (final body weight × final body nitrogen-initial body weight × initial body nitrogen)/ABW × days.
3
Nitrogen retention = 100 × daily nitrogen gain/daily nitrogen intake.
4
Daily energy intake = feed intake energy/ABW × days.
5
Daily energy gain = (final body weight × final body energy − initial body weight × initial body energy)/ABW × days.
6
Energy retention = 100 × daily energy gain/daily energy intake.
7
Daily lipid intake = feed intake lipid/ABW × days.
8
Daily lipid gain = (final body weight × final body lipid − initial body weight × initial body lipid)/ABW × days.
9
Lipid retention = 100 × daily lipid gain/daily lipid intake.
148 T. Han et al. / Aquaculture 434 (2014) 145–150
5. dietary lipid level increased, and DLG had a trend to increase with die-
tary lipid level from 5% to 17%. These results also proved that
N. japonica tended to increase their lipid deposition with increasing
lipid levels in diets. Furthermore, Lie et al. (1988) suggested that PPV
is a better indicator of a feed/growth compared to PER in some fish spe-
cies which have fat deposits in body. In this study, a significantly higher
PPV was observed in fish fed dietary lipid from 9% to 13% compared to
those fed other diets. When PPV values are seen together with NR
values, it could indicate that 9–13% dietary lipid level could improve
the protein utilization in this species.
Previous studies also have reported that excess dietary lipid result in
fat deposition, which could further lead to produce fatty fish with poor
commercial value (Hanley, 1991). It is also well known that VSI value is
one of the most important indicators directly affecting the yield in the
fish production (Wang et al., 2005). In this study, VSI was significantly
higher with feeding of high lipid (13–21%) diets than those fed with
low lipid (5% and 9%) diets, which also suggested that high lipid level
diets led to a poor commercial value of production. It is also meaningful
and noteworthy that fish fed diet with 13% lipid level obtained good
growth performance, FCR and PER values, but with significant higher
VSI than those fed lower lipid diets (5% and 9%). To a certain extent,
the high WG value in this group can not regard as an accurate predictor
of true growth performance. Moreover, the increase of VSI in this study
was also related to an increased trend of HSI and IPF by dietary lipid
level increase. A positive relationship between the dietary lipid level
and IPF also has been reported in some fishes, such as Rachycentron
canadum (Wang et al., 2005), Ctenopharyngodon idella (Du et al.,
2005) and Odontesthes bonariensis (Gómez-Requeni et al., 2013).
Many studies have shown that HSI increased with the increase of die-
tary lipid levels, such as Oreochromis niloticus (Hanley, 1991), Tor
khudree (Bazaz and Keshavanath, 1993) and Puntius gonionotus
(Mohanta et al., 2008).
Furthermore, some previous studies also indicated that high HSI
might relate to the lipid accumulation in fish liver (Hilton and
Atkinson, 1982; Mohanta et al., 2009; Ren et al., 2011). This hypothesis
was also supported by the present result, which liver lipid level showed
an increase trend with the supplementation of dietary lipid. Although
some studies indicated that a fat accumulation was observed in muscle
by dietary lipid level (Chatzifotis et al., 2010; Wang et al., 2005), the
muscle lipid content of this study showed no significant difference. In
consideration the increase of HIS, IPF and liver lipid level in high dietary
lipid treatments, this study suggested that the excess dietary lipid tends
to deposit on viscera of N. japonica. This result was also in agreement
with previous studies (Martino et al., 2002; Mohanta et al., 2008). Luo
et al. (2005) also suggested excess dietary lipid led to a lipid accumula-
tion in the liver and other visceral organs in Epinephelus coioides. In ad-
dition, present study showed that a decrease in body protein content
was observed with fish fed high lipid level diets, which was similar
with previous study (Gómez-Requeni et al., 2013; Peres and
Oliva-Teles, 1999; Song et al., 2009; Wang et al., 2005).
In conclusion, results of this study suggested that N. japonica is
capable of achieving a well growth performance with dietary lipid
level from 5% to 13%. Based on the second order polynomial regres-
sion analysis of WG, 8.22% dietary lipid level was appropriated for
N. japonica. Excess dietary lipid (13–21%) also led to a lipid accumu-
lation in the liver and other visceral organs, as well as a poor com-
mercial value of production.
Acknowledgments
This work was supported by a grant from the Applied Basic
Research Programs of international science and technology cooper-
ation program of Zhejiang Province (No. 2013C24029) and Zhejiang
Provincial Natural Science Foundation of China (Grant No.
Y3090624).
References
Ai, Q.H., Mai, K.S., Li, H.T., Zhang, C.X., Zhang, L., Duan, Q.Y., Tan, B.P., Xu, W., Ma, H.M.,
Zhang, W.B., 2004. Effects of dietary protein to energy ratios on growth and body
composition of juvenile Japanese seabass, Lateolabrax japonicus. Aquaculture 230,
507–516.
AOAC, 1995. Official methods of analysis of AOAC International, In: Cunniff, P. (Ed.), Offi-
cial Analytical Chemists, 16th ed. AOAC International, Arlington, VA, USA (1141 pp.).
Bazaz, M.M., Keshavanath, P., 1993. Effect of feeding different levels of sardine oil on
growth, muscle composition and digestive enzyme activities of mahseer, Tor khudree.
Aquaculture 115, 111–119.
Chai, X.J., Ji, W.X., Han, H., Dai, Y.X., Wang, Y., 2013. Growth, feed utilization, body compo-
sition and swimming performance of giant croaker, Nibea japonica Temminck and
Schlegel, fed at different dietary protein and lipid levels. Aquac. Nutr. http://dx.doi.
org/10.1111/anu.12038.
Chatzifotis, S., Panagiotidou, M., Papaioannou, N., Pavlidis, M., Nengas, I., Mylonas, C.C.,
2010. Effect of dietary lipid levels on growth, feed utilization, body composition
and serum metabolites of meagre (Argyrosomus regius) juveniles. Aquaculture 307,
65–70.
Cho, C.Y., Kaushik, S.J., 1990. Nutritional energetics in fish: energy and protein utilization
in rainbow trout (Salmo gairdneri). World Rev. Nutr. Diet. 61, 132–172.
Cowey, C.B., Sargent, J.R., 1977. Lipid nutrition in fish. Comp. Biochem. Physiol. Part B:
Comp. Biochem. 57, 269–273.
Ding, L.Y., Zhang, L.M., Wang, J.Y., Ma, J.J., Meng, X.J., Duan, P.C., Sun, L.H., Sun, Y.Z., 2010.
Effect of dietary lipid level on the growth performance, feed utilization, body compo-
sition and blood chemistry of juvenile starry flounder (Platichthys stellatus). Aquac.
Res. 41, 1470–1478.
Du, Z.Y., Liu, Y.J., Tian, L.X., Wang, J.T., Wang, Y., Liang, G.Y., 2005. Effect of dietary lipid
level on growth, feed utilization and body composition by juvenile grass carp (Cteno-
pharyngodon idella). Aquac. Nutr. 11, 139–146.
Ellis, S.C., Reigh, R.C., 1991. Effects of dietary lipid and carbohydrate levels on growth and
body composition of juvenile red drum, Sciaenops ocellatus. Aquaculture 97, 383–394.
El-Sayed, A.F.M., Garling Jr., D.L., 1988. Carbohydrate-to-lipid ratios in diets for Tilapia zillii
fingerlings. Aquaculture 73, 157–163.
Glencross, B.D., 2009. Exploring the nutritional demand for essential fatty acids by aqua-
culture species. Rev. Aquac. 1, 71–124.
Gómez-Requeni, P., Bedolla-Cázares, F., Montecchia, C., Zorrilla, J., Villian, M., Mayra
Toledo-Cuevas, E., Canosa, F., 2013. Effects of increasing the dietary lipid levels on
the growth performance, body composition and digestive enzyme activities of the
teleost pejerrey (Odontesthes bonariensis). Aquaculture 416, 15–22.
Hanley, F., 1991. Effects of feeding supplementary diets containing varying levels of lipid
on growth, food conversion, and body composition of Nile tilapia, Oreochromis
niloticus (L.). Aquaculture. 93, 323–334.
Hemre, G.I., Sandnes, K., Li, Ø., Torrissen, Ø., Waagbo, R., 1995. Carbohydrate nutrition in
Atlantic salmon, Salmo salar L.: growth and feed utilization. Aquacult. Res. 26, 149–154.
Hilton, J.W., Atkinson, J.L., 1982. Response of rainbow trout (Salmo gairdneri) to in-
creased levels of available carbohydrate in practical trout diets. Br. J. Nutr. 47,
597–607.
Hu, Y.H., Liu, Y.J., Tian, L.X., Yang, H.J., Liang, G.Y., Gao, W., 2007. Optimal dietary carbohy-
drate to lipid ratio for juvenile yellowfin seabream (Sparus latus). Aquac. Nutr. 13,
291–297.
Kaushik, S.J., Medale, F., 1994. Energy requirements, utilization and dietary supply to sal-
monids. Aquaculture 124, 81–97.
Khan, M.A., Abidi, S.F., 2012. Effect of varying protein-to-energy ratios on growth, nutrient
retention, somatic indices, and digestive enzyme activities of Singhi, Heteropneustes
fossilis (Bloch). J. World Aquacult. Soc. 43, 490–501.
Lee, H.Y.M., Cho, K.C., Lee, J.E., Yang, S.G., 2001. Dietary protein requirement of juvenile
giant croaker, Nibea japonica Temminck & Schlegel. Aquac. Res. 32, 112–118.
Li, X.Y., Wang, J.T., Han, T., Hu, S.X., Jiang, Y.D., 2014. Effects of dietary carbohydrate level
on growth and body composition of juvenile giant croaker Nibea japonica. Aquac. Res.
http://dx.doi.org/10.1111/are.12437.
Lie, Øyvind, Lied, E., Lambertsen, G., 1988. Feed optimization in Atlantic cod (Gadus
morhua): fat versus protein content in the feed. Aquaculture 69, 333–341.
Lin, Y.H., Shiau, S.Y., 2003. Dietary lipid requirement of grouper, Epinephelus malabaricus,
and effects on immune responses. Aquaculture 225, 243–250.
Luo, Z., Liu, Y.J., Mai, K.S., Tian, L.X., Liu, D.H., Tan, X.Y., Lin, H.Z., 2005. Effect of dietary lipid
level on growth performance, feed utilization and body composition of grouper
Epinephelus coioides juveniles fed isonitrogenous diets in floating netcages. Aquac.
Int. 13, 257–269.
Martino, R.C., Cyrino, J.P., Portz, L., Trugo, L.C., 2002. Effect of dietary lipid level on nutri-
tional performance of the surubim, Pseudoplatystoma coruscans. Aquaculture 209,
209–218.
Mohanta, K.N., Mohanty, S.N., Jena, J.K., Sahu, N.P., 2008. Optimal dietary lipid level of sil-
ver barb, Puntius gonionotus fingerlings in relation to growth, nutrient retention and
digestibility, muscle nucleic acid content and digestive enzyme activity. Aquac. Nutr.
14, 350–359.
Mohanta, K.N., Mohanty, S.N., Jena, J., Sahu, N.P., Patro, B., 2009. Carbohydrate level in the
diet of silver barb, Puntius gonionotus (Bleeker) fingerlings: effect on growth, nutri-
ent utilization and whole body composition. Aquac. Res. 40, 927–937.
Pei, Z., Xie, S., Lei, W., Zhu, X., Yang, Y., 2004. Comparative study on the effect of dietary
lipid level on growth and feed utilization for gibel carp (Carassius auratus gibelio)
and Chinese longsnout catfish (Leiocassis longirostris Gunther). Aquac. Nutr. 10,
209–216.
Peres, H., Oliva-Teles, A., 1999. Effect of dietary lipid level on growth performance and
feed utilization by European sea bass juveniles (Dicentrarchus labrax). Aquaculture
179, 325–334.
149
T. Han et al. / Aquaculture 434 (2014) 145–150
6. Ren, M.C., Ai, Q.H., Mai, K.S., Ma, H.M., Wang, X.J., 2011. Effect of dietary carbohydrate
level on growth performance, body composition, apparent digestibility coefficient
and digestive enzyme activities of juvenile cobia, Rachycentron canadum L. Aquac.
Res. 42, 1467–1475.
Robbins, K.R., Norton, H.W., Baker, D.H., 1979. Estimation of nutrient requirements from
growth data. J. Nutr. 109, 1710.
Sargent, J.R., Henderson, R.J., Tocher, D.R., 1989. The lipids. In: Halver, J.E. (Ed.), Fish Nutri-
tion. Academic Press, London, pp. 154–209.
Sargent, J.R., Tocher, D.R., Bell, J.G., 2002. The lipids. In: Halver, J.E., Hardy, R.W. (Eds.), Fish
nutrition. Academic Press, London, pp. 182–257.
Song, L.P., An, L.G., Zhu, Y.A., Li, X., Wang, A.Y., 2009. Effects of dietary lipids on growth
and feed utilization of jade perch, Scortum barcoo. J. World Aquacult. Soc. 40,
266–273.
Sveier, H., Wathne, E., Lied, E., 1999. Growth, feed and nutrient utilisation and gastrointes-
tinal evacuation time in Atlantic salmon (Salmo salar L.): the effect of dietary fish
meal particle size and protein concentration. Aquaculture 180, 265–282.
Turchini, G.M., Torstensen, B.E., Ng, W.K., 2009. Fish oil replacement in finfish nutrition.
Rev. Aquac. 1, 10–57.
Wang, J.T., Liu, Y.J., Tian, L.X., Mai, K.S., Du, Z.Y., Wang, Y., Yang, H.J., 2005. Effect of dietary
lipid level on growth performance, lipid deposition, hepatic lipogenesis in juvenile
cobia (Rachycentron canadum). Aquaculture 249, 439–447.
Watanabe, T., 1982. Lipid nutrition in fish. Comp. Biochem. Physiol. Part B: Comp.
Biochem. 73, 3–15.
150 T. Han et al. / Aquaculture 434 (2014) 145–150