2. body composition and fatty acid metabolism (Messager et al. 1992; Di Bella et al.
1993; Csengeri et al. 1996) or in pathological symptoms developed due to defi-
ciencies and tissue histology (Wanakowat et al. 1993; Lemaire et al. 1991; Mosconi-
Bac 1987). The lowest levels of n-3 fatty acids indispensable for adequate growth
of sea bass and lack of pathological symptoms has not so far been determined.
The aim of the present study was to determine the effect that different supple-
mental dietary oils have on the performance, feed utilization and tissue composi-
tion of European sea bass (Dicentrarchus labrax) and to detect its requirements for
essential fatty acids. Fish of medium size (initial weight 95 g) were used. The his-
tological appearance of basic organs was also examined in order to screen for any
changes at suboptimal HUFA contents.
Materials and methods
A total number of 300 fish of the species Dicentrarchus labrax were used in the
experiments obtained from a commercial fish farm in Western Greece. The initial
mean weight of the fish was 94.2 ± 8.9 g and the mean length 20.9 ± 1.7 cm. The
fish were divided in groups of 30 and placed in experimental rearing sea cages with
internal dimensions of 1.5×1.2×1.5 m and volume of 2.7 m3
. The net mesh size
was 12 mm. The experiment was performed in duplicate. Successive weighing of
the whole population of each cage was carried out every 30 days after anaesthetiz-
ing the fish, following 24 hrs fasting. The experiment lasted 166 days (24 weeks).
Changes of the nets were carried out every 15–20 days in order to keep the rearing
conditions at optimum levels. Fish were fed three times daily at a rate of 1.7–2% of
their body weight, 6 days per week. The temperature during the experiment ranged
from 18 °C to 24 °C (mean 21 °C), the salinity was 38‰, the average dissolved
oxygen 6.5–7.1 mg/l and the pH 8.2. At the end of the experiment 6 fish from each
tank were removed for carcass composition analysis, liver and blood analysis (se-
rum) as well as liver fatty acid analysis and histological examination.
Five diets were prepared based on the same basal practical formula enriched with
different types of oil (Table 1). The supplemental oils used were olive oil (OO),
soybean oil (SBO), mixture of olive oil with fish oil (OO/FO), mixture of soybean
oil with fish oil (SBO/FO) and fish oil (FO) in proportions and levels given in
Table 1. The fatty acid profile of each diet is presented in Table 2.
Crude constituent analysis of fish carcass (protein, fat, ash and moisture) was
carried out according to standard methods (Williams 1984). Total liver and serum
lipids were determined by the phosphovanillin method (Alexis et al. 1985). Liver
glycogen was determined according to the method of Murat and Serfaty (1974).
Total serum cholesterol was measured with the diagnostic kit No 236691 (Boe-
hringer Manheim). Histological sections of various internal organs of the fish in-
cluding liver, kidney and gills, were carried out according to standard techniques
with paraffin embedding and haematoxylin & eosin staining (Cullins and Dunn
1981).
464
3. Fatty acid analysis was performed as described in Kalogeropoulos et al. (1992),
with the following changes. A flexible fused silica column (50 m × 0.39 mm, inside
diameter 0.25 mm, 0.2 mm film thickness) with a bonded stationary phase of CP-
Sil 88 (Chrompack International BV) was employed. Helium was used as the car-
rier gas. The column temperature was programmed to be initially at 160 °C for 25
min, then to increase with a rate of 4 °C/min to 184 °C, to keep at this temperature
for 10 min and then to increase to a final temperature of 210 °C by a rate of 5
°C/min. Under the conditions used for fatty acid analysis the retention times of
20:4n-6 and 22:1n-11 were close and an error was inherent in the calculation of the
areas of respective fatty acids.
Statistical analysis of data was performed with the statistical software package
StatGraphics Windows 2.1. One–way analysis of variance (ANOVA), followed by
Duncan’s post-hoc test, was used to test for differences between diets. Significance
was accepted when p < 0.05.
Results
The performance factors of the fish are indicated in Table 3. Fish growth, feed ef-
ficiency and level of protein retention in response to the different diets did not show
statistically significant differences.
Moisture, protein and lipid content of the carcass did not show statistically sig-
nificant differences among groups with the exception of a higher moisture content
indicated by the OO diet (Table 4). However certain trends in some of the values
were apparent. Lipid level was lower in the diets supplemented only with plant oils
Table 1. Composition of diets in raw materials and proximate composition of the experimental diets.
Ingredients % Fat*
Proximate composition %
Herring Meal 40.1 3.42 Protein 46.1
Soybean Meal 23 0.26 Fat 12
Wheat middling 14.8 0.43 Carbohydrates 19
Poultry by-products 10 2.37 Crude Fiber 4.4
Oils1
5.5 5.5 Ash 10.5
Binders 2 – Moisture 8.0
Dicalcium Phosphate 1.8 –
Meat bone meal 1.6 0.02
Vitamin and mineral premix2
1 –
D-L-Methionine 0.2 –
1
Supplemental olive oil (OO), soybean oil (SBO), or fish oil (FO) in the diets as follows: Diet OO:
5.5% OO, Diet SBO: 5.5% SBO, Diet OO/FO: 2.5% OO + 3% FO, Diet SBO/FO: 2.5% SBO + 3% FO,
Diet FO: 5.5% FO.
2
As described in Kalogeropoulos et al. (1992).
*
amount of fat contributed by each source, gr/100gr diet
465
4. and protein content was lowest in the OO and FO diets. Significant differences were
also apparent in the ash content of the different dietary groups, but these did not
follow a specific trend.
The hepatosomatic index, Table 5, was highest for the FO containing diet and
lowest for the OO containing one, with all other diets indicating intermediate val-
ues. Glycogen content was generally lower for the diets only supplemented with
plant oils, although no statistically significant differences were apparent. Total lipid
levels were also similar among all groups and amounted to about 1/3 of the total
liver mass. After 4 months of rearing of the fish, lipid content significantly increased
and glycogen content significantly decreased in almost all diets tested. Hepatoso-
matic index (HSI) decreased significantly only in the OO fed groups.
Table 2. Fatty acid composition of the diets (as percentage of total fatty acids).
fatty acids OO SBO OO/FO SBO/FO FO
14:0 1.5 1.5 3.1 3.1 3.9
15:0 1.6 1.6 1.8 1.8 1.8
16:0 16.5 14.8 15.6 14.8 14.0
16:1 2.1 1.7 3.9 3.8 4.9
16:2 0.7 0.7 0.9 0.9 1.0
18:0 3.7 4.7 3.4 3.9 3.1
16:3 0.0 0.0 0.1 0.1 0.2
18:1n-9 43.3 19.0 27.3 16.3 13.2
18:1n-7 0.0 0.0 0.8 0.8 1.3
18:2n-6 9.7 32.2 8.9 19.1 8.1
18:3n-6 0.2 0.0 0.1 0.0 0.0
18:3n-3 1.2 4.1 1.5 2.8 1.6
20:1n-9 2.8 2.8 7.0 7.0 9.3
18:4n-3 1.0 0.7 1.3 1.2 1.5
20:4n-6 0.2 0.2 0.3 0.3 0.4
22:1n-11 2.8 2.8 6.4 6.4 8.5
22:1n-9 0.2 0.2 0.6 0.6 0.9
20:5n-3 2.3 2.3 3.6 3.6 4.4
22:5n-3 0.0 0.0 0.3 0.3 0.4
22:6n-3 4.5 4.5 5.6 5.6 6.2
saturates 23.3 22.6 23.9 23.5 22.9
monoenes 51.2 26.5 46.1 34.9 37.9
n-6 10.2 33.0 10.3 20.6 9.9
n-3 9.1 11.7 12.5 13.7 14.2
EPA+DHA 6.9 6.9 9.2 9.2 10.5
DHA/EPA 1.9 1.9 1.5 1.5 1.4
EPA/AA 11.7 11.7 12.2 12.2 10.9
n-3/n-6 0.9 0.4 1.2 0.7 1.4
466
5. No statistically significant differences were apparent in haematocrit values (Ta-
ble 6). The total serum lipids were highest for the FO diet and lowest for the OO
diet. Cholesterol levels were also highest for the FO groups, the lowest value in-
dicated for the SBO/FO group.
The fatty acid analyses of the neutral and polar lipids of the liver are presented
in Tables 7 and 8 respectively. The main groups of dietary fatty acids were corre-
lated to the respective ones of neutral or polar liver fatty acids. A strong correlation
existed only between dietary and liver neutral monoenes (r=0.939) and dietary and
neutral (r=0.988) and polar (r=0.965) n-6 fatty acids. The main contributor to n-6
fatty acids was 18:2n-6 for neutral lipids while both 18:2n-6 and 20:4n-6 (AA) were
contributing polar lipids. The n-3 PUFA were the main fatty acid category in liver
phospholipids and the highest values were present in the tissues of fish fed the FO
diet.
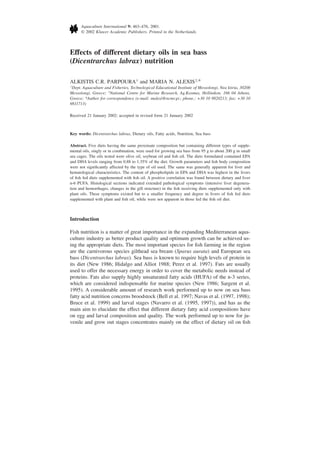
Observations on the histological appearance of liver tissue indicated that no
pathological phenomena were present in the fish fed the FO diet (Figure 1A). The
liver cell membranes were intact but an intense lipid infiltration was apparent. On
Table 3. Growth parameters of the fish during the experiment.
EXPERIMENTAL DIETS
OO SBO OO/FO SBO/FO FO SE*
Initial Weight (g)) 95.3 98.8 92.4 89.9 95.0 7.6
Weight Increase (g) 100.0 102.5 102.9 100.1 97.3 7.4
Final weight (g) 195.2 201.3 195.3 189.9 192.3 6.06
Feed Efficiency (%) 42.9 42.9 45.2 43.3 43.8 3.6
Specific Growth Rate (%) 0.44 0.43 0.45 0.45 0.43 0.05
Protein Efficiency Ratio 0.93 0.93 0.98 0.94 0.95 0.08
Protein retention (%) 16.3 16.6 17.7 17.4 16.4 2.5
There were no significant differences between diets according to Duncan’s post-hoc test
*
SE, standard error of the mean
Table 4. Fish carcass composition analysis.
MOISTURE PROTEIN LIPIDS ASH
Initial Population 68.4a 18.3a 9.6a 4.44d
Diet OO 69.4b 17.8a 9.8a 2.92bc
Diet SBO 68.5a 18.1a 9.7a 2.74ab
Diet OO/FO 68.1a 18.2a 10.2a 2.74ab
Diet SBO/FO 67.9a 18.4a 10.2a 2.96c
Diet FO 68.0a 17.5a 10.3a 2.71a
SE*
0.2 0.4 0.3 0.09
Values in the same column followed by the same letter do not differ statistically according to Duncan’s
test (p < 0.05).
*
SE, standard error of the mean
467
6. the contrary liver histological sections of the other diets, especially OO (Figure 1B)
and SBO, indicated severe pathological symptoms presenting as completely de-
stroyed areas with degradation products. Before this final stage, smaller changes
were noticed like destroyed hepatic structure, degradation of cell membranes and
formation of giant multinuclear cells and infiltration of liver tissue by macrophages.
These findings were more extended and severe in fish fed the diets OO and SBO.
In the diets OO/FO and SBO/FO the phenomena were similar but the extent of
tissue damage was of a lower degree. Histological problems in other tissues were
not apparent except in gills of fish fed the OO diet, where hyperplasia of the gill
epithelium between the secondary lamellae was observed. The potential cause of
this hyperplasia was infection by external parasites.
Discussion
It is well known that marine fish require mainly n-3 HUFA and, in particular, EPA
(20:5 n-3) and DHA (22:6 n-3) for optimum performance (Sargent et al. 1989).
Table 5. Liver composition and hepatosomatic index (H.S.I.) before and after the experiment.
Total Lipids % Glycogen % H.S.I.
Initial Composition 26.0a 19.1b 2.2b
Diet OO 34.5b 8.8a 1.7a
Diet SBO 35.0b 8.6a 2.0ab
Diet OO/FO 33.0ab 9.4a 1.9ab
Diet SBO/FO 37.4b 9.5a 2.0ab
Diet FO 36.6b 9.8a 2.2b
SE*
2.4 1.3 0.1
Values in the same column followed by the same letter do not differ statistically according to Duncan’s
test (p < 0.05).
*
SE, standard error of the mean
Table 6. Blood composition of fish after the experiment.
Diets Total Lipids mg/100 ml serum Cholesterol mg/100 ml serum Haematocrit %
Diet OO 2206a 272.0ab 40.4a
Diet SBO 2497ab 275.5ab 39.5a
Diet OO/FO 2595ab 273.0ab 39.6a
Diet SBO/FO 2512ab 256.8a 40.1a
Diet FO 2900b 324.1b 41.5a
SE*
190 17.7 1.4
Values in the same column followed by the same letter do not differ statistically according to Duncan’s
test (p < 0.05).
*
SE, standard error of the mean
468
7. Fatty acids are components of polar and neutral lipids. Neutral lipids are depot fats
while polar lipids are integral parts of biomembranes. The degree of unsaturation
of the fatty acids that these lipids contain determines the fluidity of the membrane
and, therefore, its proper function especially at low environmental temperatures
(Sargent et al. 1999). In most freshwater species monoethylenic and saturated fatty
acids constitute the main groups of fatty acids in neutral lipids, while phospholip-
ids contain in general higher quantities of PUFA, similar levels of saturates and
Table 7. Liver neutral fatty acids (% of total fatty acid content).
Fatty acids OO SBO OO/FO SBO/FO FO initial
14:0 2.7 2.6 3.2 2.9 2.9 2.8
15:0 0.2 0.2 0.3 0.2 0.3 0.3
16:0 15.3 14.7 18.5 16.7 16.5 16.2
16:1 3.9 2.4 3.9 4.4 5.8 5.4
16:2 0.3 0.1 0.3 0.4 0.4 0.0
18:0 3.1 3.7 3.2 2.9 2.9 2.0
16:3 0.0 0.2 0.0 0.1 0.1 0.1
18:1n-9 48.0 30.8 41.0 34.8 31.9 25.8
18:1n-7 0.0 0.4 0.0 0.0 0.6 0.3
16:4 0.6 0.2 0.8 0.5 0.4 0.7
18:2n-6 7.5 23.7 6.0 12.3 6.3 7.5
18:3n-6 0.3 0.5 0.5 0.4 0.3 0.1
18:3n-3 1.2 3.0 1.4 1.8 1.2 1.1
20:1n-9 2.7 1.9 5.0 5.2 8.0 4.4
18:4n-3 0.6 0.6 1.0 0.8 0.9 1.0
20:2n-9 0.4 0.8 0.4 0.7 0.5 0.6
20:4n-6 0.7 1.2 0.0 0.3 0.5 1.2
22:1n-11 0.5 0.3 2.6 2.7 3.6 2.2
22:1n-9 0.3 0.3 0.0 0.5 0.7 0.0
20:4n-3 0.2 0.3 0.2 0.3 0.5 0.6
20:5n-3 2.1 1.9 2.1 2.3 3.4 5.8
22:3n-6 0.1 0.2 0.5 0.5 0.2 0.2
22:4n-6 0.1 0.2 0.3 0.0 0.8 0.8
22:5n-6 0.1 0.1 0.2 0.2 0.3 0.4
22:5n-3 1.7 0.5 0.6 0.6 1.0 1.9
22:6n-3 6.5 6.0 4.8 4.7 8.4 16.3
saturated 21.2 21.2 25.3 22.7 22.6 21.6
monoenes 55.3 36.6 52.5 47.6 50.5 38.1
n-6 9.0 24.8 7.5 13.6 8.3 10.3
n-3 12.2 12.3 10.1 10.5 15.3 26.6
EPA+DHA 8.5 7.9 6.9 7.0 11.8 22.1
DHA/EPA 3.1 3.1 2.3 2.1 2.4 2.8
EPA/AA 2.8 1.6 – 9.1 6.5 4.8
n-3/n-6 1.4 0.5 1.4 0.8 1.8 2.6
469
8. lower levels of monoenes compared to the neutral lipids (Henderson and Tocher
1987). This tendency has been confirmed in previous studies for gilthead bream
(Kalogeropoulos et al. 1993; Ibeas et al. 1997) and is also followed by the fatty
acid composition of liver tissue of sea bass in the present experiments.
The nutritional influence on the lipid composition of liver was found to be mini-
mal for saturates and monoenes, in total and neutral lipids of rainbow trout (On-
Table 8. Liver polar fatty acids (% of total fatty acid content).
fatty acids OO SBO OO/FO SBO/FO FO initial population
14:0 0.8 0.7 0.8 0.7 0.8 0.9
15:0 1.2 1.9 1.5 1.1 1.2 1.5
16:0 15.0 12.4 14.9 13.4 14.4 17.1
16:1 1.2 2 1.7 1.4 1.1 2
16:2 2.4 5.0 3.3 1.7 2.9 2.0
18:0 7.3 8.3 11.9 10.8 6.5 6.3
16:3 0.3 0.7 0.8 0.3 0.0 0.7
18:1n-9 15.4 9.0 10.9 9.1 9.2 6.8
18:1n-7 1.9 2.0 0.7 2.1 2.2 1.4
16:4 0.4 0.0 0.2 0.3 0.0 0.0
18:2n-6 6.0 12.2 4.3 8.1 3.5 2.8
20:0 1.8 3.5 3.8 2.1 2.8 2.5
18:3n-6 0.3 0.0 1.3 0.3 0.3 0.0
18:3n-3 0.8 0.9 0.4 0.8 0.9 0.8
20:1n-9 1.2 1.2 1.9 1.7 2.5 1.2
18:4n-3 0.5 2.6 0.7 0.4 0.7 0.0
20:2n-9 0.6 1.2 0.4 0.6 0.6 0.8
20:4n-6 2.8 2.4 2.6 2.4 3.1 3.9
22:1n-11 0.6 0.4 0.1 0.5 1.0 0.8
22:1n-9 0.4 0.0 0.3 0.0 0.0 0.0
20:4n-3 0.3 0.0 1.9 0.3 0.4 1.6
20:5n-3 7.4 5.1 6.7 9.7 9.5 7.4
22:3n-6 1.4 0.9 1.2 1.2 2.1 1.7
22:4n-6 0.0 0.0 0.0 0.3 0.4 0.0
22:5n-6 0.6 0.0 0.4 0.5 0.6 0.8
22:5n-3 0.9 0.5 0.7 0.9 1.5 0.8
22:6n-3 27.4 23.4 22.4 26.6 30.4 31.3
saturated 26.1 23.4 33.1 27.6 25.7 28.2
monoenes 20.8 25.3 15.2 14.6 15.9 12.1
n-6 11.4 15.7 9.8 13.3 9.9 9.2
n-3 37.4 32.7 33.1 38.1 43.0 42.1
EPA+DHA 34.8 28.6 29.2 35.7 39.9 38.8
DHA/EPA 3.7 4.6 3.3 2.7 3.2 4.2
EPA/AA 2.7 2.1 2.6 4 3.1 1.9
n-3/n-6 3.3 2.1 3.4 2.9 4.3 4.6
470
9. chorhynchus mykiss) (Yu and Sinnhuber 1972; Yu et al. 1977; Castledine and Buck-
ley 1980; Green and Selivonchick 1990) and in phospholipids in the flathead grey
mullet (Mugil cephalus), (Argyropoulou et al. 1992) and gilthead sea bream (Ibeas
et al. 1996). Similarly no correlation between dietary and polar saturates and mo-
noenes was observed in the present study, although there was correlation with neu-
tral monoenes. On the contrary, the influence of dietary n-6 fatty acids on both neu-
tral and polar n-6 content was found to be strong in accordance with previous
studies for a number of marine species (Owen et al. 1972; Mosconi-Bac and Roche
Figure 1. Histological appearance of liver tissue of fish fed certain experimental diets A. Diet FO. ×200.
Normal structure of liver parenchyma. with cell membrane intact. It shows lipid infiltration due to sa-
tiation feeding in a summer period. B. Diet OO. ×400. Extended degeneration of the liver parenchyma.
471
10. 1985; Argyropoulou et al. 1992; Kalogeropoulos et al. 1993). The main represent-
ative of n-6 fatty acids in dietary lipids is linoleic acid, 18:2n-6. This is accumu-
lated largely unchanged in the lipids of marine fish due to their reduced capacity
for chain elongation and desaturation (Owen et al. 1975; Yamada et al. 1980). The
proportionally much lower transfer of this fatty acid in polar lipids for the diet con-
taining the highest soybean oil content (SBO, 32%, Table 8 & Table 9) compared
to other diets as well as the larger transfer of AA in these lipids for all diets tested
(Table 9) indicates that there exists a regulation of integration of these fatty acids
in liver phosholipids. A more effective regulation of fatty acid composition of liver
polar lipids compared to muscle polar lipids has been observed for gilthead bream
(Kalogeropoulos et al. 1993).
The EPA and DHA levels in liver polar lipids were high amounting to about
40% of the total fatty acids for the FO diet. Similar levels have been reported for
gilthead bream fed cod liver oil containing diets (Kalogeropoulos et al. 1992). In
the last study a gradual increase with dietary levels and then a stabilization at higher
dietary inclusions (more than 0.9% of the diet) was observed. The small range of
dietary values used in the present study did not allow such a possible relation to be
revealed.
Cholesterol and lipid serum levels were within the range reported by Santulli et
al. (1988) for sea bass 24 hrs after feeding low and high fat diets. The fact that the
FO diet showed the highest levels of total serum lipids, particularly in comparison
with the diets supplemented with plant oils only, in combination with the higher
body and liver lipids observed for this diet, might indicate that a better assimilation
of dietary lipids existed. The tendency for reduced body lipid storage in the case of
deficient diets (Table 5) agrees with the results of other works for freshwater fish
(Castell et al. 1972; Watanabe et al. 1974) and sea bream (Kalogeropoulos et al.
1992)
The requirements for n-3 HUFA have been determined for a number of marine
species. The levels suggested for turbot by different authors for fish of different
size are 0.57% (Leger et al. 1979), 0,8% (Gatesoupe et al. 1977) and 1.3% of the
diet (Le Milinaire et al. 1983). The requirements of red sea bream (Chrysophrys
major) in EPA and DHA were investigated by Yone (1976) and a level of at least
0.5% of the diet was found necessary for maximum growth, while yellowtail Se-
riola quinqueradiata required a level of 2% HUFA (New 1986). Similar observa-
tions on gilthead sea bream (Sparus aurata; Kalogeropoulos et al. (1992)) gave a
level of 0.9% of the diet for young fingerlings, a result confirmed by Ibeas et al.
(1996) for fish of larger size. The dietary EPA and DHA levels used in the present
study ranged from about 0.88% to 1.35%. Since no statistical differences in growth
and feed utilization among groups were observed, it could be suggested that a level
of 0.88% of the diet covers the needs of sea bass in HUFA. However the results of
tissue histology do not support such a conclusion.
Lipid degeneration of the liver tissue, present in this study for fish fed the two
lower HUFA containing diets, has been previously well documented by other au-
thors (Tacon (1985, 1992); Watanabe et al. 1989) as a result of EFA deficiency. Bac
et al. (1983) working with sea bass, sea bream and eels fed on diets similar to the
472
11. SBO used herein, reported extended cellular abnormalities and hepatocell degen-
eration as well as necrotic areas in liver parenchyma. Sea bream fingerlings fed
diets deficient in essential fatty acids showed similar liver problems (Alexis et al.
1993). Other reports on pathological phenomena concerning essential fatty acid de-
ficiency were heart muscle lesions in salmon (Bell et al. 1991), haemorhages in
parenchymatic organs in gilthead sea bream (Alexis et al. 1993) and infection-de-
terioration of gill epithelium in turbot (Bell et al. 1985). The hyperplasia of gill
epithelium observed in the present study occurred only in fish fed the high in n-9
OO diet and was probably as a result of infection by external parasites. The latter
may be an indication of a general decrease of the resistance of the organism against
pathogens. Bell et al. (1985) suggested that this kind of extended changes in the
gill structure should cause severe problems in respiration and osmoregulation.
The previous pathological symptoms were absent in the diet containing 1.35%
EPA+DHA. However an extended lipid infiltration of the liver was still apparent.
This extensive infiltration is present in a large number of samples of liver tissue of
sea bass obtained from fish raised commercially. Other studies have also shown a
high lipid level in the liver of sea bass, more than 30%, fed practical diets contain-
ing high levels of n-3 HUFA (Mettailer et al. 1981; McClelland et al. 1995).
Mosconi-Bac (1987) suggested that a true nutritional pathology might be present
due to other structural modifications observed as well, by electron microscopy. The
extensive lipid infiltration of the liver might be a result of the intensive feeding of
the fish or of some other imbalance of the fatty acid composition of the diet. In a
number of experiments concerning sea bass broodstock it was shown that not only
the absolute amounts n-3 and n-6 polyunsaturates but also their ratios were impor-
tant for egg quality since broodstock fed diets containing AA levels, higher than
normally found in dry commercial pellets used for Mediterranean fish, produced
higher quality eggs (Thrush et al. 1993; Bruce et al. 1999). Phospholipids of wild
sea bass and sea bream contain high levels of AA amounting to about 10% of the
total lipids (Alexis and Nengas 1996) and optimum performance of sea bass larvae
is also indicated for dietary DHA/EPA ratio of 2:1 and EPA/AA ratio of 1:1 (Sar-
gent et al. 1999). The first ratio was approached by the plant oil containing diets
(Table 2), due to the high content of the fish meal oil in DHA, but was reduced
with the addition of fish oil. Any effect of this favorable ratio would have been
obscured by the low n-3 levels of these diets. A study of the effect of diets con-
taining different ratios of EPA, DHA and AA on the general performance of sea
bass during fattening deserves further experimentation.
In conclusion, the results of the present paper indicate that sea bass has a mini-
mum requirement of 1,35% EPA+DHA for optimum performance. Levels lower
than this and up to about 0.9% of the diet do not affect appreciably growth char-
acteristics and body composition but produce histological alternations in liver tis-
sue. In certain cases, when a large amount of monounsaturates is present in the diet
gill tissue is also affected. Lipid deposition in liver tissue is high even at the high-
est n-3 dietary inclusion. Sea bass requirements in fatty acids require however fur-
ther studies taking into account the finding concerning the fatty acid composition
473
12. of wild fish and the beneficial effect that AA exerts on egg quality and larval per-
formance of the same species.
References
Alexis M.N., Papaparaskeva-Papoutsoglou E. and Theochari V. 1985. Formulation of practical diets for
rainbow trout (Salmo gairdneri) made by partial or complete substitution of fish meal by poultry
by-products and certain plant by-products. Aquaculture 50: 61–73.
Alexis M.N. and Nengas I. 1996. Nutritional requirements of marine fish. In: Fish Feed Production Unit.
Experimental Production of Dry Pellets for Fish. (Technical Report to the NATO SFS Programme).
NCMR, Athens, pp. 124–243 Fish Feed Production Unit. Experimental Production of Dry Pellets
for Fish. (Technical Report to the NATO SFS Programme). NCMR, Athens.
Alexis M., Karanikolas K. and Anastasopoulou G. 1993. Results of fatty acid deficiency on the pathol-
ogy of the gilthead sea bream. In: Proceedings of the 4th Panhellenic Symposium on Oceanography
and Fisheries, Rhodes Isl., Greece., pp. 448–451.
Williams S. (ed.)AOAC (Association of Official Analytical Chemists) 1984. In: Official Methods of
Analysis. 14th edn. AOAC, Washington, DC, USA, 1018pp.
Argyropoulou V., Kalogeropoulos N. and Alexis M.N. 1992. Effect of dietary lipids on growth and tis-
sue fatty acid composition of grey mullet (Mugil cephalus). Comparative Biochemistry and Physi-
ology 101A: 129–135.
Bac N., Biagianti S. and Brusle B. 1983. Étude cytologique ultrastructurale des anomalies hépatic du
loup, de l’ daurade et de l’ anguille, induites par une alimentation artificielle. Bases Biol. Aquacult.,
Monpellier 1983, INFREMER. Actes Colloques 1: 473–484.
Bell M.V., Henderson R.J., Pirie B.J.S. and Sargent J.R. 1985. Effects of dietary polyunsaturated fatty
acid deficiencies on mortality, growth and gill structure in the turbot Scophthalmus maximus.. Jour-
nal of Fish Biology 26: 181–191.
Bell J.C., McVicar A.H., Park M.T. and Sargent J.R. 1991. High dietary linolenic acid affects the fatty
acid composition of individual phospholipids from tissues of Atlantic salmon (Salmo salar): asso-
ciation with stress susceptibility and cardiac lesion. Journal of Nutrition 121: 1163–1172.
Bell J.G., Farndale B.M., Bruce M., Navas J.M. and Carrillo M. 1997. Effects of broodstock dietary
lipid on fatty acid composition of eggs from sea bass (Dicentrarchus labrax). Aquaculture 149:
107–109.
Bruce M.P., Oyen F., Bell J.G., Asturiano J.F., Farndale B.M., Ramos J. et al. 1999. Development of
broodstock diet for the European sea bass (Dicentrarchus labrax) with special emphasis on the im-
portance of n-3 and n-6 HUFA to reproductive performance. Aquaculture 177: 85–97.
Castell J.D., Sinnhuber R.O., Lee D.J. and Wales J.H. 1972. Essential fatty acids in the diet of rainbow
trout (Salmo gairdneri): physiological symptoms of EFA deficiency. Journal of Nutrition 102: 87–
92.
Castledine A.J. and Buckley T.J. 1980. Distribution and mobility of n-3 fatty acids in rainbow trout fed
varying levels and types of dietary lipid. Journal of Nutrition 110: 675–685.
Csengeri I., Tulli F., Tibaldi E., Franci C. and Lanari D. 1996. Effects of various dietary oils on the
metabolism of fatty acid (PUFA) in common sea bass (Dicentrarchus labrax) reared in recirculation
system. In: Csengeri I., Szító A., Papp Z.G. and Tacon A.G.J. (eds), Proceedings of EIFAC Work-
shop: Fish and Crustacean nutrition methodology and research for semi-intensive pond-based farm-
ing systems. HAKI, Szarvas, Hungary, pp. 119–136.
Cullins C.F.A. and Dunn W.L. (eds) 1981. Handbook of histopathological and histochemical techniques.
Butterworth & Co. Publ. Ltd.
Di Bella G., Genovese L., Dugo G. and Amerio M. 1993. Fatty acid composition of the liver of the
reared european sea bass, Dicentrarchus labrax L., in relation to three different diets and to the tem-
perature. Oebalia 19: 57–66.
474
13. Gatesoupe F.L., Leger C., Metailler R. and Luquet P. 1977. Alimentation lipidique du turbot (Scoph-
thalmus maximus L.) I. Influence de la longueur de chaine des acides gras de la série 3. Annales
Hydrobiologie 8: 89–97.
Green D.H.S. and Selivonchick D.P. 1990. Effects of dietary vegetable, animal and marine lipids on
muscle lipid and hematology of rainbow trout (Oncorhynchus mykiss). Aquaculture 89: 165–182.
Henderson R.J. and Tocher D.R. 1987. The lipid composition and biochemistry of freshwater fish.
Progress in Lipid Research 26: 281–347.
Hidalgo F. and Alliot E. 1988. Influence of water temperature on protein requirement and protein utili-
zation in juvenile sea bass, Dicentrarchus labrax. Aquaculture 72: 115–129.
Ibeas C., Cejas J., Gomez T., Jeres S. and Lorenzo A. 1996. Influence of dietary n-3 highly unsaturated
fatty acids levels on juvenile gilthead sea bream (Sparus aurata) growth and tissue fatty acid com-
position. Aquaculture 142: 221–235.
Ibeas C., Cejas J.R., Fores R., Badia P., Gomez T. and Lorenzo Hernández A. 1997. Influence of eicosa-
pentaenoic to docosahexaenoic acid ratio (EPA/DHA) of dietary lipids on growth and fatty acid
composition of gilthead sea bream (Sparus aurata) juveniles. Aquaculture 150: 91–102.
Kalogeropoulos N., Alexis M.N. and Henderson R.J. 1992. Effects of dietary soybean and cod-liver oil
levels on growth and body composition of gilthead bream (Sparus aurata). Aquaculture 104: 293–
308.
Kalogeropoulos N., Alexis M.N. and Henderson R.J. 1993. Effect of dietary lipids on tissue fatty acid
composition of gilthead bream (Sparus aurata). In: Kaushik S.J. and Luquet P. (eds), Fish Nutrition
in Practice. INRA, Paris, pp. 257–267.
Leger C., Gatesoupe F.J., Mettailler R., Luquet P. and Fremont L. 1979. Effects of dietary fatty acids
differing by chain length and series on the growth and lipid composition of turbot (Scophthalmus
maximus L.). Comparative Biochemistry and Physiology 64B: 345–350.
Lemaire P., Drai P., Mathieu A., Lemaire S., Carriere S., Giudicelli J. et al. 1991. Changes with different
diets in plasma enzymes (GOT, GPT, LDH, ALP) and plasma lipids (cholesterol, triglycerides) of
sea bass (Dicentrarchus labrax). Aquaculture 93: 63–75.
Le Milinaire C., Gatesoupe F.J. and Stephen G. 1983. Approche du besoin quantitatif en acides gras
longs polyinsaturés de la série n-3 chez la larve de turbot (Scophthalmus maximus L.). Comptes
Rendus de l’Académie de Sciences, Paris (Série III) 296: 917–920.
McClelland G., Zwingelstein G., Weber J.M. and Brichon G. 1995. Lipid composition of tissue and
plasma in two mediterranean fishes, the gilt-head sea bream (Chrysophrys auratus) and the Euro-
pean sea bass (Dicentrarchus labrax). Canadian Journal of Fisheries and Aquatic Sciences 52: 161–
170.
Messager J.L., Stephan G., Quentel C. and Baudin Laurencin F. 1992. Effects of dietary oxidized fish
oil and antioxidant deficiency on histology, haematology, tissue and plasma biochemistry of sea bass
Dicentrarchus labrax. Aquatic Living Resources 5: 205–214.
Mettailer R., Aldrin J.F., Messager J.L., Mevel G. and Stephan G. 1981. Feeding of European sea bass
(Dicentrarchus labrax). Role of protein level and energy source. Journal of the World Mariculture
Society 12: 117–118.
Mosconi-Bac N. 1987. Hepatic disturbances induced by an artificial feed in the sea bass (Dicentrarchus
labrax) during the first year of life. Aquaculture 67: 93–99.
Mosconi-Bac N. and Roche N. 1985. Perturbation hépatique structurales et métaboliques induites par
une alimentation artificielle dans le foie de loup (Dicentrarchus labrax) de la class 0. Contrat No
83/2931. CNEXO, pp. 35.
Murat J.C. and Serfaty A. 1974. A simple enzymatic determination of polysaccharide (glycogen) con-
tent of the animal tissues. Clinical Chemistry 20: 1576–1577.
Navarro J.C., McEvoy L.A., Amat F. and Sargent J.R. 1995. Effects of diet on fatty acid composition of
body zones in larvae of the sea bass Dicentrarchus labrax: a chemometric study. Marine Biology
124: 177–183.
Navarro J.C., McEvoy L.A., Bell M.V., Amat F., Hontoria F. and Sargent J.R. 1997. Effect of different
dietary levels of docosahexaenoic acid (DHA, 22:6-3) on the DHA composition of lipid classes in
sea bass larvae eyes. Aquaculture International 5: 509–516.
475
14. Navas J.M., Bruce M., Thrush M., Farndale B.M., Bromage N., Zanuy S. et al. 1997. The impact of
seasonal alternation in the lipid composition of broodstock diets on egg quality in the European sea
bass. Journal of Fish Biology 51: 760–773.
Navas J.M., Mananos E., Thrush M., Ramos J., Zanuy S., Carrillo M. et al. 1998. Effect of dietary lipid
composition on vitellogenin, 17-estradiol and gonadotropin plasma levels and spawning perform-
ance in captive sea bass (Dicentrarchus labrax L.). Aquaculture 165: 65–79.
New M.B. 1986. Aquaculture diets of postlarval marine fish of the super-family Percoidae, with special
reference to sea basses, sea breams, groupers and yellowtail: a review. Kuwait Bulletin of Marine
Science 7: 75–148.
Owen J.M., Adron J.W., Sargent J.R. and Cowey C.B. 1972. Studies on the nutrition of marine flatfish.
The effect of dietary fatty acids on the tissue fatty acids of plaice Pleuronectes platessa. Marine
Biology 13: 160–166.
Owen J.M., Adron J.W., Middleton C. and Cowey C.B. 1975. Elongation and desaturation of dietary
fatty acids in turbot Scophthalmus maximus, and rainbow trout Salmo gairdneri. Lipids 10: 528–
531.
Perez L., Gonzalez H., Jover M. and Fernandez-Carmona J. 1997. Growth of European sea bass finger-
lings (Dicentrarchus labrax) fed extruded diets containing varying levels of protein, lipid and car-
bohydrate. Aquaculture 156: 183–193.
Santulli A., Modica A., Curatolo A. and D’Amelio V. 1988. Carnitine administration to sea bass (Di-
centrarchus labrax L.) during feeding on a fat diet: Modification of plasma lipid levels and lipopro-
tein pattern. Aquaculture 68: 345–351.
Sargent J., Henderson R.J. and Tocher D.R. 1989. The lipids. In: Halver J.E. (ed.), Fish Nutrition. Vol.
2. Academic Press, New York, pp. 154–218.
Sargent J.R., Bell J.G., Bell M.V., Henderson R.J. and Tocher D.R. 1995. Requirement criteria for es-
sential fatty acids. Journal of Applied Ichthyology 11: 183–198.
Sargent J., Bell G., McEvoy L., Tocher D. and Estevez A. 1999. Recent developments in the essential
fatty acid nutrition of fish. Aquaculture 177: 191–199.
Tacon A.G.J. 1985. Nutritional Fish Pathology. Publication of the “Aquaculture Development and Co-
ordination Programme”, ADCP/REP/85/22. FAO, Rome, pp. 33.
Tacon A.G.J. 1992. Nutritional Fish Pathology. Morphological signs of nutrient deficiency and toxicity
in farmed fish. FAO Fisheries Technical Paper 330., pp. 75.
Thrush M., Navas J.M., Ramos J., Bromage N., Carrillo M. and Zanuy S. 1993. The effect of artificial
diets on lipid class and total fatty acid composition of cultured sea bass (Dicentrarchus labrax) eggs.
In: Actas del IV Congreso Nacional de Acuicultura. Centro de Investigaciones Marinas, Pontevedra,
Spain, pp. 37–42.
Wanakowat J., Boonyaratpalin M. and Watanabe T. 1993. Essential fatty acid requirement of juvenile
seabass. In: Kaushik S.J. and Luquet P. (eds), Fish Nutrition in Practice. INRA, Paris, pp. 807–817.
Watanabe T., Takashima F. and Ogino C. 1974. Effect of dietary methyl linolenate on growth of rainbow
trout. Bulletin of the Japanese Society of Scientific Fisheries 40: 181–188.
Watanabe T., Thongrod S., Takeuchi T., Satoh S., Kubota S.S., Fujimaki Y. et al. 1989. Effect of dietary
n-3 fatty acids on growth, fatty acid and histological changes of whitefish Coregonus lavaretus ma-
raena. Nippon Suisan Gakkaishi 55: 1977–1982.
Yamada K., Kobayashi K. and Yone Y. 1980. Conversion of linolenic acid to n-3-highly unsaturated
fatty acids in marine fishes and rainbow trout. Bulletin of the Japanese Society of Scientific Fisher-
ies 40: 181–188.
Yone Y. 1976. Nutritional studies of red sea bream. In: Price K.S., Shaw W.N. and Danberg K.S. (eds),
Proceedings of International Conference on Aquaculture Nutrition. University of Delaware, pp. 39–
64.
Yu T.C. and Sinnhuber R.O. 1972. Effect of dietary linolenic acid and docosahexaenoic acid on growth
and fatty acid composition of rainbow trout (Salmo gairdneri). Lipids 7: 450–454.
Yu T.C., Sinnhuber R.O. and Putnam G.B. 1977. Effect of dietary lipids on fatty acid composition of
body lipid in rainbow trout. Lipids 12: 495–499.
476