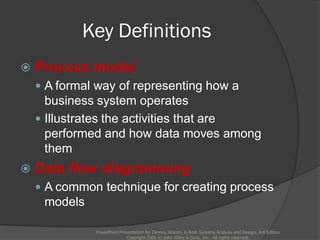
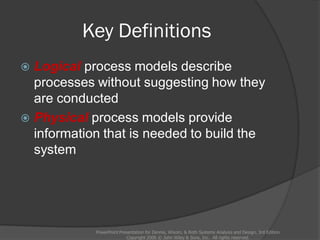
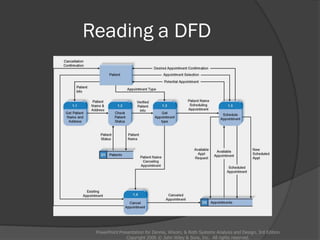
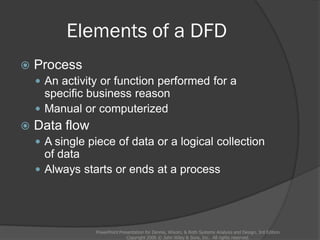
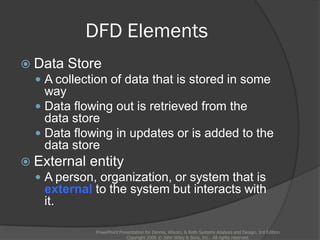
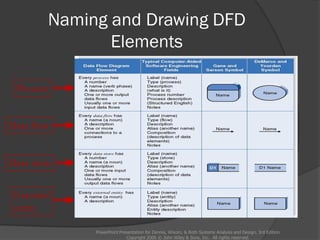
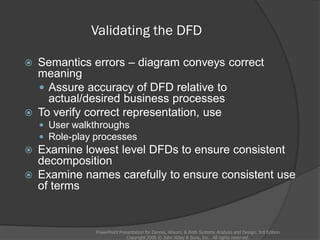
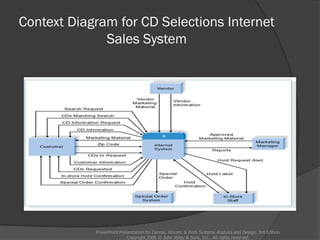
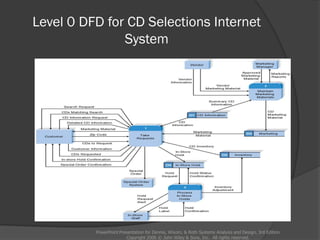
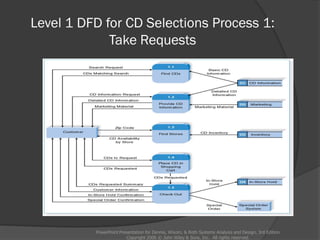
Alan Dennis, Barbara Haley Wixom, and Roberta Roth
John Wiley & Sons, Inc.
Slides by Cristina G. Rivera
Bataan Peninsula State University
PowerPoint Presentation for Dennis, Wixom, & Roth Systems Analysis and Design, 3rd Edition
Copyright 2006 © John Wiley & Sons, Inc. All rights reserved.
Chapter 5
PowerPoint Presentation for Dennis, Wixom, & Roth Systems Analysis and Design, 3rd Edition
Copyright 2006 © John Wiley & Sons, Inc. All rights reserved.
Key Definitions
 Process model
 A formal way of representing how a
business system operates
 Illustrates the activities that are
performed and how data moves among
them
 Data flow diagramming
 A common technique for creating process
models
PowerPoint Presentation for Dennis, Wixom, & Roth Systems Analysis and Design, 3rd Edition
Copyright 2006 © John Wiley & Sons, Inc. All rights reserved.
Key Definitions
 Logical process models describe
processes without suggesting how they
are conducted
 Physical process models provide
information that is needed to build the
system
PowerPoint Presentation for Dennis, Wixom, & Roth Systems Analysis and Design, 3rd Edition
Copyright 2006 © John Wiley & Sons, Inc. All rights reserved.
PowerPoint Presentation for Dennis, Wixom, & Roth Systems Analysis and Design, 3rd Edition
Copyright 2006 © John Wiley & Sons, Inc. All rights reserved.
Reading a DFD
PowerPoint Presentation for Dennis, Wixom, & Roth Systems Analysis and Design, 3rd Edition
Copyright 2006 © John Wiley & Sons, Inc. All rights reserved.
Elements of a DFD
 Process
 An activity or function performed for a
specific business reason
 Manual or computerized
 Data flow
 A single piece of data or a logical collection
of data
 Always starts or ends at a process
PowerPoint Presentation for Dennis, Wixom, & Roth Systems Analysis and Design, 3rd Edition
Copyright 2006 © John Wiley & Sons, Inc. All rights reserved.
DFD Elements
 Data Store
 A collection of data that is stored in some
way
 Data flowing out is retrieved from the
data store
 Data flowing in updates or is added to the
data store
 External entity
 A person, organization, or system that is
external to the system but interacts with
it.
PowerPoint Presentation for Dennis, Wixom, & Roth Systems Analysis and Design, 3rd Edition
Copyright 2006 © John Wiley & Sons, Inc. All rights reserved.
Naming and Drawing DFD
Elements
PowerPoint Presentation for Dennis, Wixom, & Roth Systems Analysis and Design, 3rd Edition
Copyright 2006 © John Wiley & Sons, Inc. All rights reserved.
Process
Data flow
Data store
External
entity
Using a DFD to Define Business
Processes
 Business processes are too complex to
be shown on a single DFD
 Decomposition is the process of
representing the system in a hierarchy
of DFD diagrams
 Child diagrams show a portion of the parent
diagram in greater detail
PowerPoint Presentation for Dennis, Wixom, & Roth Systems Analysis and Design, 3rd Edition
Copyright 2006 © John Wiley & Sons, Inc. All rights reserved.
Key Definition
PowerPoint Presentation for Dennis, Wixom, & Roth Systems Analysis and Design, 3rd Edition
Copyright 2006 © John Wiley & Sons, Inc. All rights reserved.
 Balancing involves insuring that information
presented at one level of a DFD is
accurately represented in the next level
DFD.
Relationship among Levels of
DFDs
PowerPoint Presentation for Dennis, Wixom, & Roth Systems Analysis and Design, 3rd Edition
Copyright 2006 © John Wiley & Sons, Inc. All rights reserved.
Context diagram
Level 0 diagram
Level 1 diagram
Level 2 diagram
Context Diagram
PowerPoint Presentation for Dennis, Wixom, & Roth Systems Analysis and Design, 3rd Edition
Copyright 2006 © John Wiley & Sons, Inc. All rights reserved.
 First DFD in every business process
 Shows the context into which the
business process fits
 Shows the overall business process as
just one process (process 0)
 Shows all the external entities that
receive information from or contribute
information to the system
Level 0 Diagram
PowerPoint Presentation for Dennis, Wixom, & Roth Systems Analysis and Design, 3rd Edition
Copyright 2006 © John Wiley & Sons, Inc. All rights reserved.
 Shows all the major processes that
comprise the overall system – the
internal components of process 0
 Shows how the major processes are
interrelated by data flows
 Shows external entities and the major
processes with which they interact
 Adds data stores
Level 1 Diagrams
PowerPoint Presentation for Dennis, Wixom, & Roth Systems Analysis and Design, 3rd Edition
Copyright 2006 © John Wiley & Sons, Inc. All rights reserved.
 Generally, one level 1 diagram is created for
every major process on the level 0 diagram
 Shows all the internal processes that comprise
a single process on the level 0 diagram
 Shows how information moves from and to
each of these processes
 If a parent process is decomposed into, for
example, three child processes, these three
child processes wholly and completely make
up the parent process
Level 2 Diagrams
PowerPoint Presentation for Dennis, Wixom, & Roth Systems Analysis and Design, 3rd Edition
Copyright 2006 © John Wiley & Sons, Inc. All rights reserved.
 Shows all processes that comprise a single
process on the level 1 diagram
 Shows how information moves from and to
each of these processes
 Level 2 diagrams may not be needed for all
level 1 processes
 Correctly numbering each process helps the
user understand where the process fits into
the overall system
Alternative Data Flows
PowerPoint Presentation for Dennis, Wixom, & Roth Systems Analysis and Design, 3rd Edition
Copyright 2006 © John Wiley & Sons, Inc. All rights reserved.
 Where a process can produce different data
flows given different conditions
 We show both data flows and use the process
description to explain why they are alternatives
 Tip -- alternative data flows often accompany
processes with IF statements
Your Turn
 At this point in the process it is easy to lose
track of the “big picture”.
 Describe the difference between data
flows, data stores, and processes.
 Describe in your own words the
relationship between the DFD and the
ultimate new application being developed.
PowerPoint Presentation for Dennis, Wixom, & Roth Systems Analysis and Design, 3rd Edition
Copyright 2006 © John Wiley & Sons, Inc. All rights reserved.
Process Descriptions
PowerPoint Presentation for Dennis, Wixom, & Roth Systems Analysis and Design, 3rd Edition
Copyright 2006 © John Wiley & Sons, Inc. All rights reserved.
 Text-based process descriptions provide more
information about the process than the DFD
alone
 If the logic underlying the process is quite
complex, more detail may be needed in the
form of
 Structured English
 Decision trees
 Decision tables
PowerPoint Presentation for Dennis, Wixom, & Roth Systems Analysis and Design, 3rd Edition
Copyright 2006 © John Wiley & Sons, Inc. All rights reserved.
Integrating Scenario Descriptions
 DFDs start with the use cases and
requirements definition
 Generally, the DFDs integrate the use
cases
 Names of use cases become
processes
 Inputs and outputs become data flows
 “Small” data inputs and outputs are
combined into a single flow
PowerPoint Presentation for Dennis, Wixom, & Roth Systems Analysis and Design, 3rd Edition
Copyright 2006 © John Wiley & Sons, Inc. All rights reserved.
Steps in Building DFDs
 Build the context diagram
 Create DFD fragments for each use case
 Organize DFD fragments into level 0
diagram
 Decompose level 0 processes into level 1
diagrams as needed; decompose level 1
processes into level 2 diagrams as needed;
etc.
 Validate DFDs with user to ensure
completeness and correctness
PowerPoint Presentation for Dennis, Wixom, & Roth Systems Analysis and Design, 3rd Edition
Copyright 2006 © John Wiley & Sons, Inc. All rights reserved.
Creating the Context Diagram
 Draw one process representing the
entire system (process 0)
 Find all inputs and outputs listed at
the top of the use cases that come
from or go to external entities; draw
as data flows
 Draw in external entities as the
source or destination of the data flows
PowerPoint Presentation for Dennis, Wixom, & Roth Systems Analysis and Design, 3rd Edition
Copyright 2006 © John Wiley & Sons, Inc. All rights reserved.
A Context Diagram Example
PowerPoint Presentation for Dennis, Wixom, & Roth Systems Analysis and Design, 3rd Edition
Copyright 2006 © John Wiley & Sons, Inc. All rights reserved.
Creating DFD Fragments
 Each use case is converted into one DFD
fragment
 Number the process the same as the use
case number
 Change process name into verb phrase
 Design the processes from the viewpoint of
the organization running the system
PowerPoint Presentation for Dennis, Wixom, & Roth Systems Analysis and Design, 3rd Edition
Copyright 2006 © John Wiley & Sons, Inc. All rights reserved.
Creating DFD Fragments
 Add data flows to show use of data
stores as sources and destinations of
data
 Layouts typically place
 processes in the center
 inputs from the left
 outputs to the right
 stores beneath the processes
PowerPoint Presentation for Dennis, Wixom, & Roth Systems Analysis and Design, 3rd Edition
Copyright 2006 © John Wiley & Sons, Inc. All rights reserved.
A DFD Fragment Example
PowerPoint Presentation for Dennis, Wixom, & Roth Systems Analysis and Design, 3rd Edition
Copyright 2006 © John Wiley & Sons, Inc. All rights reserved.
Creating the Level 0 Diagram
 Combine the set of DFD fragments
into one diagram
 Generally move from top to bottom,
left to right
 Minimize crossed lines
 Iterate as needed
 DFDs are often drawn many times
before being finished, even with very
experienced systems analysts
PowerPoint Presentation for Dennis, Wixom, & Roth Systems Analysis and Design, 3rd Edition
Copyright 2006 © John Wiley & Sons, Inc. All rights reserved.
A Level 0 DFD Example
PowerPoint Presentation for Dennis, Wixom, & Roth Systems Analysis and Design, 3rd Edition
Copyright 2006 © John Wiley & Sons, Inc. All rights reserved.
Creating Level 1 Diagrams (and Below)
 Each use case is turned into its own DFD
 Take the steps listed on the use case and
depict each as a process on the level 1
DFD
 Inputs and outputs listed on use case
become data flows on DFD
 Include sources and destinations of data
flows to processes and stores within the
DFD
 May also include external entities for clarity
PowerPoint Presentation for Dennis, Wixom, & Roth Systems Analysis and Design, 3rd Edition
Copyright 2006 © John Wiley & Sons, Inc. All rights reserved.
Creating Level 1 Diagrams (and Below)
 When to stop decomposing DFDs?
 Ideally, a DFD has at least three processes
and no more than seven to nine.
PowerPoint Presentation for Dennis, Wixom, & Roth Systems Analysis and Design, 3rd Edition
Copyright 2006 © John Wiley & Sons, Inc. All rights reserved.
Validating the DFD
 Syntax errors – diagram follows the rules
 Assure correct DFD structure
PowerPoint Presentation for Dennis, Wixom, & Roth Systems Analysis and Design, 3rd Edition
Copyright 2006 © John Wiley & Sons, Inc. All rights reserved.
For each DFD:
Check each process for:
A unique name: action verb phrase; number; description
At least one input data flow
At least one output data flow
Output data flow names usually different than
input data flow names
Between 3 and 7 processes per DFD
Validating the DFD
For each DFD:
Check each data flow for:
A unique name: noun; description
Connects to at least one process
Shown in only one direction (no two-headed arrows)
A minimum number of crossed lines
Check each data store for:
A unique name: noun; description
At least one input data flow
At least one output data flow
Check each external entity for:
A unique name: noun; description
At least one input or output data flow
PowerPoint Presentation for Dennis, Wixom, & Roth Systems Analysis and Design, 3rd Edition
Copyright 2006 © John Wiley & Sons, Inc. All rights reserved.
Validating the DFD
Across DFDs:
Context Diagram:
Every set of DFDs must have one Context Diagram
Viewpoint:
There is a consistent viewpoint for the entire set of DFDs
Decomposition:
Every process is wholly and complete described by the
processes on its children DFDs
Balance:
Every data flow, data store, and external entity on a higher level
DFD is shown on the lower level DFD that decomposes it
No data stores or data flows appear on lower-lever DFDs that do
not appear on their parent DFD
PowerPoint Presentation for Dennis, Wixom, & Roth Systems Analysis and Design, 3rd Edition
Copyright 2006 © John Wiley & Sons, Inc. All rights reserved.
Validating the DFD
 Semantics errors – diagram conveys correct
meaning
 Assure accuracy of DFD relative to
actual/desired business processes
 To verify correct representation, use
 User walkthroughs
 Role-play processes
 Examine lowest level DFDs to ensure consistent
decomposition
 Examine names carefully to ensure consistent use
of terms
PowerPoint Presentation for Dennis, Wixom, & Roth Systems Analysis and Design, 3rd Edition
Copyright 2006 © John Wiley & Sons, Inc. All rights reserved.
A Quick Review of Decomposition for CD
Selections
PowerPoint Presentation for Dennis, Wixom, & Roth Systems Analysis and Design, 3rd Edition
Copyright 2006 © John Wiley & Sons, Inc. All rights reserved.
Context Diagram for CD Selections Internet
Sales System
PowerPoint Presentation for Dennis, Wixom, & Roth Systems Analysis and Design, 3rd Edition
Copyright 2006 © John Wiley & Sons, Inc. All rights reserved.
Level 0 DFD for CD Selections Internet
System
PowerPoint Presentation for Dennis, Wixom, & Roth Systems Analysis and Design, 3rd Edition
Copyright 2006 © John Wiley & Sons, Inc. All rights reserved.
Level 1 DFD for CD Selections Process 1:
Take Requests
PowerPoint Presentation for Dennis, Wixom, & Roth Systems Analysis and Design, 3rd Edition
Copyright 2006 © John Wiley & Sons, Inc. All rights reserved.
Summary
 The Data Flow Diagram (DFD) is an
essential tool for creating formal
descriptions of business processes.
 Use cases record the input, transformation,
and output of business processes and are
the basis for process models.
 Eliciting use cases and modeling business
processes are critically important skills for
the systems analyst to master.
PowerPoint Presentation for Dennis, Wixom, & Roth Systems Analysis and Design, 3rd Edition
Copyright 2006 © John Wiley & Sons, Inc. All rights reserved.

Process modelling

  • 1.
    Alan Dennis, BarbaraHaley Wixom, and Roberta Roth John Wiley & Sons, Inc. Slides by Cristina G. Rivera Bataan Peninsula State University PowerPoint Presentation for Dennis, Wixom, & Roth Systems Analysis and Design, 3rd Edition Copyright 2006 © John Wiley & Sons, Inc. All rights reserved.
  • 2.
    Chapter 5 PowerPoint Presentationfor Dennis, Wixom, & Roth Systems Analysis and Design, 3rd Edition Copyright 2006 © John Wiley & Sons, Inc. All rights reserved.
  • 3.
    Key Definitions  Processmodel  A formal way of representing how a business system operates  Illustrates the activities that are performed and how data moves among them  Data flow diagramming  A common technique for creating process models PowerPoint Presentation for Dennis, Wixom, & Roth Systems Analysis and Design, 3rd Edition Copyright 2006 © John Wiley & Sons, Inc. All rights reserved.
  • 4.
    Key Definitions  Logicalprocess models describe processes without suggesting how they are conducted  Physical process models provide information that is needed to build the system PowerPoint Presentation for Dennis, Wixom, & Roth Systems Analysis and Design, 3rd Edition Copyright 2006 © John Wiley & Sons, Inc. All rights reserved.
  • 5.
    PowerPoint Presentation forDennis, Wixom, & Roth Systems Analysis and Design, 3rd Edition Copyright 2006 © John Wiley & Sons, Inc. All rights reserved.
  • 6.
    Reading a DFD PowerPointPresentation for Dennis, Wixom, & Roth Systems Analysis and Design, 3rd Edition Copyright 2006 © John Wiley & Sons, Inc. All rights reserved.
  • 7.
    Elements of aDFD  Process  An activity or function performed for a specific business reason  Manual or computerized  Data flow  A single piece of data or a logical collection of data  Always starts or ends at a process PowerPoint Presentation for Dennis, Wixom, & Roth Systems Analysis and Design, 3rd Edition Copyright 2006 © John Wiley & Sons, Inc. All rights reserved.
  • 8.
    DFD Elements  DataStore  A collection of data that is stored in some way  Data flowing out is retrieved from the data store  Data flowing in updates or is added to the data store  External entity  A person, organization, or system that is external to the system but interacts with it. PowerPoint Presentation for Dennis, Wixom, & Roth Systems Analysis and Design, 3rd Edition Copyright 2006 © John Wiley & Sons, Inc. All rights reserved.
  • 9.
    Naming and DrawingDFD Elements PowerPoint Presentation for Dennis, Wixom, & Roth Systems Analysis and Design, 3rd Edition Copyright 2006 © John Wiley & Sons, Inc. All rights reserved. Process Data flow Data store External entity
  • 10.
    Using a DFDto Define Business Processes  Business processes are too complex to be shown on a single DFD  Decomposition is the process of representing the system in a hierarchy of DFD diagrams  Child diagrams show a portion of the parent diagram in greater detail PowerPoint Presentation for Dennis, Wixom, & Roth Systems Analysis and Design, 3rd Edition Copyright 2006 © John Wiley & Sons, Inc. All rights reserved.
  • 11.
    Key Definition PowerPoint Presentationfor Dennis, Wixom, & Roth Systems Analysis and Design, 3rd Edition Copyright 2006 © John Wiley & Sons, Inc. All rights reserved.  Balancing involves insuring that information presented at one level of a DFD is accurately represented in the next level DFD.
  • 12.
    Relationship among Levelsof DFDs PowerPoint Presentation for Dennis, Wixom, & Roth Systems Analysis and Design, 3rd Edition Copyright 2006 © John Wiley & Sons, Inc. All rights reserved. Context diagram Level 0 diagram Level 1 diagram Level 2 diagram
  • 13.
    Context Diagram PowerPoint Presentationfor Dennis, Wixom, & Roth Systems Analysis and Design, 3rd Edition Copyright 2006 © John Wiley & Sons, Inc. All rights reserved.  First DFD in every business process  Shows the context into which the business process fits  Shows the overall business process as just one process (process 0)  Shows all the external entities that receive information from or contribute information to the system
  • 14.
    Level 0 Diagram PowerPointPresentation for Dennis, Wixom, & Roth Systems Analysis and Design, 3rd Edition Copyright 2006 © John Wiley & Sons, Inc. All rights reserved.  Shows all the major processes that comprise the overall system – the internal components of process 0  Shows how the major processes are interrelated by data flows  Shows external entities and the major processes with which they interact  Adds data stores
  • 15.
    Level 1 Diagrams PowerPointPresentation for Dennis, Wixom, & Roth Systems Analysis and Design, 3rd Edition Copyright 2006 © John Wiley & Sons, Inc. All rights reserved.  Generally, one level 1 diagram is created for every major process on the level 0 diagram  Shows all the internal processes that comprise a single process on the level 0 diagram  Shows how information moves from and to each of these processes  If a parent process is decomposed into, for example, three child processes, these three child processes wholly and completely make up the parent process
  • 16.
    Level 2 Diagrams PowerPointPresentation for Dennis, Wixom, & Roth Systems Analysis and Design, 3rd Edition Copyright 2006 © John Wiley & Sons, Inc. All rights reserved.  Shows all processes that comprise a single process on the level 1 diagram  Shows how information moves from and to each of these processes  Level 2 diagrams may not be needed for all level 1 processes  Correctly numbering each process helps the user understand where the process fits into the overall system
  • 17.
    Alternative Data Flows PowerPointPresentation for Dennis, Wixom, & Roth Systems Analysis and Design, 3rd Edition Copyright 2006 © John Wiley & Sons, Inc. All rights reserved.  Where a process can produce different data flows given different conditions  We show both data flows and use the process description to explain why they are alternatives  Tip -- alternative data flows often accompany processes with IF statements
  • 18.
    Your Turn  Atthis point in the process it is easy to lose track of the “big picture”.  Describe the difference between data flows, data stores, and processes.  Describe in your own words the relationship between the DFD and the ultimate new application being developed. PowerPoint Presentation for Dennis, Wixom, & Roth Systems Analysis and Design, 3rd Edition Copyright 2006 © John Wiley & Sons, Inc. All rights reserved.
  • 19.
    Process Descriptions PowerPoint Presentationfor Dennis, Wixom, & Roth Systems Analysis and Design, 3rd Edition Copyright 2006 © John Wiley & Sons, Inc. All rights reserved.  Text-based process descriptions provide more information about the process than the DFD alone  If the logic underlying the process is quite complex, more detail may be needed in the form of  Structured English  Decision trees  Decision tables
  • 20.
    PowerPoint Presentation forDennis, Wixom, & Roth Systems Analysis and Design, 3rd Edition Copyright 2006 © John Wiley & Sons, Inc. All rights reserved.
  • 21.
    Integrating Scenario Descriptions DFDs start with the use cases and requirements definition  Generally, the DFDs integrate the use cases  Names of use cases become processes  Inputs and outputs become data flows  “Small” data inputs and outputs are combined into a single flow PowerPoint Presentation for Dennis, Wixom, & Roth Systems Analysis and Design, 3rd Edition Copyright 2006 © John Wiley & Sons, Inc. All rights reserved.
  • 22.
    Steps in BuildingDFDs  Build the context diagram  Create DFD fragments for each use case  Organize DFD fragments into level 0 diagram  Decompose level 0 processes into level 1 diagrams as needed; decompose level 1 processes into level 2 diagrams as needed; etc.  Validate DFDs with user to ensure completeness and correctness PowerPoint Presentation for Dennis, Wixom, & Roth Systems Analysis and Design, 3rd Edition Copyright 2006 © John Wiley & Sons, Inc. All rights reserved.
  • 23.
    Creating the ContextDiagram  Draw one process representing the entire system (process 0)  Find all inputs and outputs listed at the top of the use cases that come from or go to external entities; draw as data flows  Draw in external entities as the source or destination of the data flows PowerPoint Presentation for Dennis, Wixom, & Roth Systems Analysis and Design, 3rd Edition Copyright 2006 © John Wiley & Sons, Inc. All rights reserved.
  • 24.
    A Context DiagramExample PowerPoint Presentation for Dennis, Wixom, & Roth Systems Analysis and Design, 3rd Edition Copyright 2006 © John Wiley & Sons, Inc. All rights reserved.
  • 25.
    Creating DFD Fragments Each use case is converted into one DFD fragment  Number the process the same as the use case number  Change process name into verb phrase  Design the processes from the viewpoint of the organization running the system PowerPoint Presentation for Dennis, Wixom, & Roth Systems Analysis and Design, 3rd Edition Copyright 2006 © John Wiley & Sons, Inc. All rights reserved.
  • 26.
    Creating DFD Fragments Add data flows to show use of data stores as sources and destinations of data  Layouts typically place  processes in the center  inputs from the left  outputs to the right  stores beneath the processes PowerPoint Presentation for Dennis, Wixom, & Roth Systems Analysis and Design, 3rd Edition Copyright 2006 © John Wiley & Sons, Inc. All rights reserved.
  • 27.
    A DFD FragmentExample PowerPoint Presentation for Dennis, Wixom, & Roth Systems Analysis and Design, 3rd Edition Copyright 2006 © John Wiley & Sons, Inc. All rights reserved.
  • 28.
    Creating the Level0 Diagram  Combine the set of DFD fragments into one diagram  Generally move from top to bottom, left to right  Minimize crossed lines  Iterate as needed  DFDs are often drawn many times before being finished, even with very experienced systems analysts PowerPoint Presentation for Dennis, Wixom, & Roth Systems Analysis and Design, 3rd Edition Copyright 2006 © John Wiley & Sons, Inc. All rights reserved.
  • 29.
    A Level 0DFD Example PowerPoint Presentation for Dennis, Wixom, & Roth Systems Analysis and Design, 3rd Edition Copyright 2006 © John Wiley & Sons, Inc. All rights reserved.
  • 30.
    Creating Level 1Diagrams (and Below)  Each use case is turned into its own DFD  Take the steps listed on the use case and depict each as a process on the level 1 DFD  Inputs and outputs listed on use case become data flows on DFD  Include sources and destinations of data flows to processes and stores within the DFD  May also include external entities for clarity PowerPoint Presentation for Dennis, Wixom, & Roth Systems Analysis and Design, 3rd Edition Copyright 2006 © John Wiley & Sons, Inc. All rights reserved.
  • 31.
    Creating Level 1Diagrams (and Below)  When to stop decomposing DFDs?  Ideally, a DFD has at least three processes and no more than seven to nine. PowerPoint Presentation for Dennis, Wixom, & Roth Systems Analysis and Design, 3rd Edition Copyright 2006 © John Wiley & Sons, Inc. All rights reserved.
  • 32.
    Validating the DFD Syntax errors – diagram follows the rules  Assure correct DFD structure PowerPoint Presentation for Dennis, Wixom, & Roth Systems Analysis and Design, 3rd Edition Copyright 2006 © John Wiley & Sons, Inc. All rights reserved. For each DFD: Check each process for: A unique name: action verb phrase; number; description At least one input data flow At least one output data flow Output data flow names usually different than input data flow names Between 3 and 7 processes per DFD
  • 33.
    Validating the DFD Foreach DFD: Check each data flow for: A unique name: noun; description Connects to at least one process Shown in only one direction (no two-headed arrows) A minimum number of crossed lines Check each data store for: A unique name: noun; description At least one input data flow At least one output data flow Check each external entity for: A unique name: noun; description At least one input or output data flow PowerPoint Presentation for Dennis, Wixom, & Roth Systems Analysis and Design, 3rd Edition Copyright 2006 © John Wiley & Sons, Inc. All rights reserved.
  • 34.
    Validating the DFD AcrossDFDs: Context Diagram: Every set of DFDs must have one Context Diagram Viewpoint: There is a consistent viewpoint for the entire set of DFDs Decomposition: Every process is wholly and complete described by the processes on its children DFDs Balance: Every data flow, data store, and external entity on a higher level DFD is shown on the lower level DFD that decomposes it No data stores or data flows appear on lower-lever DFDs that do not appear on their parent DFD PowerPoint Presentation for Dennis, Wixom, & Roth Systems Analysis and Design, 3rd Edition Copyright 2006 © John Wiley & Sons, Inc. All rights reserved.
  • 35.
    Validating the DFD Semantics errors – diagram conveys correct meaning  Assure accuracy of DFD relative to actual/desired business processes  To verify correct representation, use  User walkthroughs  Role-play processes  Examine lowest level DFDs to ensure consistent decomposition  Examine names carefully to ensure consistent use of terms PowerPoint Presentation for Dennis, Wixom, & Roth Systems Analysis and Design, 3rd Edition Copyright 2006 © John Wiley & Sons, Inc. All rights reserved.
  • 36.
    A Quick Reviewof Decomposition for CD Selections PowerPoint Presentation for Dennis, Wixom, & Roth Systems Analysis and Design, 3rd Edition Copyright 2006 © John Wiley & Sons, Inc. All rights reserved.
  • 37.
    Context Diagram forCD Selections Internet Sales System PowerPoint Presentation for Dennis, Wixom, & Roth Systems Analysis and Design, 3rd Edition Copyright 2006 © John Wiley & Sons, Inc. All rights reserved.
  • 38.
    Level 0 DFDfor CD Selections Internet System PowerPoint Presentation for Dennis, Wixom, & Roth Systems Analysis and Design, 3rd Edition Copyright 2006 © John Wiley & Sons, Inc. All rights reserved.
  • 39.
    Level 1 DFDfor CD Selections Process 1: Take Requests PowerPoint Presentation for Dennis, Wixom, & Roth Systems Analysis and Design, 3rd Edition Copyright 2006 © John Wiley & Sons, Inc. All rights reserved.
  • 40.
    Summary  The DataFlow Diagram (DFD) is an essential tool for creating formal descriptions of business processes.  Use cases record the input, transformation, and output of business processes and are the basis for process models.  Eliciting use cases and modeling business processes are critically important skills for the systems analyst to master. PowerPoint Presentation for Dennis, Wixom, & Roth Systems Analysis and Design, 3rd Edition Copyright 2006 © John Wiley & Sons, Inc. All rights reserved.