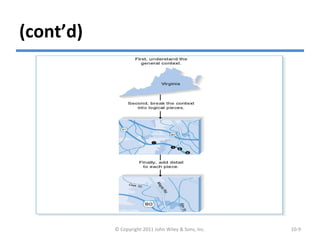
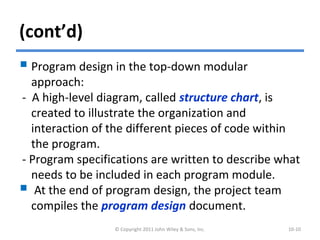
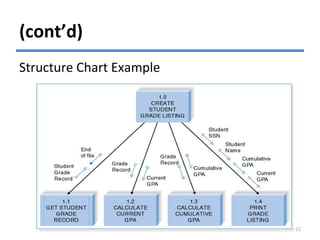
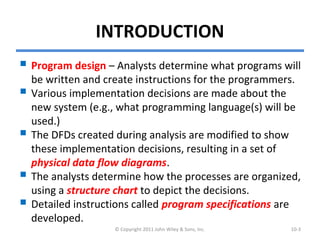
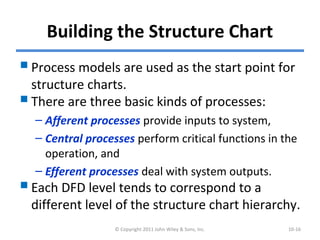
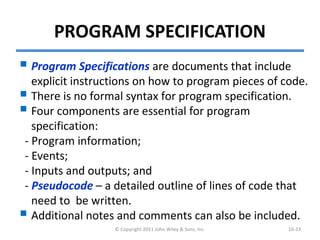
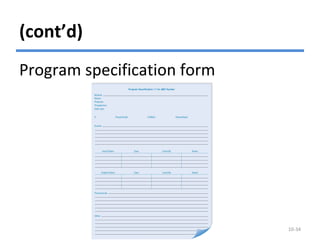
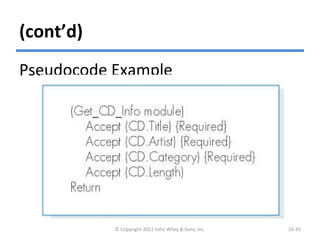
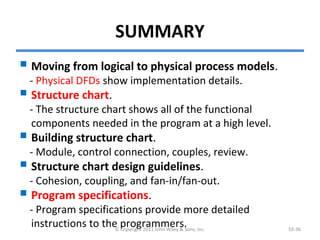
Systems Analysis and DesignSystems Analysis and Design
5th Edition5th Edition
Chapter 10. Program DesignChapter 10. Program Design
Alan Dennis, Barbara Haley Wixom, and Roberta Roth
10-1© Copyright 2011 John Wiley & Sons, Inc.
Chapter 10 Outline
Moving from logical to physical
process models.
Designing programs.
Structure chart.
Program specification.
© Copyright 2011 John Wiley & Sons, Inc. 10-2
INTRODUCTION
 Program design – Analysts determine what programs will
be written and create instructions for the programmers.
 Various implementation decisions are made about the
new system (e.g., what programming language(s) will be
used.)
 The DFDs created during analysis are modified to show
these implementation decisions, resulting in a set of
physical data flow diagrams.
 The analysts determine how the processes are organized,
using a structure chart to depict the decisions.
 Detailed instructions called program specifications are
developed.
© Copyright 2011 John Wiley & Sons, Inc. 10-3
MOVING FROM LOGICAL TO PHYSICAL
PROCESS MODELS
The analysis phase focuses on logical data
flow diagrams which do not contain any
indication how the system will actually be
implemented; they simply state what the
new system will do.
During design, physical process models are
created to show implementation details
and explain how the final system will work.
© Copyright 2011 John Wiley & Sons, Inc. 10-4
The Physical Data Flow Diagram
The physical DFD contains the same
components as the logical DFD, and the same
rules apply.
The basic difference between the two models
is that a physical DFD contains additional
details that describe how the system will be
built.
There are five steps to perform to make the
transition to the physical DFD.
© Copyright 2011 John Wiley & Sons, Inc. 10-5
(cont’d)
Steps to Create the Physical Data
Flow Diagram
© Copyright 2011 John Wiley & Sons, Inc. 10-6
(cont’d)
© Copyright 2011 John Wiley & Sons, Inc. 10-7
Example of Physical DFD
DESIGNING PROGRAMS
Analysts should create a design of a
maintainable system that is modular
and flexible.
 Analysts can design programs in a
top-down modular approach.
© Copyright 2011 John Wiley & Sons, Inc. 10-8
(cont’d)
Using a Top-Down Modular Approach
© Copyright 2011 John Wiley & Sons, Inc. 10-9
(cont’d)
 Program design in the top-down modular
approach:
- A high-level diagram, called structure chart, is
created to illustrate the organization and
interaction of the different pieces of code within
the program.
- Program specifications are written to describe what
needs to be included in each program module.
 At the end of program design, the project team
compiles the program design document.
© Copyright 2011 John Wiley & Sons, Inc. 10-10
STRUCTURE CHART
The structure chart is an Important program
design technique that help the analyst design
the program.
It shows all components of code in a
hierarchical format that implies
–sequence,
–selection, and
–iteration.
© Copyright 2011 John Wiley & Sons, Inc. 10-11
(cont’d)
Structure Chart Example
© Copyright 2011 John Wiley & Sons, Inc. 10-12
Syntax of Structure Chart
© Copyright 2011 John Wiley & Sons, Inc. 10-13
(cont’d)
© Copyright 2011 John Wiley & Sons, Inc. 10-14
(cont’d)
Revised structure chart example
© Copyright 2011 John Wiley & Sons, Inc. 10-15
Building the Structure Chart
Process models are used as the start point for
structure charts.
There are three basic kinds of processes:
– Afferent processes provide inputs to system,
– Central processes perform critical functions in the
operation, and
– Efferent processes deal with system outputs.
Each DFD level tends to correspond to a
different level of the structure chart hierarchy.
© Copyright 2011 John Wiley & Sons, Inc. 10-16
(cont’d)
© Copyright 2011 John Wiley & Sons, Inc. 10-17
Transaction Structure
There are two basic arrangement, or
structures, for combining modules.
The transaction structure contains a control
module that calls subordinate modules, each
of which handles a particular transaction.
– Few afferent processes
– Many efferent processes
– Higher levels of the structure chart
– Connected with coordinating the production of
outputs © Copyright 2011 John Wiley & Sons, Inc. 10-18
(cont’d)
© Copyright 2011 John Wiley & Sons, Inc. 10-19
Transform Structure
The transaction structure has a control
module that calls several subordinate modules
in sequence after which something
“happens.”
These modules are related because together
they form a process that transforms some
input into an output.
– Many afferent processes
– Few efferent processes
– Lower levels of the structure chart
– Connected with using inputs to create a new output
© Copyright 2011 John Wiley & Sons, Inc. 10-20
Steps in Building the Structure Chart
1. Identify modules and levels.
2. Identify special connections.
3. Add couples.
4. Revise structure chart.
© Copyright 2011 John Wiley & Sons, Inc. 10-21
Design Guidelines
High quality structure charts result in
programs that are modular, reusable,
and easy to implement.
Measures of good design include
–cohesion,
–coupling, and
–appropriate levels of fan-in and fan-out.
© Copyright 2011 John Wiley & Sons, Inc. 10-22
Build Modules with High Cohesion
Cohesion refers to how well the lines
of code within each module relate to
each other.
Cohesive modules are easy to
understand and build because their
code performs one function
effectively.
© Copyright 2011 John Wiley & Sons, Inc. 10-23
(cont’d)
There are various types of cohesion.
Functional cohesion – all elements of the
modules contribute to performing a single
task.
Temporal cohesion – functions are invoked at
the same time.
 Coincidental cohesion – there is no apparent
relationship among a module’s functions.
© Copyright 2011 John Wiley & Sons, Inc. 10-24
(cont’d)
© Copyright 2011 John Wiley & Sons, Inc. 10-25
(cont’d)
© Copyright 2011 John Wiley & Sons, Inc. 10-26
Cohesion Decision Tree
(cont’d)
Factoring is the process of
separating out a function from one
module into a module of its own.
Factoring can make modules
cohesive create a better structure.
© Copyright 2011 John Wiley & Sons, Inc. 10-27
Build Loosely Coupled Modules
Coupling involves how closely modules are
interrelated.
Modules should be loosely coupled.
Data coupling occurs when modules pass
parameters or specific data to each other.
It is preferred.
Content coupling occurs when one module
actually refers to the inside of another
module. It is a bad coupling type.
© Copyright 2011 John Wiley & Sons, Inc. 10-28
Create High Fan-In
Fan-in describes the number of control
modules that communicate with a
subordinate.
 A module with high fan-in has many
different control modules that call it. This
is a good situation because high fan-in
indicates that a module is reused in many
places on the structure chart.
© Copyright 2011 John Wiley & Sons, Inc. 10-29
Avoid High Fan-Out
A large number of subordinates
associated with a single control
should be avoided.
The general rule of thumb is to limit
a control module’s subordinates to
approximately seven for low fan-out.
© Copyright 2011 John Wiley & Sons, Inc. 10-30
(cont’d)
Examples of Fan-in and Fan-out
© Copyright 2011 John Wiley & Sons, Inc. 10-31
Assess the Chart for Quality
Check list for structure chart quality
© Copyright 2011 John Wiley & Sons, Inc. 10-32
PROGRAM SPECIFICATION
 Program Specifications are documents that include
explicit instructions on how to program pieces of code.
 There is no formal syntax for program specification.
 Four components are essential for program
specification:
- Program information;
- Events;
- Inputs and outputs; and
- Pseudocode – a detailed outline of lines of code that
need to be written.
 Additional notes and comments can also be included.
© Copyright 2011 John Wiley & Sons, Inc. 10-33
(cont’d)
© Copyright 2011 John Wiley & Sons, Inc. 10-34
Program specification form
(cont’d)
Pseudocode Example
© Copyright 2011 John Wiley & Sons, Inc. 10-35
SUMMARY
 Moving from logical to physical process models.
- Physical DFDs show implementation details.
 Structure chart.
- The structure chart shows all of the functional
components needed in the program at a high level.
 Building structure chart.
- Module, control connection, couples, review.
 Structure chart design guidelines.
- Cohesion, coupling, and fan-in/fan-out.
 Program specifications.
- Program specifications provide more detailed
instructions to the programmers.© Copyright 2011 John Wiley & Sons, Inc. 10-36
Copyright 2011 John Wiley & Sons, Inc.
All rights reserved. Reproduction or translation of this work
beyond that permitted in Section 117 of the 1976 United States
Copyright Act without the express written permission of the
copyright owner is unlawful. Request for further information
should be addressed to the Permissions Department, John Wiley
& Sons, Inc. The purchaser may make back-up copies for his/her
own use only and not for redistribution or resale. The Publisher
assumes no responsibility for errors, omissions, or damages,
caused by the use of these programs or from the use of the
information contained herein.
© Copyright 2011 John Wiley & Sons, Inc. 10-37

Ch10-Program Design

  • 1.
    Systems Analysis andDesignSystems Analysis and Design 5th Edition5th Edition Chapter 10. Program DesignChapter 10. Program Design Alan Dennis, Barbara Haley Wixom, and Roberta Roth 10-1© Copyright 2011 John Wiley & Sons, Inc.
  • 2.
    Chapter 10 Outline Movingfrom logical to physical process models. Designing programs. Structure chart. Program specification. © Copyright 2011 John Wiley & Sons, Inc. 10-2
  • 3.
    INTRODUCTION  Program design– Analysts determine what programs will be written and create instructions for the programmers.  Various implementation decisions are made about the new system (e.g., what programming language(s) will be used.)  The DFDs created during analysis are modified to show these implementation decisions, resulting in a set of physical data flow diagrams.  The analysts determine how the processes are organized, using a structure chart to depict the decisions.  Detailed instructions called program specifications are developed. © Copyright 2011 John Wiley & Sons, Inc. 10-3
  • 4.
    MOVING FROM LOGICALTO PHYSICAL PROCESS MODELS The analysis phase focuses on logical data flow diagrams which do not contain any indication how the system will actually be implemented; they simply state what the new system will do. During design, physical process models are created to show implementation details and explain how the final system will work. © Copyright 2011 John Wiley & Sons, Inc. 10-4
  • 5.
    The Physical DataFlow Diagram The physical DFD contains the same components as the logical DFD, and the same rules apply. The basic difference between the two models is that a physical DFD contains additional details that describe how the system will be built. There are five steps to perform to make the transition to the physical DFD. © Copyright 2011 John Wiley & Sons, Inc. 10-5
  • 6.
    (cont’d) Steps to Createthe Physical Data Flow Diagram © Copyright 2011 John Wiley & Sons, Inc. 10-6
  • 7.
    (cont’d) © Copyright 2011John Wiley & Sons, Inc. 10-7 Example of Physical DFD
  • 8.
    DESIGNING PROGRAMS Analysts shouldcreate a design of a maintainable system that is modular and flexible.  Analysts can design programs in a top-down modular approach. © Copyright 2011 John Wiley & Sons, Inc. 10-8
  • 9.
    (cont’d) Using a Top-DownModular Approach © Copyright 2011 John Wiley & Sons, Inc. 10-9
  • 10.
    (cont’d)  Program designin the top-down modular approach: - A high-level diagram, called structure chart, is created to illustrate the organization and interaction of the different pieces of code within the program. - Program specifications are written to describe what needs to be included in each program module.  At the end of program design, the project team compiles the program design document. © Copyright 2011 John Wiley & Sons, Inc. 10-10
  • 11.
    STRUCTURE CHART The structurechart is an Important program design technique that help the analyst design the program. It shows all components of code in a hierarchical format that implies –sequence, –selection, and –iteration. © Copyright 2011 John Wiley & Sons, Inc. 10-11
  • 12.
    (cont’d) Structure Chart Example ©Copyright 2011 John Wiley & Sons, Inc. 10-12
  • 13.
    Syntax of StructureChart © Copyright 2011 John Wiley & Sons, Inc. 10-13
  • 14.
    (cont’d) © Copyright 2011John Wiley & Sons, Inc. 10-14
  • 15.
    (cont’d) Revised structure chartexample © Copyright 2011 John Wiley & Sons, Inc. 10-15
  • 16.
    Building the StructureChart Process models are used as the start point for structure charts. There are three basic kinds of processes: – Afferent processes provide inputs to system, – Central processes perform critical functions in the operation, and – Efferent processes deal with system outputs. Each DFD level tends to correspond to a different level of the structure chart hierarchy. © Copyright 2011 John Wiley & Sons, Inc. 10-16
  • 17.
    (cont’d) © Copyright 2011John Wiley & Sons, Inc. 10-17
  • 18.
    Transaction Structure There aretwo basic arrangement, or structures, for combining modules. The transaction structure contains a control module that calls subordinate modules, each of which handles a particular transaction. – Few afferent processes – Many efferent processes – Higher levels of the structure chart – Connected with coordinating the production of outputs © Copyright 2011 John Wiley & Sons, Inc. 10-18
  • 19.
    (cont’d) © Copyright 2011John Wiley & Sons, Inc. 10-19
  • 20.
    Transform Structure The transactionstructure has a control module that calls several subordinate modules in sequence after which something “happens.” These modules are related because together they form a process that transforms some input into an output. – Many afferent processes – Few efferent processes – Lower levels of the structure chart – Connected with using inputs to create a new output © Copyright 2011 John Wiley & Sons, Inc. 10-20
  • 21.
    Steps in Buildingthe Structure Chart 1. Identify modules and levels. 2. Identify special connections. 3. Add couples. 4. Revise structure chart. © Copyright 2011 John Wiley & Sons, Inc. 10-21
  • 22.
    Design Guidelines High qualitystructure charts result in programs that are modular, reusable, and easy to implement. Measures of good design include –cohesion, –coupling, and –appropriate levels of fan-in and fan-out. © Copyright 2011 John Wiley & Sons, Inc. 10-22
  • 23.
    Build Modules withHigh Cohesion Cohesion refers to how well the lines of code within each module relate to each other. Cohesive modules are easy to understand and build because their code performs one function effectively. © Copyright 2011 John Wiley & Sons, Inc. 10-23
  • 24.
    (cont’d) There are varioustypes of cohesion. Functional cohesion – all elements of the modules contribute to performing a single task. Temporal cohesion – functions are invoked at the same time.  Coincidental cohesion – there is no apparent relationship among a module’s functions. © Copyright 2011 John Wiley & Sons, Inc. 10-24
  • 25.
    (cont’d) © Copyright 2011John Wiley & Sons, Inc. 10-25
  • 26.
    (cont’d) © Copyright 2011John Wiley & Sons, Inc. 10-26 Cohesion Decision Tree
  • 27.
    (cont’d) Factoring is theprocess of separating out a function from one module into a module of its own. Factoring can make modules cohesive create a better structure. © Copyright 2011 John Wiley & Sons, Inc. 10-27
  • 28.
    Build Loosely CoupledModules Coupling involves how closely modules are interrelated. Modules should be loosely coupled. Data coupling occurs when modules pass parameters or specific data to each other. It is preferred. Content coupling occurs when one module actually refers to the inside of another module. It is a bad coupling type. © Copyright 2011 John Wiley & Sons, Inc. 10-28
  • 29.
    Create High Fan-In Fan-indescribes the number of control modules that communicate with a subordinate.  A module with high fan-in has many different control modules that call it. This is a good situation because high fan-in indicates that a module is reused in many places on the structure chart. © Copyright 2011 John Wiley & Sons, Inc. 10-29
  • 30.
    Avoid High Fan-Out Alarge number of subordinates associated with a single control should be avoided. The general rule of thumb is to limit a control module’s subordinates to approximately seven for low fan-out. © Copyright 2011 John Wiley & Sons, Inc. 10-30
  • 31.
    (cont’d) Examples of Fan-inand Fan-out © Copyright 2011 John Wiley & Sons, Inc. 10-31
  • 32.
    Assess the Chartfor Quality Check list for structure chart quality © Copyright 2011 John Wiley & Sons, Inc. 10-32
  • 33.
    PROGRAM SPECIFICATION  ProgramSpecifications are documents that include explicit instructions on how to program pieces of code.  There is no formal syntax for program specification.  Four components are essential for program specification: - Program information; - Events; - Inputs and outputs; and - Pseudocode – a detailed outline of lines of code that need to be written.  Additional notes and comments can also be included. © Copyright 2011 John Wiley & Sons, Inc. 10-33
  • 34.
    (cont’d) © Copyright 2011John Wiley & Sons, Inc. 10-34 Program specification form
  • 35.
    (cont’d) Pseudocode Example © Copyright2011 John Wiley & Sons, Inc. 10-35
  • 36.
    SUMMARY  Moving fromlogical to physical process models. - Physical DFDs show implementation details.  Structure chart. - The structure chart shows all of the functional components needed in the program at a high level.  Building structure chart. - Module, control connection, couples, review.  Structure chart design guidelines. - Cohesion, coupling, and fan-in/fan-out.  Program specifications. - Program specifications provide more detailed instructions to the programmers.© Copyright 2011 John Wiley & Sons, Inc. 10-36
  • 37.
    Copyright 2011 JohnWiley & Sons, Inc. All rights reserved. Reproduction or translation of this work beyond that permitted in Section 117 of the 1976 United States Copyright Act without the express written permission of the copyright owner is unlawful. Request for further information should be addressed to the Permissions Department, John Wiley & Sons, Inc. The purchaser may make back-up copies for his/her own use only and not for redistribution or resale. The Publisher assumes no responsibility for errors, omissions, or damages, caused by the use of these programs or from the use of the information contained herein. © Copyright 2011 John Wiley & Sons, Inc. 10-37