Download as PDF, PPTX


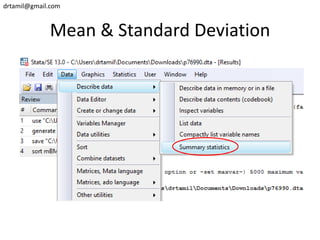
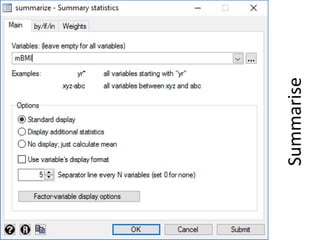
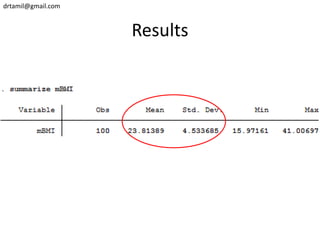
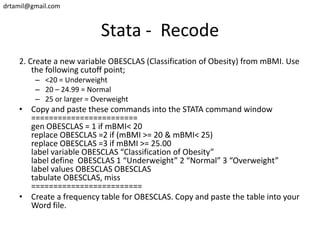
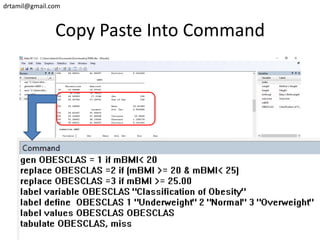
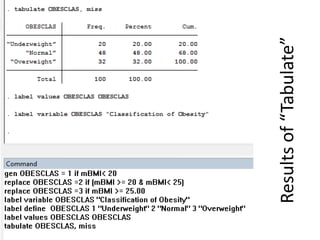

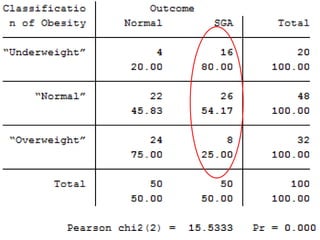
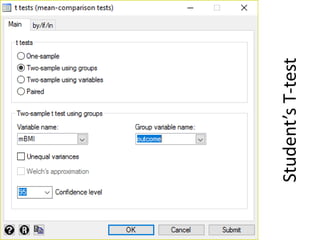
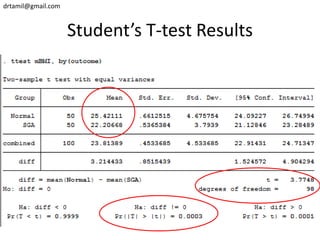
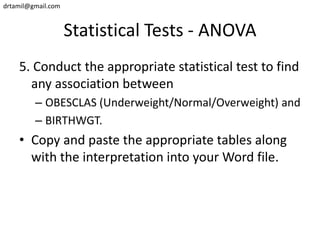
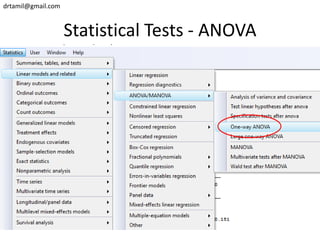
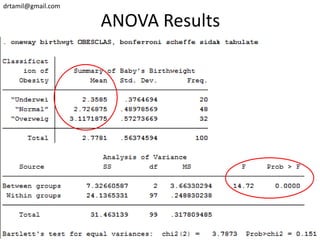
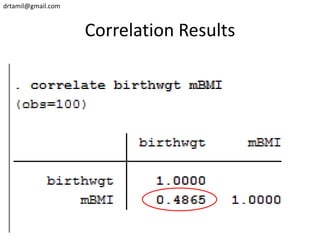
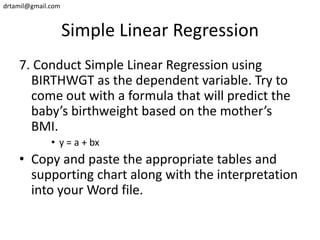
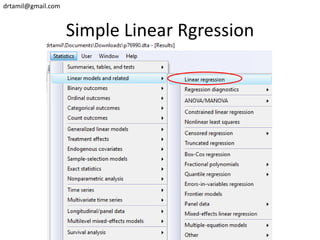
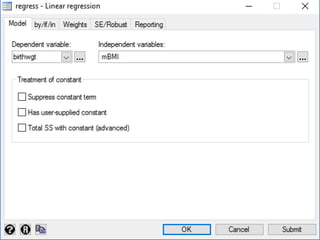
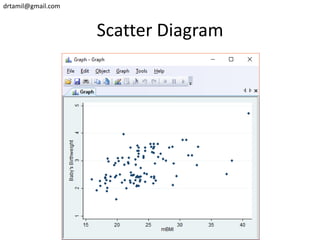

A study was conducted to identify factors that can cause small for gestational age (SGA) babies. One of the factors studied was the mother's body mass index (BMI). It is believed that mothers with a lower BMI are at higher risk of having SGA babies. The document provides instructions to analyze a dataset using STATA to examine the relationship between mother's BMI and birthweight. This includes calculating mean and standard deviation of BMI, classifying BMI levels, conducting statistical tests to analyze associations between variables, and building a linear regression model to predict birthweight based on mother's BMI.


![CTEV [ clubfoot] DR ARUN LAL ,DR MOHAMED ASHRAF travancore medical college k...](https://cdn.slidesharecdn.com/ss_thumbnails/ctevclubfootdrarunlaldrmohamedashraftravancoremedicalcollegekollamkeralaindia-260208063247-18fc466c-thumbnail.jpg?width=640&height=640&fit=bounds)


![ONFH[AVN HIP] -TRIPLE REGIME -A NOVAL SURGICAL CONCEPT .pptx](https://cdn.slidesharecdn.com/ss_thumbnails/onfhavnhip2026koaconcalicutdrgokuldevdrmashraf-260210064517-213ec005-thumbnail.jpg?width=640&height=640&fit=bounds)


