
Recommended
Recommended
More Related Content
What's hot
What's hot (16)
Viewers also liked
Viewers also liked (16)
Similar to Cincinnati JLL Industrial Employment Update May 2015
Similar to Cincinnati JLL Industrial Employment Update May 2015 (20)
More from JLL_Midwest_Great_Lakes_Research
More from JLL_Midwest_Great_Lakes_Research (20)
Recently uploaded
Recently uploaded (20)
Cincinnati JLL Industrial Employment Update May 2015
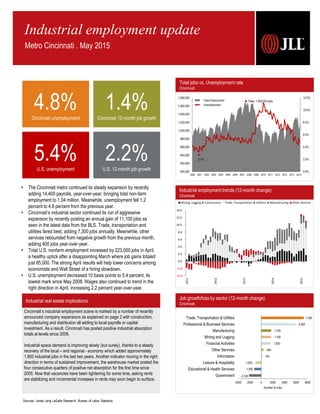
- 1. Industrial employment trends (12-month change) Cincinnati Sources: Jones Lang LaSalle Research, Bureau of Labor Statistics Industrial employment update Metro Cincinnati . May 2015 Cincinnati’s industrial employment scene is marked by a number of recently announced company expansions as explained on page 2 with construction, manufacturing and distribution all adding to local payrolls or capital investment. As a result, Cincinnati has posted positive industrial absorption totals at levels since 2008. Industrial space demand is improving slowly (but surely), thanks to a steady recovery of the local – and regional - economy which added approximately 1,800 industrial jobs in the last two years. Another indicator moving in the right direction in terms of sustained improvement, the warehouse market posted the four consecutive quarters of positive net absorption for the first time since 2005. Now that vacancies have been tightening for some time, asking rents are stabilizing and incremental increases in rents may soon begin to surface. Industrial real estate implications • The Cincinnati metro continued its steady expansion by recently adding 14,400 payrolls, year-over-year, bringing total non-farm employment to 1.04 million. Meanwhile, unemployment fell 1.2 percent to 4.8 percent from the previous year. • Cincinnati’s industrial sector continued its run of aggressive expansion by recently posting an annual gain of 11,100 jobs as seen in the latest data from the BLS. Trade, transportation and utilities fared best, adding 7,300 jobs annually. Meanwhile, other services rebounded from negative growth from the previous month, adding 400 jobs year-over-year. • Total U.S. nonfarm employment increased by 223,000 jobs in April, a healthy uptick after a disappointing March where job gains totaled just 85,000. The strong April results will help lower concerns among economists and Wall Street of a hiring slowdown. • U.S. unemployment decreased 10 basis points to 5.4 percent, its lowest mark since May 2008. Wages also continued to trend in the right direction in April, increasing 2.2 percent year-over-year. (4.0) (2.0) 0.0 2.0 4.0 6.0 8.0 10.0 12.0 14.0 2011 2012 2013 2014 2015 Mining, Logging & Construction Trade, Transportation & Utilities Manufacturing Other Services Job growth/loss by sector (12-month change) Cincinnati -2,100 -1,200 -1,000 100 400 1,600 1,700 1,700 5,900 7,300 -4000 -2000 0 2000 4000 6000 8000 Government Educational & Health Services Leisure & Hospitality Information Other Services Financial Activities Mining and Logging Manufacturing Professional & Business Services Trade, Transportation & Utilities Number of Jobs 0.0% 2.0% 4.0% 6.0% 8.0% 10.0% 12.0% 900,000 920,000 940,000 960,000 980,000 1,000,000 1,020,000 1,040,000 1,060,000 1,080,000 2000 2001 2002 2003 2004 2005 2006 2007 2008 2009 2010 2011 2012 2013 2014 2015 Peak: 1,069,054 jobs Total jobs vs. Unemployment rate Cincinnati 3.1% Total Employment Unemployment 4.8%Cincinnati unemployment 1.4%Cincinnati 12-month job growth 5.4%U.S. unemployment 2.2%U.S. 12-month job growth
- 2. © 2015 Jones Lang LaSalle IP, Inc. All rights reserved. All information contained herein is from sources deemed reliable; however, no representation or warranty is made to the accuracy thereof. JLL Americas Research • Cincinnati Industrial Employment Update 2 News on the street Cincinnati businesses expanding, contracting, etc. C.M. Paula Ι Plastic & Rubber Product Manufacturing: Expanding C.M. Paula, a privately held holding company that purchases, grows and holds other businesses, was approved for a 40 percent, six-year tax credit as a result of the company’s expansion in the city of Mason. The company’s subsidiaries include Up With Paper, GeoCentral, ART Technologies and Remtec Automation. C.M. Paula expects to create 29 full-time jobs generating about $1.6 million in additional annual payroll as well as retain more than $5.6 million in payroll. Emerge Technologies Ι Information Technology Services: Expanding Emerge Technologies recently received preliminary approval for incentives from the Kentucky Economic Development Finance Authority to aid in its expansion. The company was given wage assessment incentives to expand, meaning the company can keep a portion of its investment over the term of the agreement through income tax credits and wage assessments if it meets job and investment targets. The company expects to spend $4.8 million to purchase a new building. Intelligrated Inc. Ι Material Handling Equipment Manufacturing: Expanding Intelligrated Inc., one of the region’s largest private companies, is expanding its Mason headquarters and hiring hundreds of additional employees. Intelligrated, which designs, manufactures and installs material handling automation services, is hiring about 238 additional employees, primarily for jobs in the engineering field. In addition, the company is expanding its headquarters, located at 7901 Innovation Way, by 83,000 square feet. Nitto Denko Avecia Ι Pharmaceutical Manufacturing: Expanding Nitto Denko Avecia, a contract manufacturer of active pharmaceutical ingredients for the pharma industry, was recently approved for a 40 percent five-year tax credit as a result of the company’s expansion in the city of Reading. The company would invest in expanding an existing building and new machinery and equipment. Avecia expects to create 15 full-time jobs generating $1.1 million in additional annual payroll as well as retain more than $5.6 million in payroll by Dec. 31, 2017. Peter Cremer North America LP Ι Soap & Other Detergent Manufacturing: Expanding Peter Cremer North America LP, an international oleochemicals company, is planning a large expansion in the city of Cincinnati. The company wants to purchase more than 6 acres of city-owned land along River Road in Sedamsville to build a 78,000-square-foot manufacturing and warehouse facility. Peter Cremer also plans to create 120 new full-time jobs and another 30 part-time jobs within three years after completion of construction. Zotefoams Ι Plastic & Rubber Product Manufacturing: Expanding Zotefoams (LON: ZTF) is expected to invest nearly $22 million in a 53,000-square-foot expansion of its Walton headquarters, which will create 25 new jobs. The expansion is being built by Paul Hemmer Co. Zotefoams produces cross-linked block foams that are used in sports and leisure, packaging, transport, health care, toys, building, marine and the military. The company was given a total tax incentive of $700,000 for the expansion from KEDFA. Cody Brooks Research Analyst Great Lakes Region tel +1 513 297 2509 Cody.Brooks@am.jll.com 312 Walnut St, Suite 3030 Cincinnati, OH 45202 www.jll.com/cincinnati March 2013 March 2014 March 2015 Total Non-farm Employment 1,006,900 1.0% 1,027,600 2.1% 1,042,000 1.4% Unemployment Rate 7.4% 6.0% 4.8% Cincinnati Supersectors March 2013 March 2014 March 2015 Mining, Logging and Construction 35,400 -1.9% 38,000 7.3% 39,700 4.5% Manufacturing 103,900 -0.7% 108,500 4.4% 110,200 1.6% Trade, Transportation, & Utilities 198,000 0.6% 199,600 0.8% 206,900 3.7% Information 14,100 2.2% 13,400 -5.0% 13,500 0.7% Financial Activities 64,900 2.4% 65,800 1.4% 67,400 2.4% Professional & Business Services 159,000 1.0% 163,400 2.8% 169,300 3.6% Educational & Health Services 154,700 2.0% 159,200 2.9% 158,000 -0.8% Leisure & Hospitality 105,200 3.4% 108,800 3.4% 107,800 -0.9% Other Services 39,700 4.7% 38,700 -2.5% 39,100 1.0% Government 132,000 -1.0% 132,200 0.2% 130,100 -1.6% Employment statistics Cincinnati Industry employment stratification Cincinnati Trade, transportation and Utilities, 206,900, 20% Professional and Business Services, 169,300, 16% Educational and Health Services, 158,000, 15% Government, 130,100, 13% Manufacturing, 110,200, 11% Leisure and Hospitality, 107,800, 10% Financial Activities, 67,400, 6% Mining, Logging and construction, 39,700, 4% Other Services, 39,100, 4% Information, 13,500, 1% Andrew Batson Senior Research Analyst Great Lakes Region tel +1 216 937 4374 Andrew.Batson@am.jll.com 127 Public Square, Suite 2410 Cleveland, OH 44114 www.jll.com/cleveland