
Recommended
Recommended
More Related Content
What's hot
What's hot (16)
Similar to JLL Cleveland Office Employment Update: May 2015
Similar to JLL Cleveland Office Employment Update: May 2015 (20)
More from JLL_Midwest_Great_Lakes_Research
More from JLL_Midwest_Great_Lakes_Research (20)
Recently uploaded
Recently uploaded (20)
JLL Cleveland Office Employment Update: May 2015
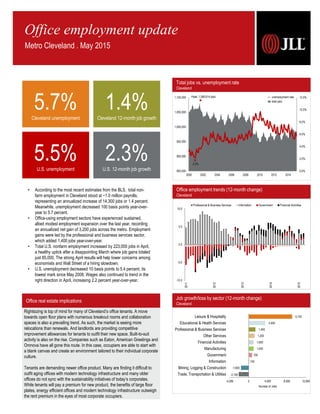
- 1. Office real estate implications Sources: JLL Research, Bureau of Labor Statistics Job growth/loss by sector (12-month change) Cleveland -2,100 -1,600 100 700 1,000 1,000 1,200 1,400 3,500 9,100 -4,000 0 4,000 8,000 12,000 Trade, Transportation & Utilities Mining, Logging & Construction Information Government Manufacturing Financial Activities Other Services Professional & Business Services Educational & Health Services Leisure & Hospitality Number of Jobs Rightsizing is top of mind for many of Cleveland’s office tenants. A move towards open floor plans with numerous breakout rooms and collaboration spaces is also a prevailing trend. As such, the market is seeing more relocations than renewals. And landlords are providing competitive improvement allowances for tenants to outfit their new space. Built-to-suit activity is also on the rise. Companies such as Eaton, American Greetings and Omnova have all gone this route. In this case, occupiers are able to start with a blank canvas and create an environment tailored to their individual corporate culture. Tenants are demanding newer office product. Many are finding it difficult to outfit aging offices with modern technology infrastructure and many older offices do not sync with the sustainability initiatives of today’s corporates. While tenants will pay a premium for new product, the benefits of large floor plates, energy efficient offices and modern technology infrastructure outweigh the rent premium in the eyes of most corporate occupiers. Total jobs vs. unemployment rate Cleveland 0.0% 2.0% 4.0% 6.0% 8.0% 10.0% 12.0% 850,000 900,000 950,000 1,000,000 1,050,000 1,100,000 2000 2002 2004 2006 2008 2010 2012 2014 Peak: 1,080,614 jobs 2.2% unemployment rate total jobs Office employment trends (12-month change) Cleveland Office employment update Metro Cleveland . May 2015 5.7%Cleveland unemployment 1.4%Cleveland 12-month job growth 5.5%U.S. unemployment 2.3%U.S. 12-month job growth • According to the most recent estimates from the BLS, total non- farm employment in Cleveland stood at ~1.0 million payrolls, representing an annualized increase of 14,300 jobs or 1.4 percent. Meanwhile, unemployment decreased 100 basis points year-over- year to 5.7 percent. • Office-using employment sectors have experienced sustained, albeit modest employment expansion over the last year, recording an annualized net gain of 3,200 jobs across the metro. Employment gains were led by the professional and business services sector, which added 1,400 jobs year-over-year. • Total U.S. nonfarm employment increased by 223,000 jobs in April, a healthy uptick after a disappointing March where job gains totaled just 85,000. The strong April results will help lower concerns among economists and Wall Street of a hiring slowdown. • U.S. unemployment decreased 10 basis points to 5.4 percent, its lowest mark since May 2008. Wages also continued to trend in the right direction in April, increasing 2.2 percent year-over-year. -10.0 -5.0 0.0 5.0 10.0 2011 2012 2013 2014 2015 Professional & Business Services Information Government Financial Activities
- 2. JLL Americas Research • Cleveland Office Employment Update 2 March 2013 March 2014 March 2015 Total Non-farm Employment 1,004,800 1.0% 1,012,100 0.7% 1,027,400 1.5% Unemployment Rate 7.6% 7.6% 6.4% Cleveland Supersectors March 2013 March 2014 March 2015 Mining, Logging & Construction 30,400 0.0% 31,500 3.6% 29,900 -5.1% Manufacturing 123,900 0.7% 123,600 -0.2% 124,600 0.8% Trade, Transportation, & Utilities 177,800 0.0% 178,800 0.6% 176,700 -1.2% Information 15,000 -2.0% 14,600 -2.7% 14,700 0.7% Financial Activities 62,400 0.8% 64,500 3.4% 65,500 1.6% Professional & Business Services 141,300 0.9% 144,300 2.1% 145,700 1.0% Educational & Health Services 195,900 1.8% 195,600 -0.2% 199,100 1.8% Leisure & Hospitality 90,300 5.7% 91,900 1.8% 101,000 9.9% Other Services 39,200 -2.2% 39,300 0.3% 40,500 3.1% Government 133,700 -2.0% 133,500 -0.1% 134,200 0.5% News on the street Cleveland businesses expanding, contracting, etc. Benesch Ι Legal Services: Relocating Leaders at the Benesch law firm have reached an agreement with developer Stark Enterprises to occupy roughly 66,500 square feet at a new office building that will be part of a $430 million proposed nuCLEus project that could include a 54-story tower, largely filled with apartments; a bridge-like hotel; stores; restaurants; and parking garages. The Benesch deal marks the first tenant commitment to nuCLEus, an ambitious undertaking by Stark and J-Dek Investments of Solon. Duke Realty Ι Commercial Real Estate: Disposition On the April 30 conference call, Denny Oklak, Duke chairman and CEO said the publicly traded national realty developer “closed $161 million of dispositions during the quarter, including transactions that represented the completion of our exit from the Cleveland office market.” At its height, Duke had 23 office buildings totaling 2.2 million square feet and 11 industrial buildings totaling 2.0 million square feet in northeast Ohio. K&D Group Ι Commercial Real Estate: Acquisition The 21-story Keith Building is the latest downtown Cleveland office building to become part of Willoughby-based apartment owner and developer K&D Group’s portfolio. Unlike K&D’s other office deals last year, the Halle and Leader buildings, Keith will remain an office building. Through 1621 Keith LLC, K&D on March 24 paid $5.2 million for a place to try to put office tenants from Halle and Leader. Penton Media Ι Magazine Publishers: Relocation Penton Media, the namesake company at the Penton Media Building since 2000, has inked a lease to move into a single floor at 1100 Superior Avenue, now called Oswald Centre. Penton will occupy the eighth floor of Oswald, the former offices of the Ostendorf-Morris brokerage firm, which moved to the U.S. Bank building at the end of 2014 when it merged with Hanna Chartwell. Penton landed in about 28,000 square feet at Oswald after searching throughout the downtown market. Republican National Committee Ι Political Action Committee: Expanding 40,000 square feet on Halle’s fourth floor will be the home for the Republican National Committee as it prepares for its 2016 national convention in Cleveland, according to Doug Price, whose K&D Group owns the onetime department store at 1228 Euclid Ave. Price, CEO and co-owner of Willoughby-based K&D, said the RNC will primarily pay for its utilities and will not pay a market rent. He said he and K&D co-owner Karen Paganini consider it a political donation. Spero-Smith Investment Advisers Ι Asset Management: Expanding Spero-Smith Investment Advisers, one of the largest independent investment management firms in Northeast Ohio, has relocated its operations from Beachwood to 8,000 square feet on the 27th floor of Terminal Tower in downtown Cleveland. The company comprises 13 employees today, but will be hiring another two or three additional staff in the coming months, according to a statement from the company’s president and chief operating officer, Jeffrey Malbasa. Employment statistics Cleveland Industry employment stratification Cleveland Educational & Health Services, 199,100, 19% Trade, Transportation & Utilities, 176,700, 17% Professional & Business Services, 145,700, 14% Government, 134,200, 13% Manufacturing, 124,600 , 12% Leisure & Hospitality, 101,000, 10% Financial Activities, 65,500 , 6% Other Services, 40,500, 4% Mining, Logging & Construction, 28,500, 3% Information, 14,600, 1% Andrew Batson Senior Research Analyst Great Lakes Region tel +1 216 937 4374 Andrew.Batson@am.jll.com 127 Public Square, Suite 2410 Cleveland, OH 44114 www.jll.com/cleveland Cody Brooks Research Analyst Great Lakes Region tel +1 513 297 2509 Cody.Brooks@am.jll.com 312 Walnut St, Suite 3030 Cincinnati, OH 45202 www.jll.com/cincinnati © 2015 Jones Lang LaSalle IP, Inc. All rights reserved. All information contained herein is from sources deemed reliable; however, no representation or warranty is made to the accuracy thereof.