Cleveland JLL Office Employment Update January 2015
•
1 like•227 views

Jobs growth among office-using employment sectors in Cleveland has been trending up in recent months, recording an annualized net gain of 3,800 jobs across the metro. Employment gains were led by the professional and business services sector, which added 4,800 jobs year-over-year.

Recommended
Recommended
More Related Content
Viewers also liked
Viewers also liked (11)
Similar to Cleveland JLL Office Employment Update January 2015
Similar to Cleveland JLL Office Employment Update January 2015 (20)
More from Andrew Batson
More from Andrew Batson (19)
Recently uploaded
Recently uploaded (20)
Cleveland JLL Office Employment Update January 2015
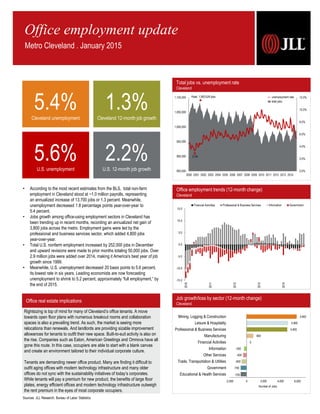
- 1. Office real estate implications Sources: JLL Research, Bureau of Labor Statistics Job growth/loss by sector (12-month change) Cleveland -700 -700 -600 -400 -300 0 800 4,800 4,900 5,900 -2,000 0 2,000 4,000 6,000 Educational & Health Services Government Trade, Transportation & Utilities Other Services Information Financial Activities Manufacturing Professional & Business Services Leisure & Hospitality Mining, Logging & Construction Number of Jobs Rightsizing is top of mind for many of Cleveland’s office tenants. A move towards open floor plans with numerous breakout rooms and collaboration spaces is also a prevailing trend. As such, the market is seeing more relocations than renewals. And landlords are providing sizable improvement allowances for tenants to outfit their new space. Built-to-suit activity is also on the rise. Companies such as Eaton, American Greetings and Omnova have all gone this route. In this case, occupiers are able to start with a blank canvas and create an environment tailored to their individual corporate culture. Tenants are demanding newer office product. Many are finding it difficult to outfit aging offices with modern technology infrastructure and many older offices do not sync with the sustainability initiatives of today’s corporates. While tenants will pay a premium for new product, the benefits of large floor plates, energy efficient offices and modern technology infrastructure outweigh the rent premium in the eyes of most corporate occupiers. Total jobs vs. unemployment rate Cleveland 0.0% 2.0% 4.0% 6.0% 8.0% 10.0% 12.0% 850,000 900,000 950,000 1,000,000 1,050,000 1,100,000 2000 2001 2002 2003 2004 2005 2006 2007 2008 2009 2010 2011 2012 2013 2014 Peak: 1,083,529 jobs 3.3% unemployment rate total jobs -15.0 -10.0 -5.0 0.0 5.0 10.0 15.0 2010 2011 2012 2013 2014 Financial Activities Professional & Business Services Information Government Office employment trends (12-month change) Cleveland Office employment update Metro Cleveland . January 2015 5.4%Cleveland unemployment 1.3%Cleveland 12-month job growth 5.6%U.S. unemployment 2.2%U.S. 12-month job growth • According to the most recent estimates from the BLS, total non-farm employment in Cleveland stood at ~1.0 million payrolls, representing an annualized increase of 13,700 jobs or 1.3 percent. Meanwhile, unemployment decreased 1.8 percentage points year-over-year to 5.4 percent. • Jobs growth among office-using employment sectors in Cleveland has been trending up in recent months, recording an annualized net gain of 3,800 jobs across the metro. Employment gains were led by the professional and business services sector, which added 4,800 jobs year-over-year. • Total U.S. nonfarm employment increased by 252,000 jobs in December and upward revisions were made to prior months totaling 50,000 jobs. Over 2.9 million jobs were added over 2014, making it America's best year of job growth since 1999. • Meanwhile, U.S. unemployment decreased 20 basis points to 5.6 percent, its lowest rate in six years. Leading economists are now forecasting unemployment to shrink to 5.2 percent, approximately “full employment,” by the end of 2015.
- 2. JLL Americas Research • Cleveland Office Employment Update 2 November 2012 November 2013 November 2014 Total Non-farm Employment 1,034,400 1.8% 1,035,700 0.1% 1,049,400 1.3% Unemployment Rate 6.9% 7.2% 5.4% Cleveland Supersectors November 2012 November 2013 November 2014 Mining, Logging & Construction 35,200 -1.4% 35,900 2.0% 41,800 16.4% Manufacturing 124,300 1.3% 124,700 0.3% 125,500 0.6% Trade, Transportation, & Utilities 185,400 1.9% 186,400 0.5% 185,800 -0.3% Information 15,300 -1.3% 15,100 -1.3% 14,800 -2.0% Financial Activities 63,000 1.0% 62,400 -1.0% 62,400 0.0% Professional & Business Services 147,000 2.8% 147,000 0.0% 151,800 3.3% Educational & Health Services 197,700 3.2% 198,800 0.6% 198,100 -0.4% Leisure & Hospitality 91,700 5.2% 90,700 -1.1% 95,600 5.4% Other Services 39,700 -1.5% 40,500 2.0% 40,100 -1.0% Government 135,100 -0.4% 134,200 -0.7% 133,500 -0.5% News on the street Cleveland businesses expanding, contracting, etc. Gas Natural Ι Natural Gas Distribution: Relocation Gas Natural (NYSE: EGAS) recently relocated its headquarters from Mentor to downtown Cleveland. The natural gas distributor signed a 6,000-square-foot sublease at One Cleveland Center. At the outset, Gas Natural will bring just 15 jobs downtown. But over the next few years, the company could add up to eight more headquarters positions. The city has approved a job-creation grant of up to $36,500 for Gas Natural, which will receive the money over a three-year period. Geis Companies Ι Commercial Real Estate: Development The Geis Companies, developer of the Midtown Tech Park, is taking on another new development along Cleveland’s Health-Tech Corridor. Geis executives recently unveiled plans to build a three-building, $51 million office and lab complex on the site of the former Ohio Knitting Mills building at East 55th Street and Euclid Avenue. The project ultimately could bring 260 jobs and 320,000 square feet of new construction. The first phase totaling 80,000 square feet could be completed by 2016. Hartland & Company Ι Financial Consultant: Acquisition Hartland & Company, a Cleveland-based institutional and private wealth advisory firm, recently announced its acquisition of Portland, Maine-based independent wealth adviser Plimsoll Mark Capital. The transaction was completed on December 31. Financial terms of the deal were not disclosed. Hartland advises about 70 institutions and about 250 private families and individuals on roughly $15 billion in combined assets. K&D Group Ι Commercial Real Estate: Development The Halle Building, a famous downtown Cleveland department store turned into an office building in the 1980s, is positioned to start its next transformation after the K&D Group recently acquired it for $20 million. The seller of the 13-story, 400,000-square-foot building at 1228 Euclid Avenue was an affiliate of Forest City Enterprises, which had been marketing the half-empty office building for more than a year. K&D plans to install about 240 multifamily units in the building in 2018. Panther Premium Logistics Ι Logistics Services: Relocation Panther Premium Logistics, a specialized freight carrier based in the Medina County community of Seville since 2004, has completed the move to its new corporate headquarters and dispatch center in Sharon Township. The new facility, also in Medina County, has 50,000 square feet of office space and a 9,000-square-foot service bay for applying decals and GPS units to trucks. Summit Cleveland LP Ι Commercial Real Estate: Acquisition Northeast Ohio's largest suburban office park changed hands recently in a $26.5 million transaction that brought new blood to the Cleveland commercial real estate market. Summit Cleveland LP, Canadian investor group, bought Summit Office Park from Aegon, a lender that has owned the Independence properties since 2009. The sale involved nearly 500,000 square feet of office space across four buildings in the Rockside Road submarket. Employment statistics Cleveland Industry employment stratification Cleveland Educational & Health Services, 198,100, 19% Trade, Transportation & Utilities, 185,800, 18% Professional & Business Services, 151,800, 14% Government, 133,500, 13% Manufacturing, 125,500 , 12% Leisure & Hospitality, 95,600, 9% Financial Activities, 62,400 , 6% Mining, Logging & Construction, 41,800, 4% Other Services, 40,100, 4% Information, 14,800, 1% Andrew Batson Senior Research Analyst Great Lakes Region tel +1 216 937 4374 Andrew.Batson@am.jll.com 127 Public Square, Suite 2410 Cleveland, OH 44114 www.jll.com/cleveland Robert Kramp Senior Vice President – Americas Midwest & Great Lakes Research Director tel +1 312 228 2470 Robert.Kramp@am.jll.com 200 East Randolph Street, 47th Floor Chicago, IL 60601 www.us.joneslanglasalle.com/research © 2014 Jones Lang LaSalle IP, Inc. All rights reserved. All information contained herein is from sources deemed reliable; however, no representation or warranty is made to the accuracy thereof.