
Downloaded 1,456 times
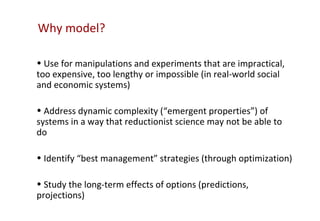
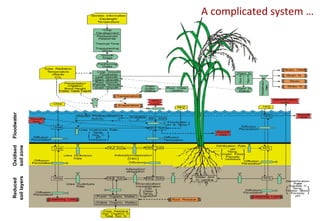
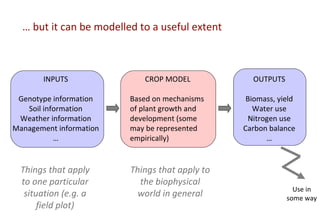
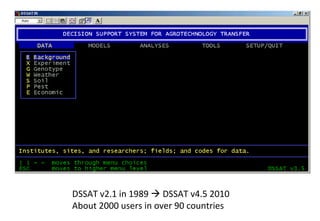
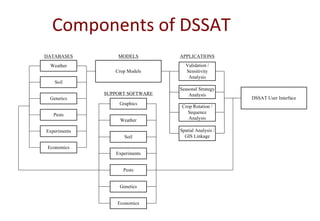
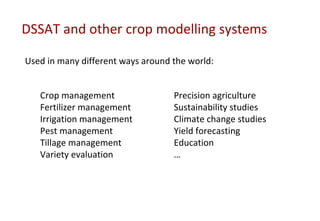
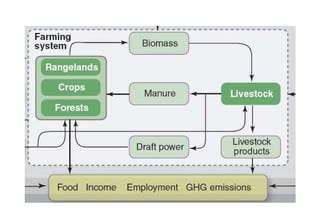
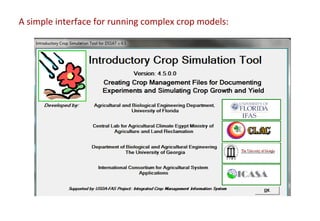

Crop modelling with DSSAT allows researchers to: 1) Conduct experiments and analyses that would be impractical, too expensive, or impossible in real world conditions. 2) Study the long-term effects of management options through simulations and predictions. 3) Develop optimal management strategies through analysis of factors like weather, soil conditions, genotypes, and practices. DSSAT is a widely used crop modeling system that incorporates biophysical models of plant growth and development to simulate crop performance under different conditions and management scenarios.


![[Day 2] Center Presentation: IFPRI](https://cdn.slidesharecdn.com/ss_thumbnails/cgiar-csi-day2-1apr2009-center-ifpri-090405003244-phpapp02-thumbnail.jpg?width=640&height=640&fit=bounds)


