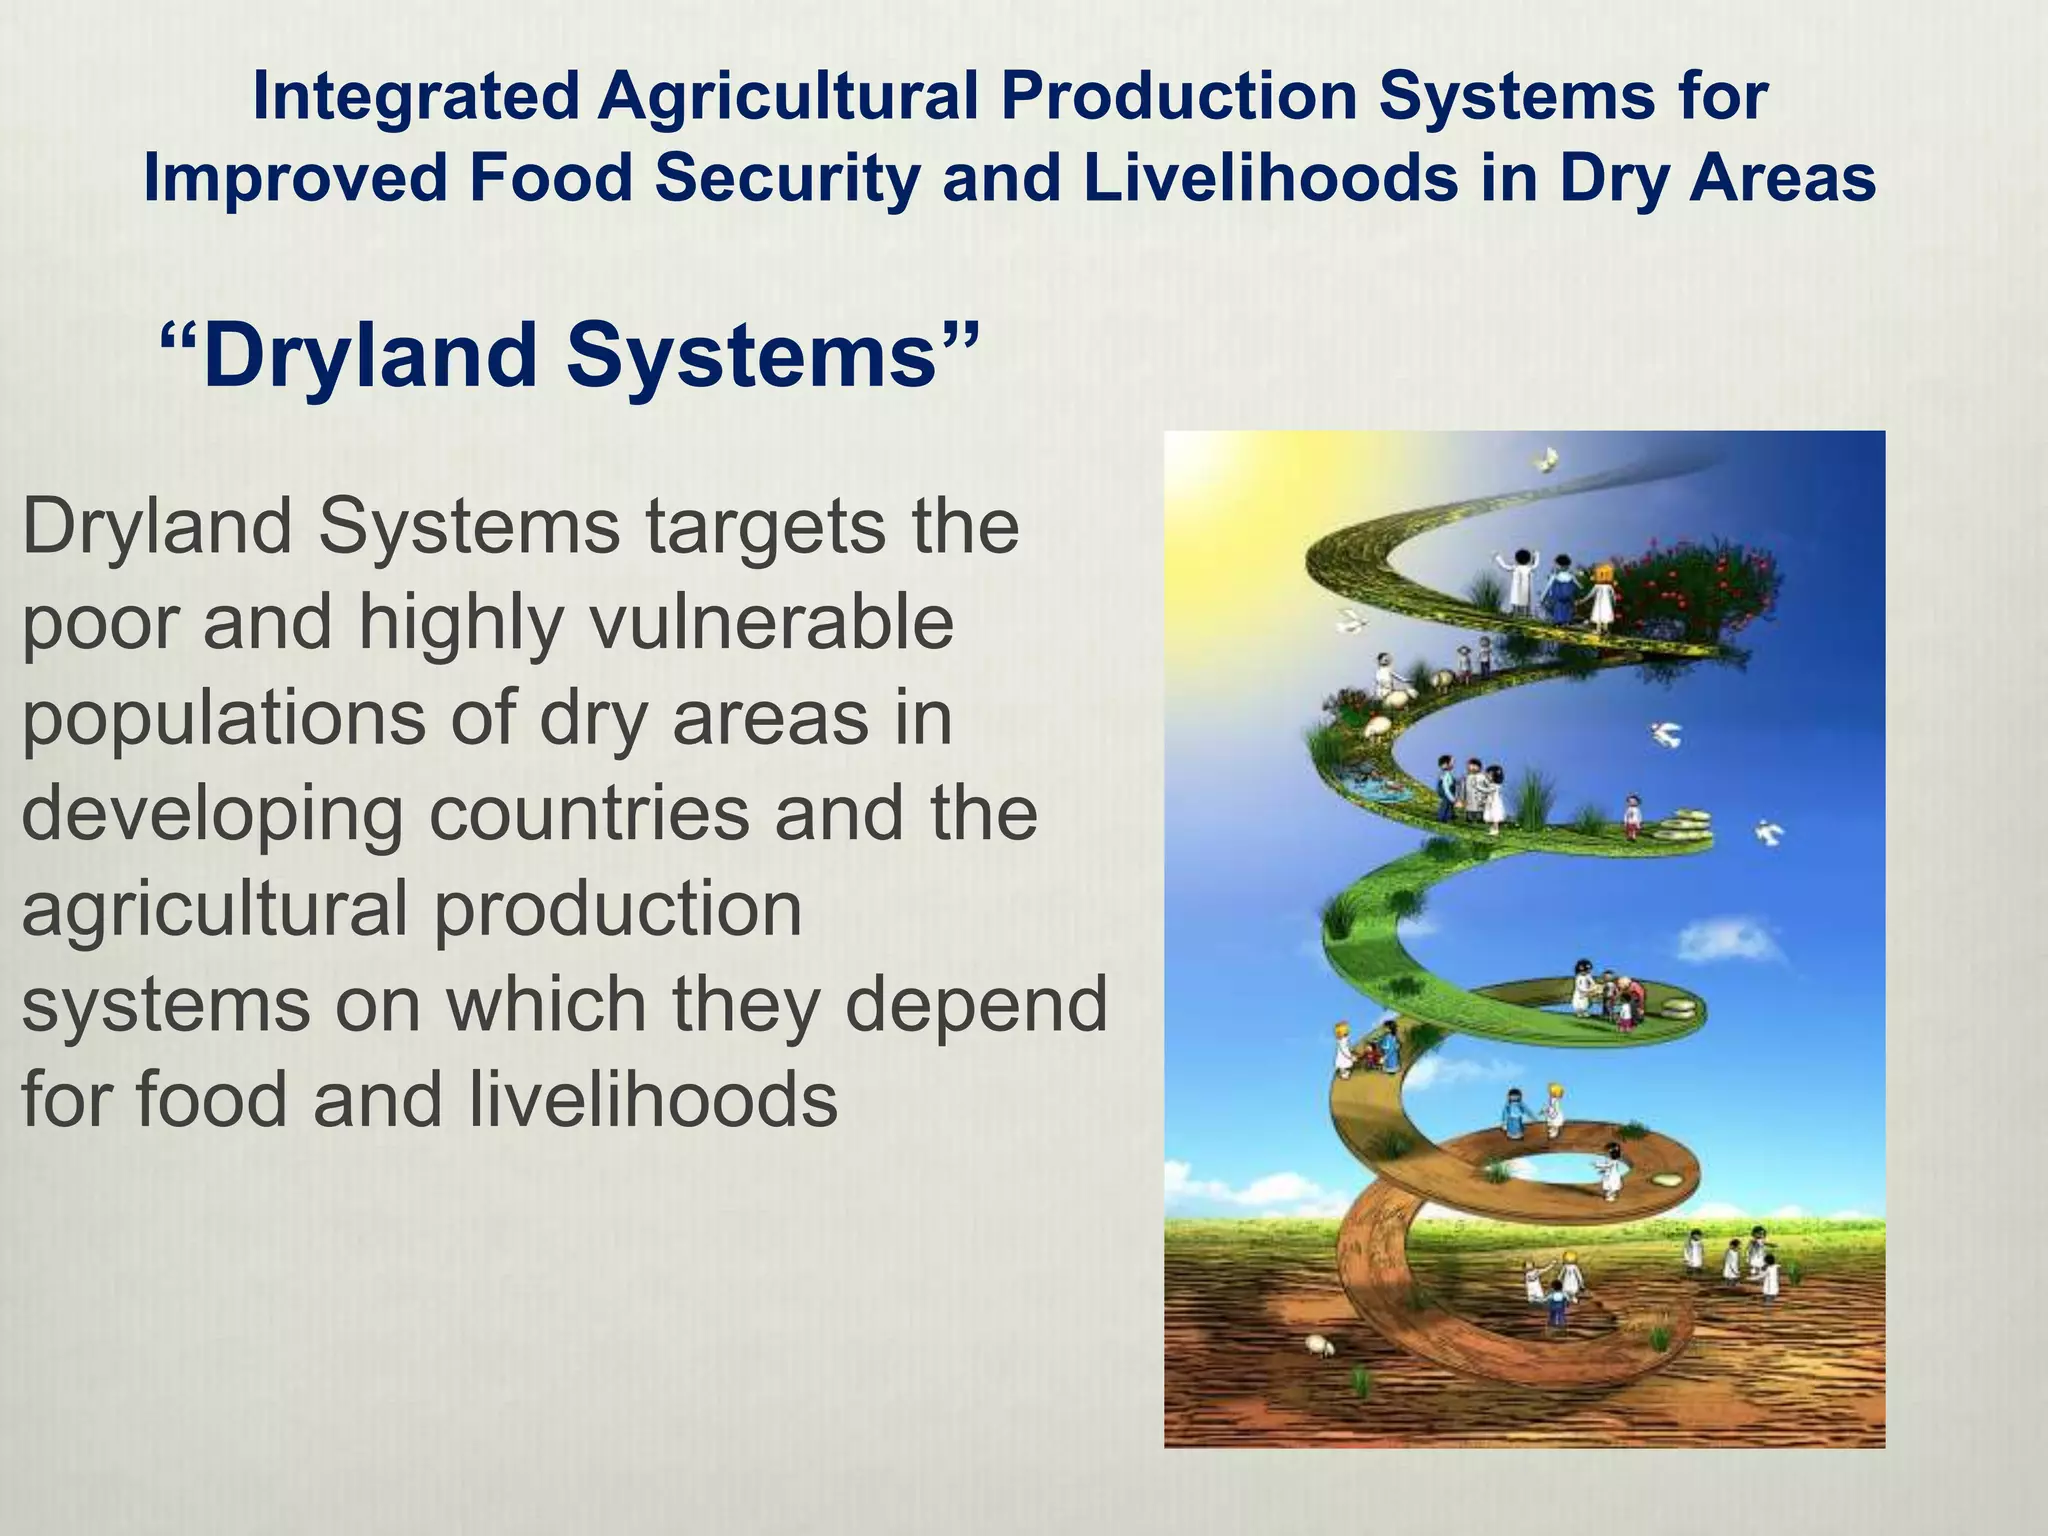
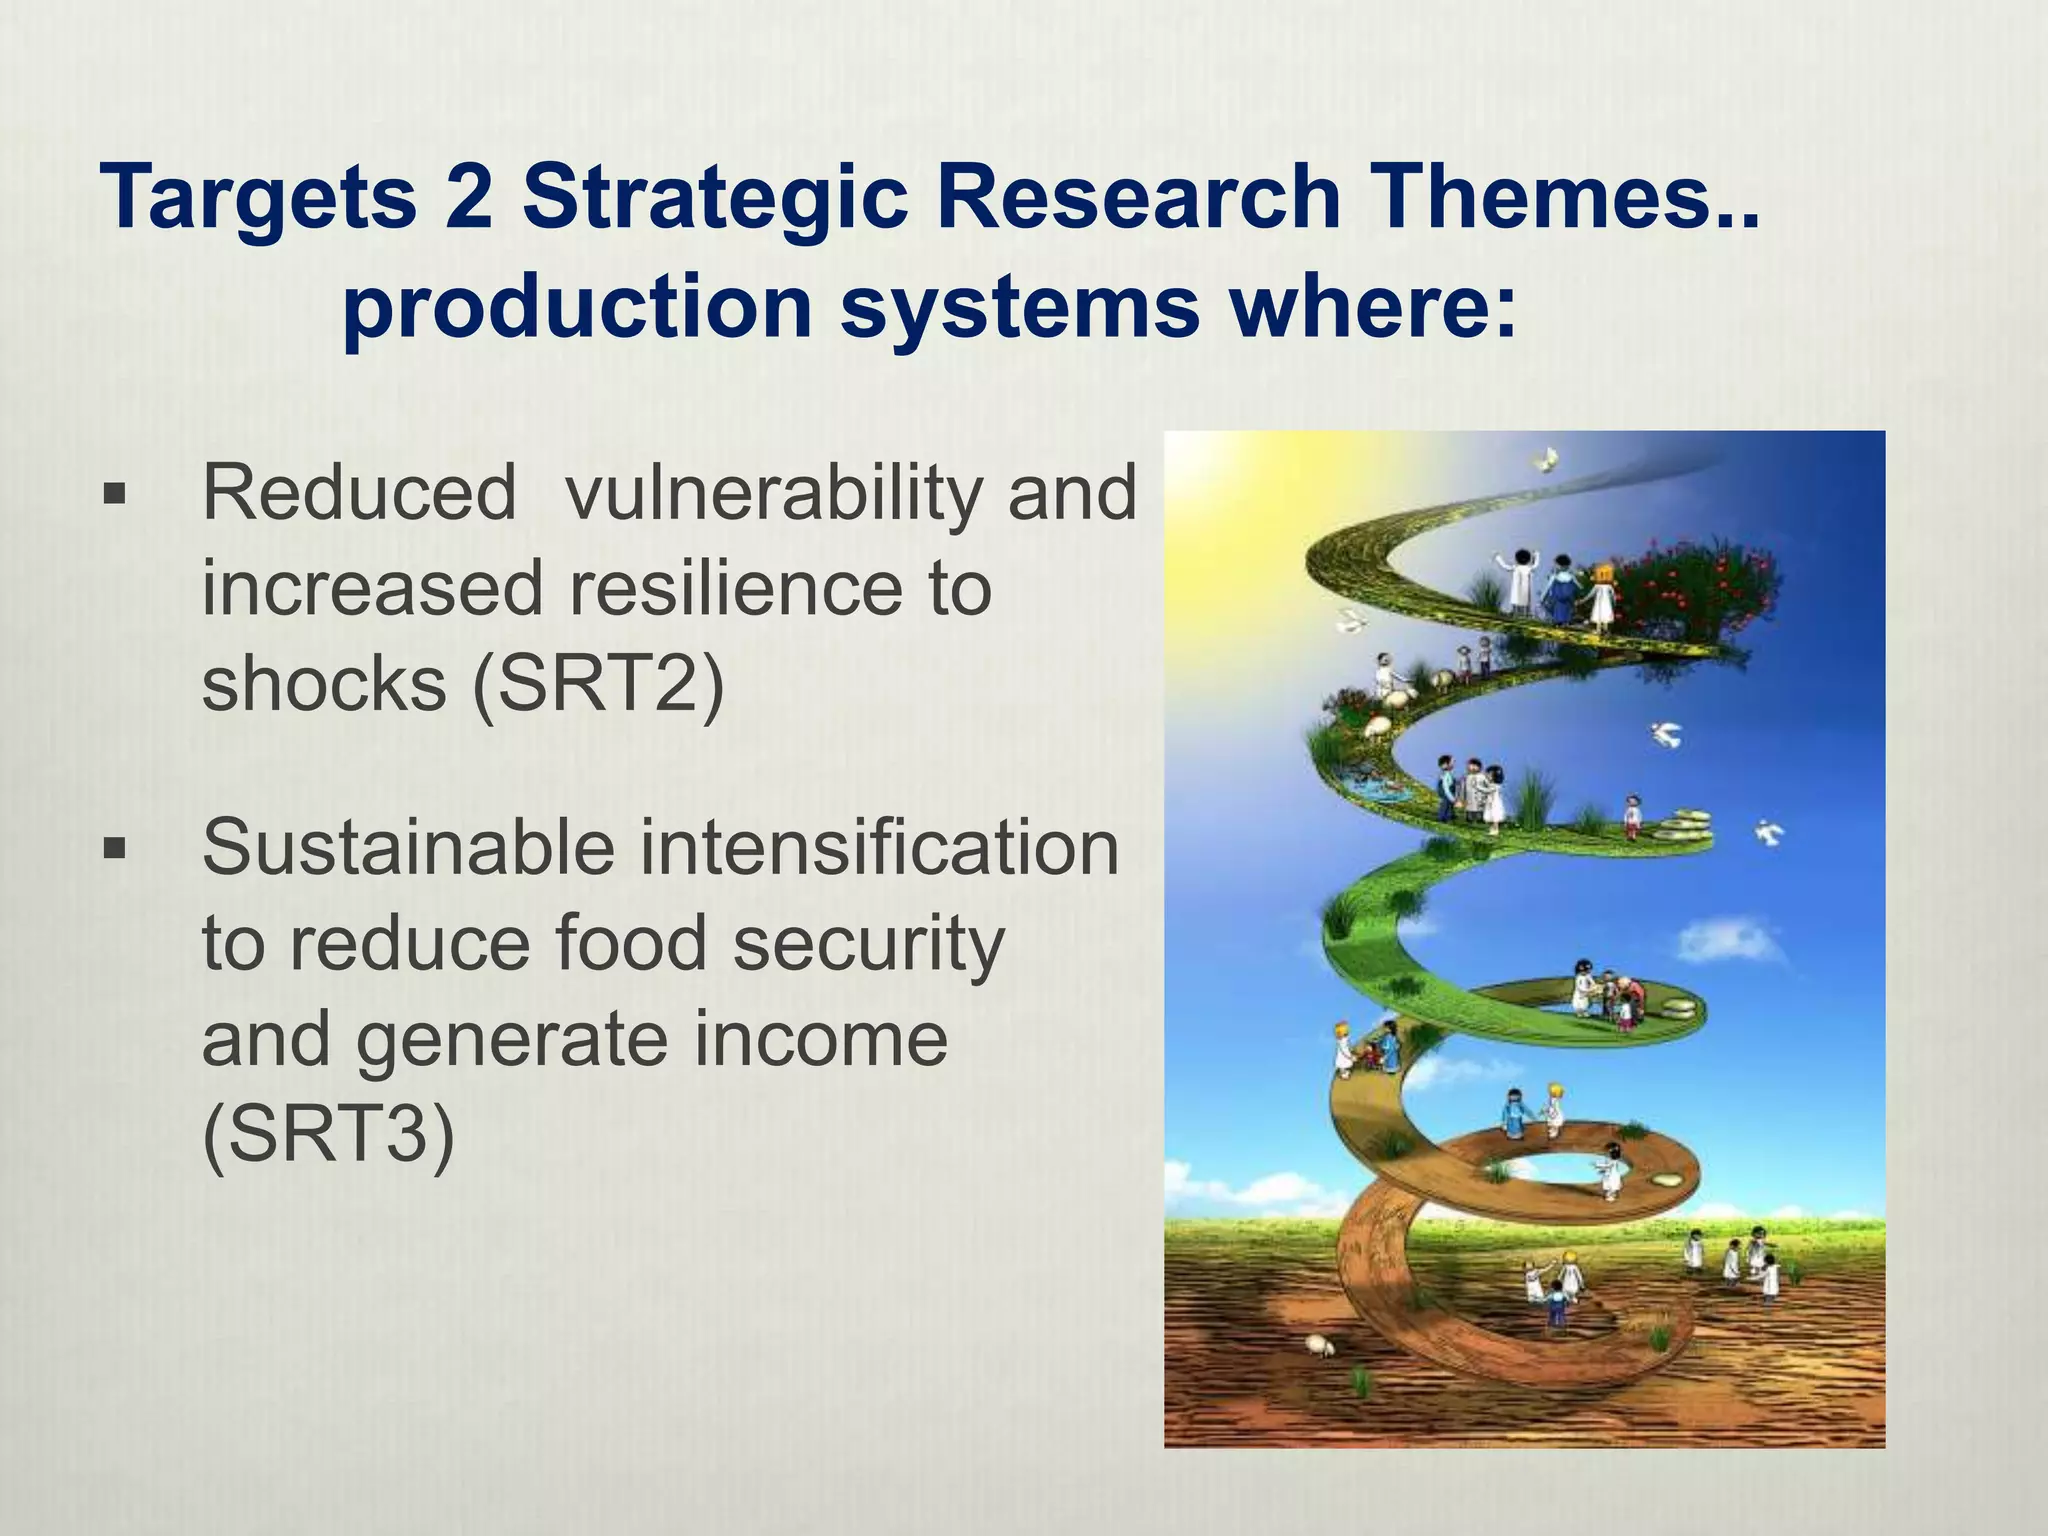
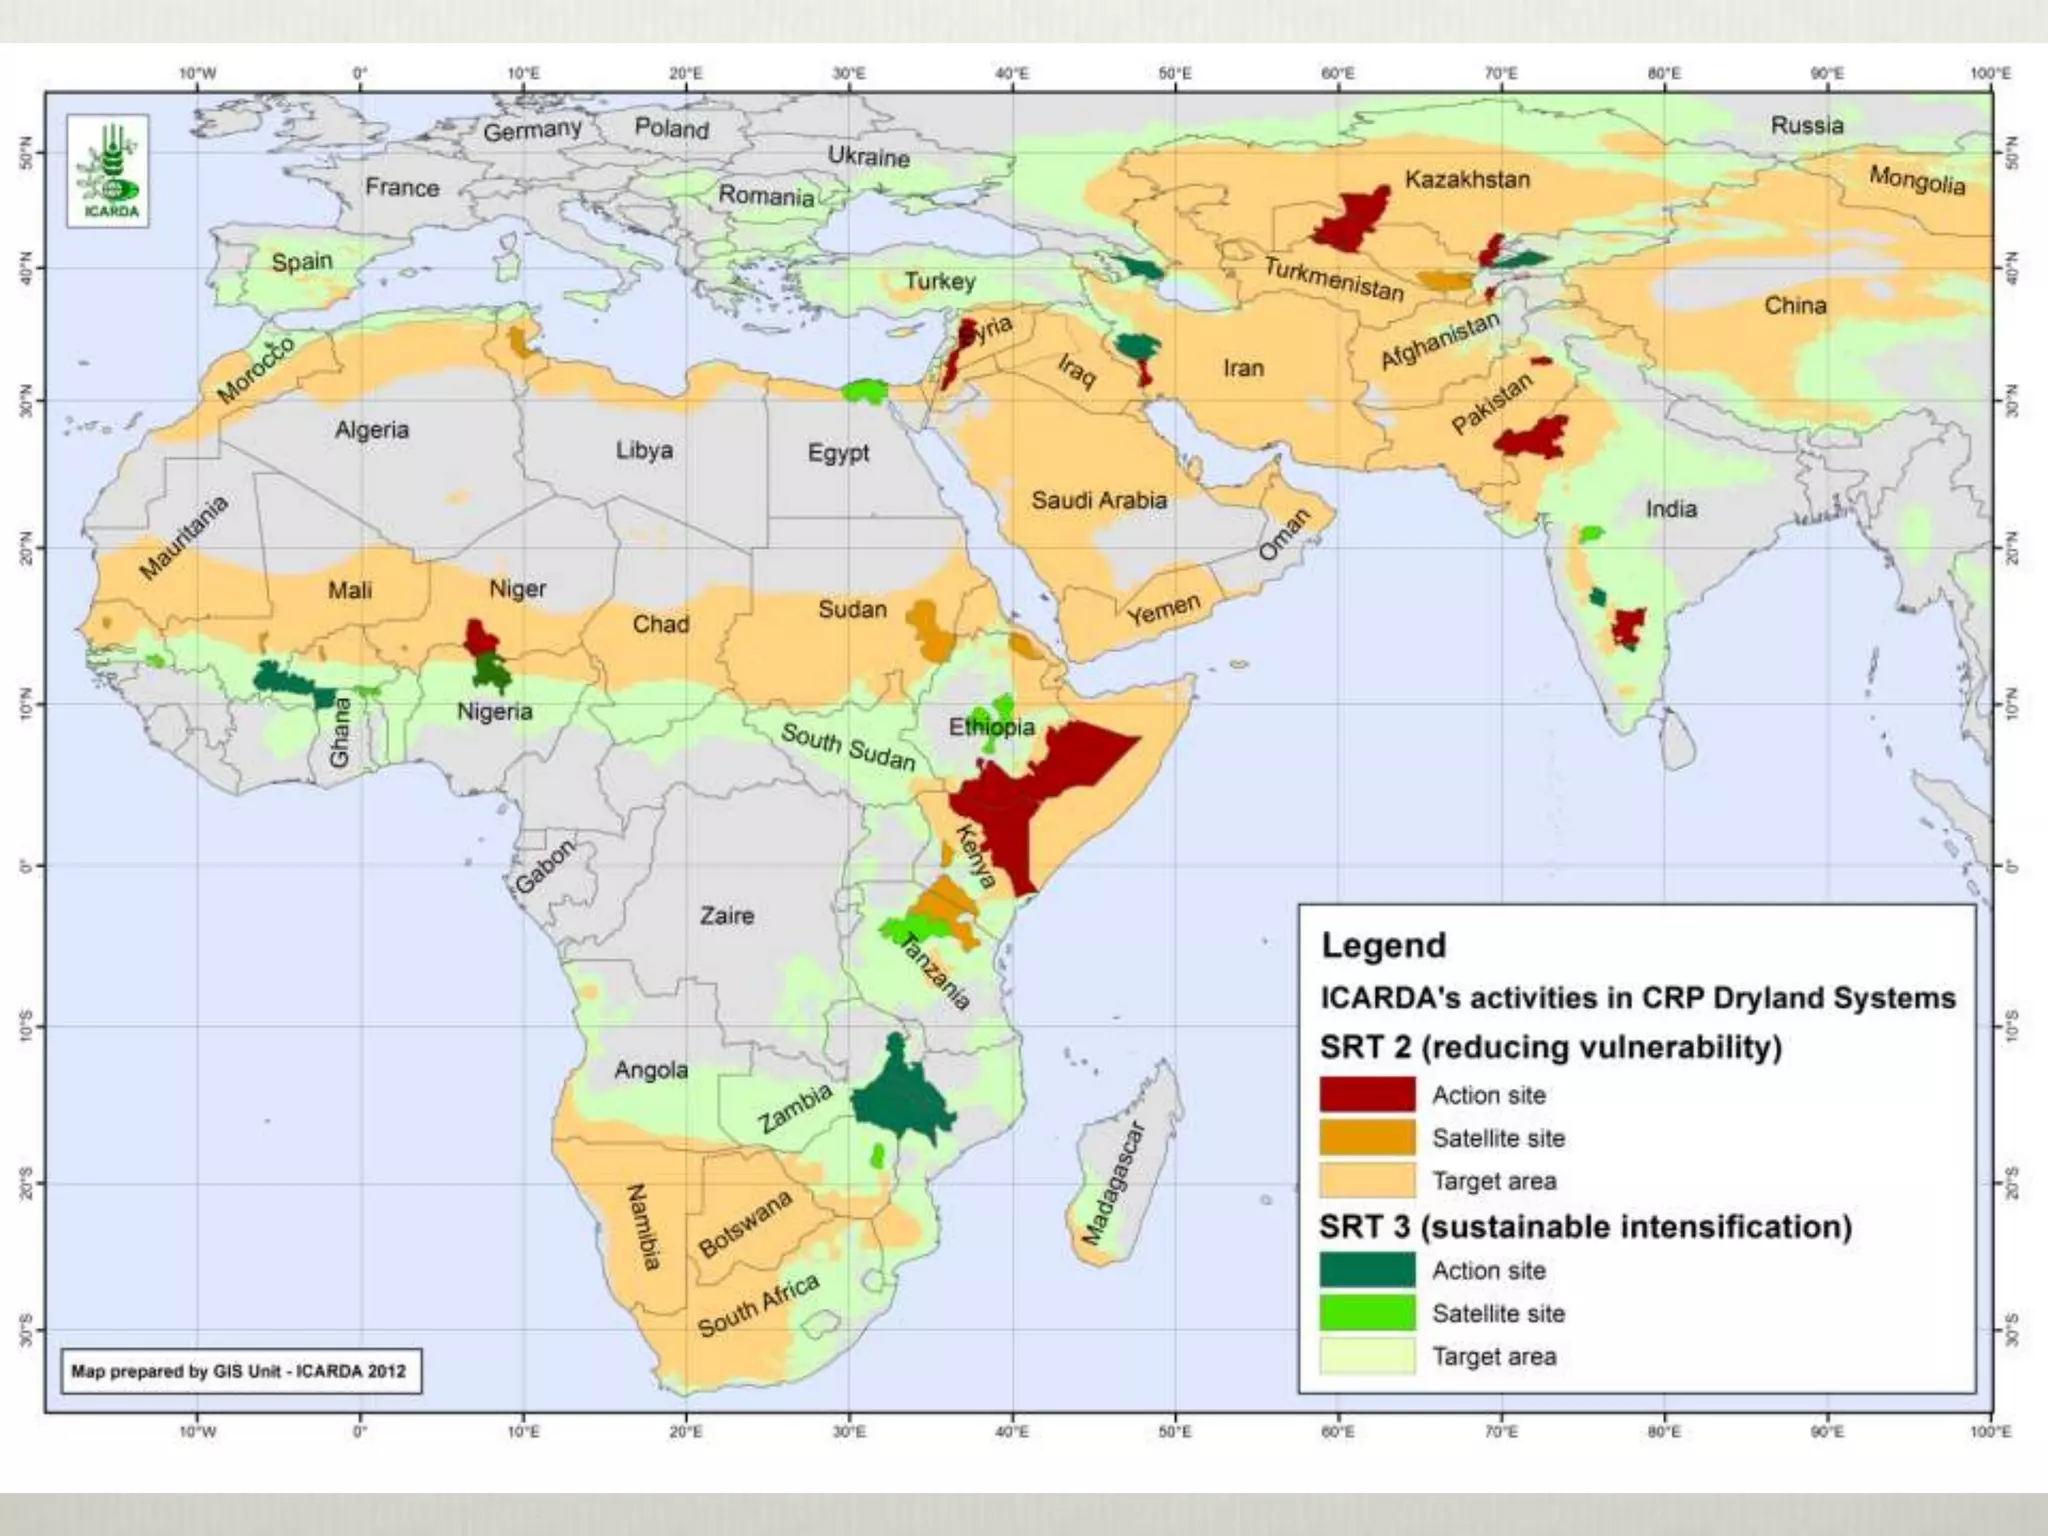
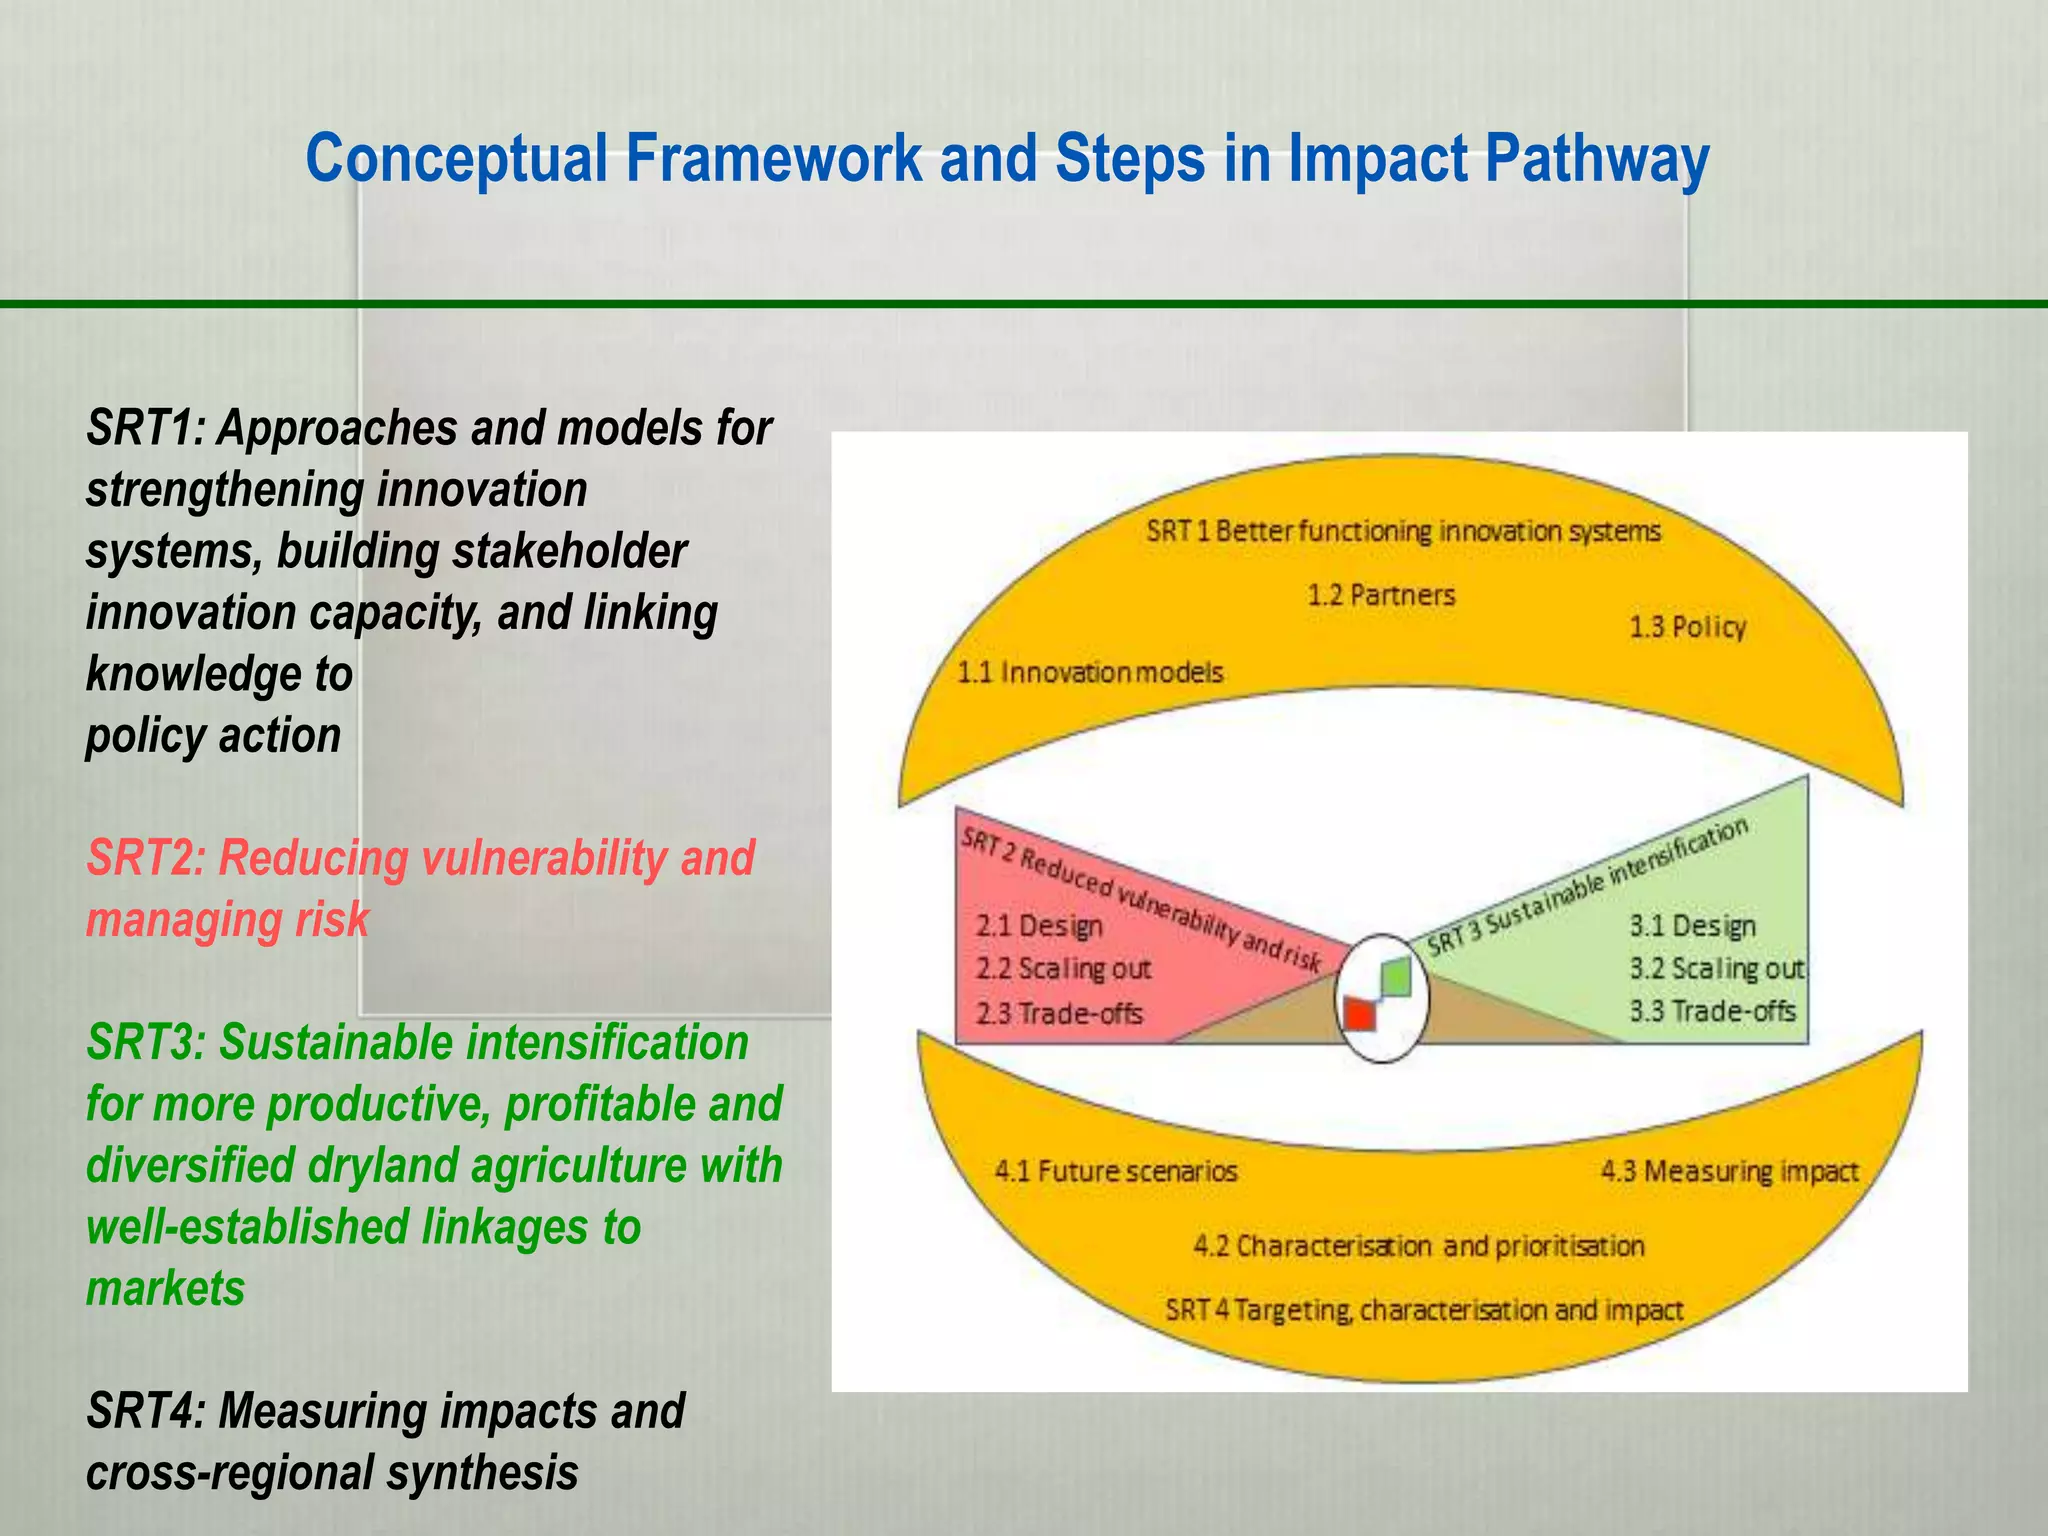
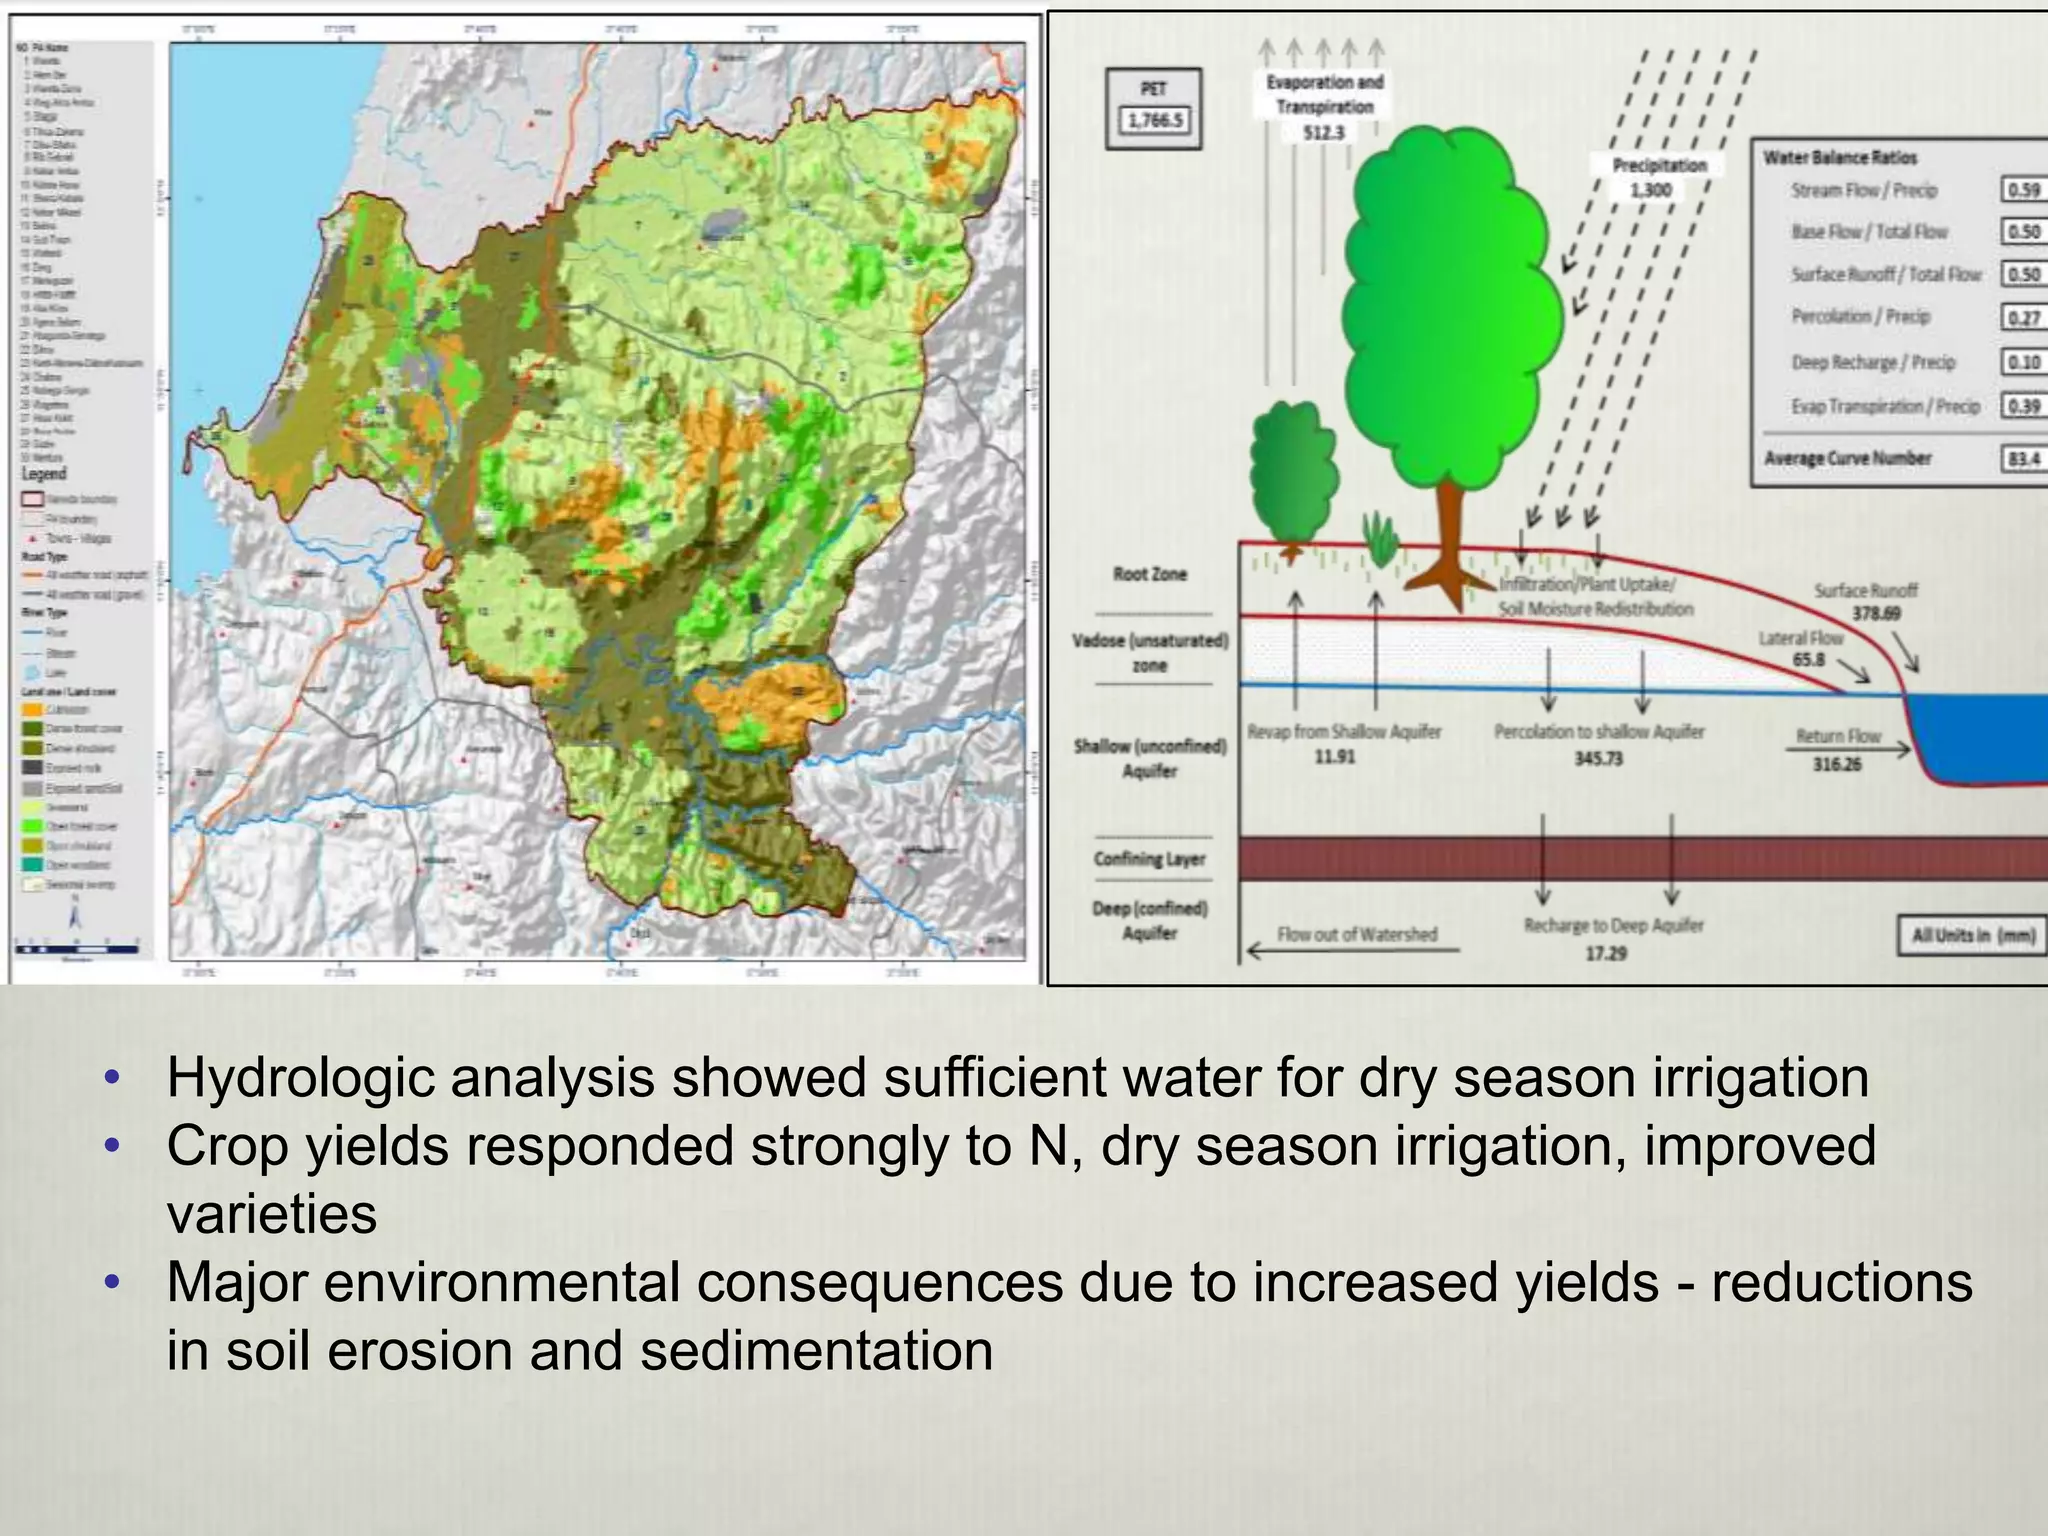
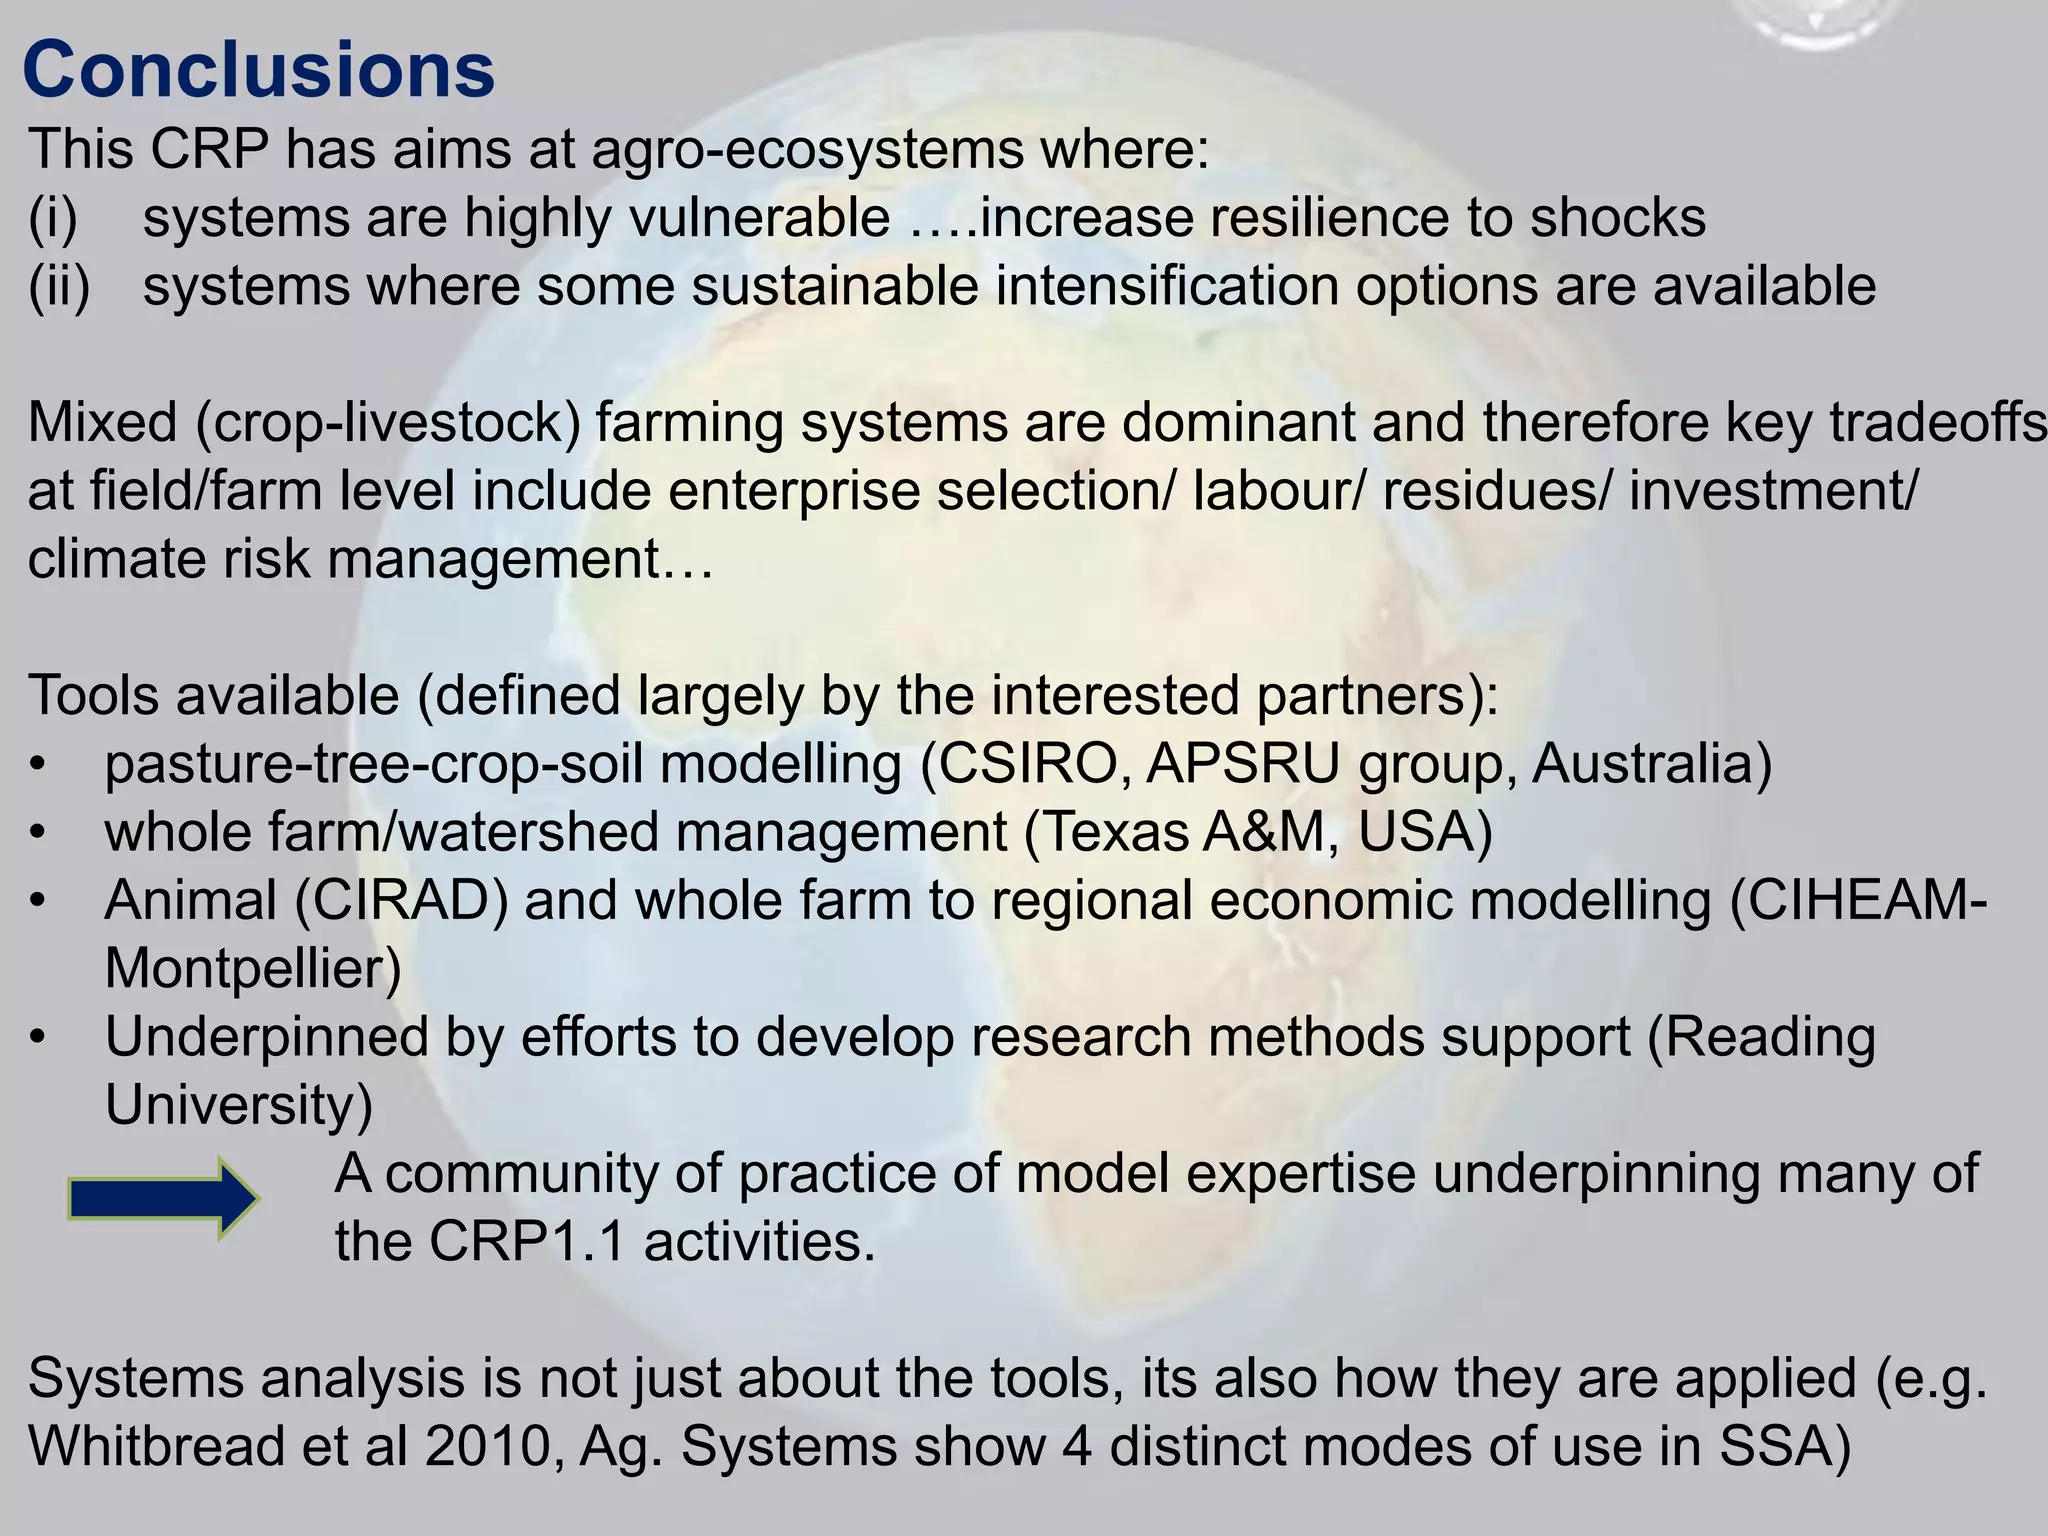
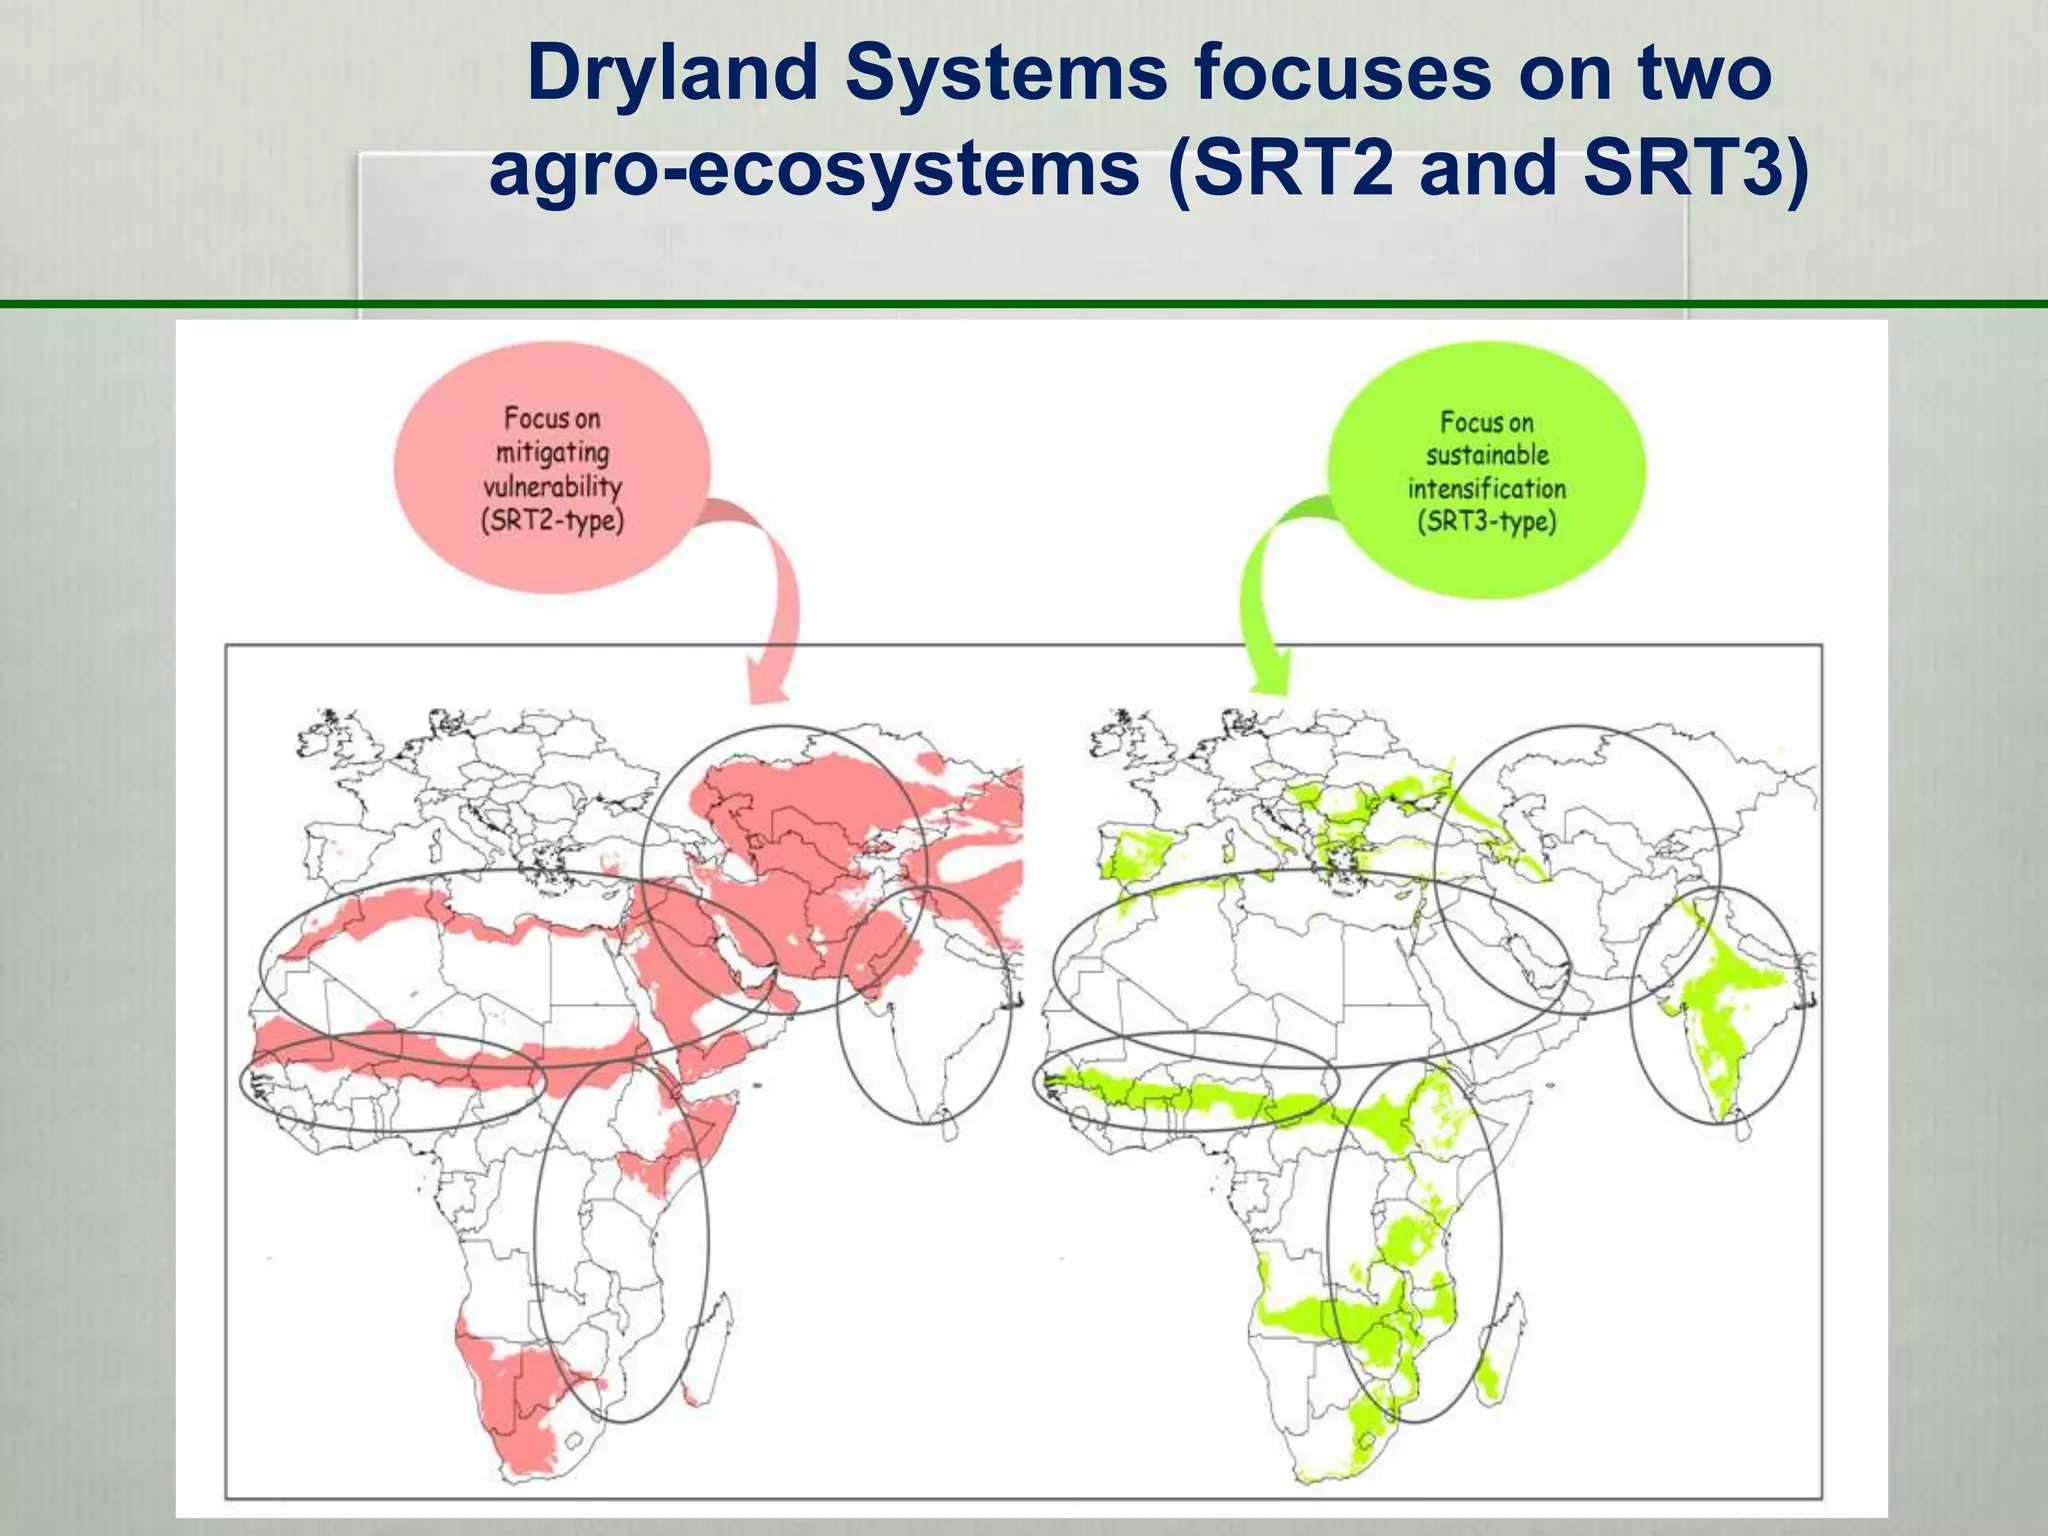
This document summarizes the "Dryland Systems" program, which focuses on improving food security and livelihoods in dryland areas. It targets vulnerable populations dependent on agricultural systems in developing countries. The program focuses on two strategic research themes: 1) reducing vulnerability and increasing resilience to shocks, and 2) sustainably intensifying production to improve food security and income. It aims to use systems analysis approaches and modeling tools at various scales to understand key tradeoffs and interventions. Models are used from the plant to regional scales to simulate impacts and inform the program.
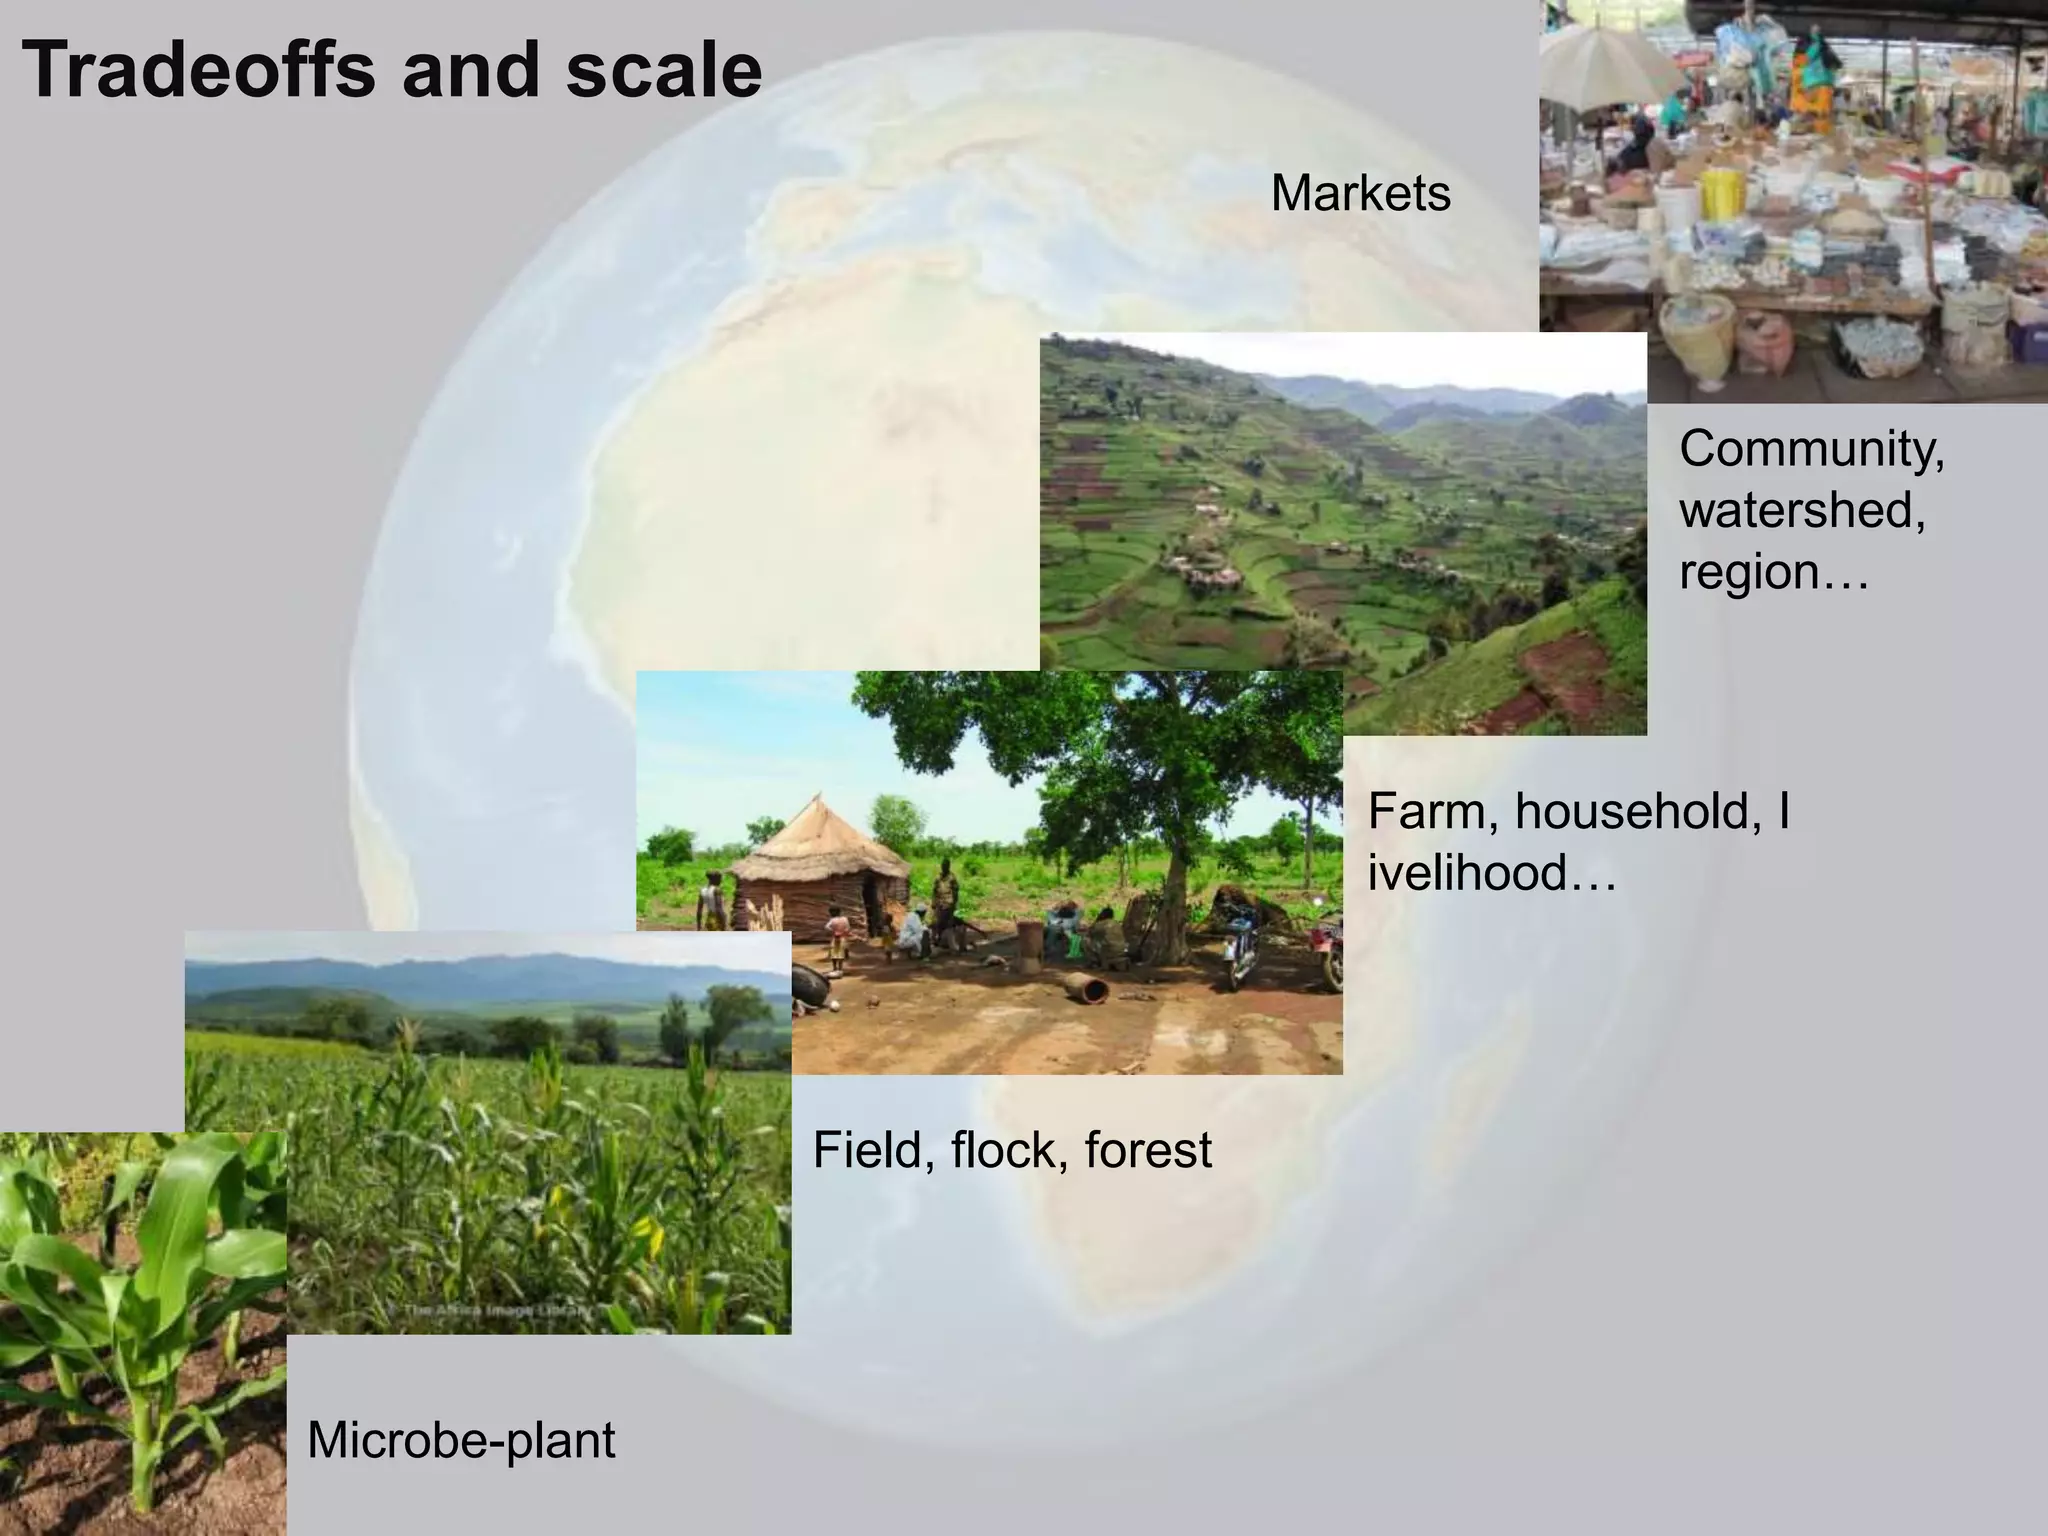
![Key tradeoffs and tools: plant to field scale
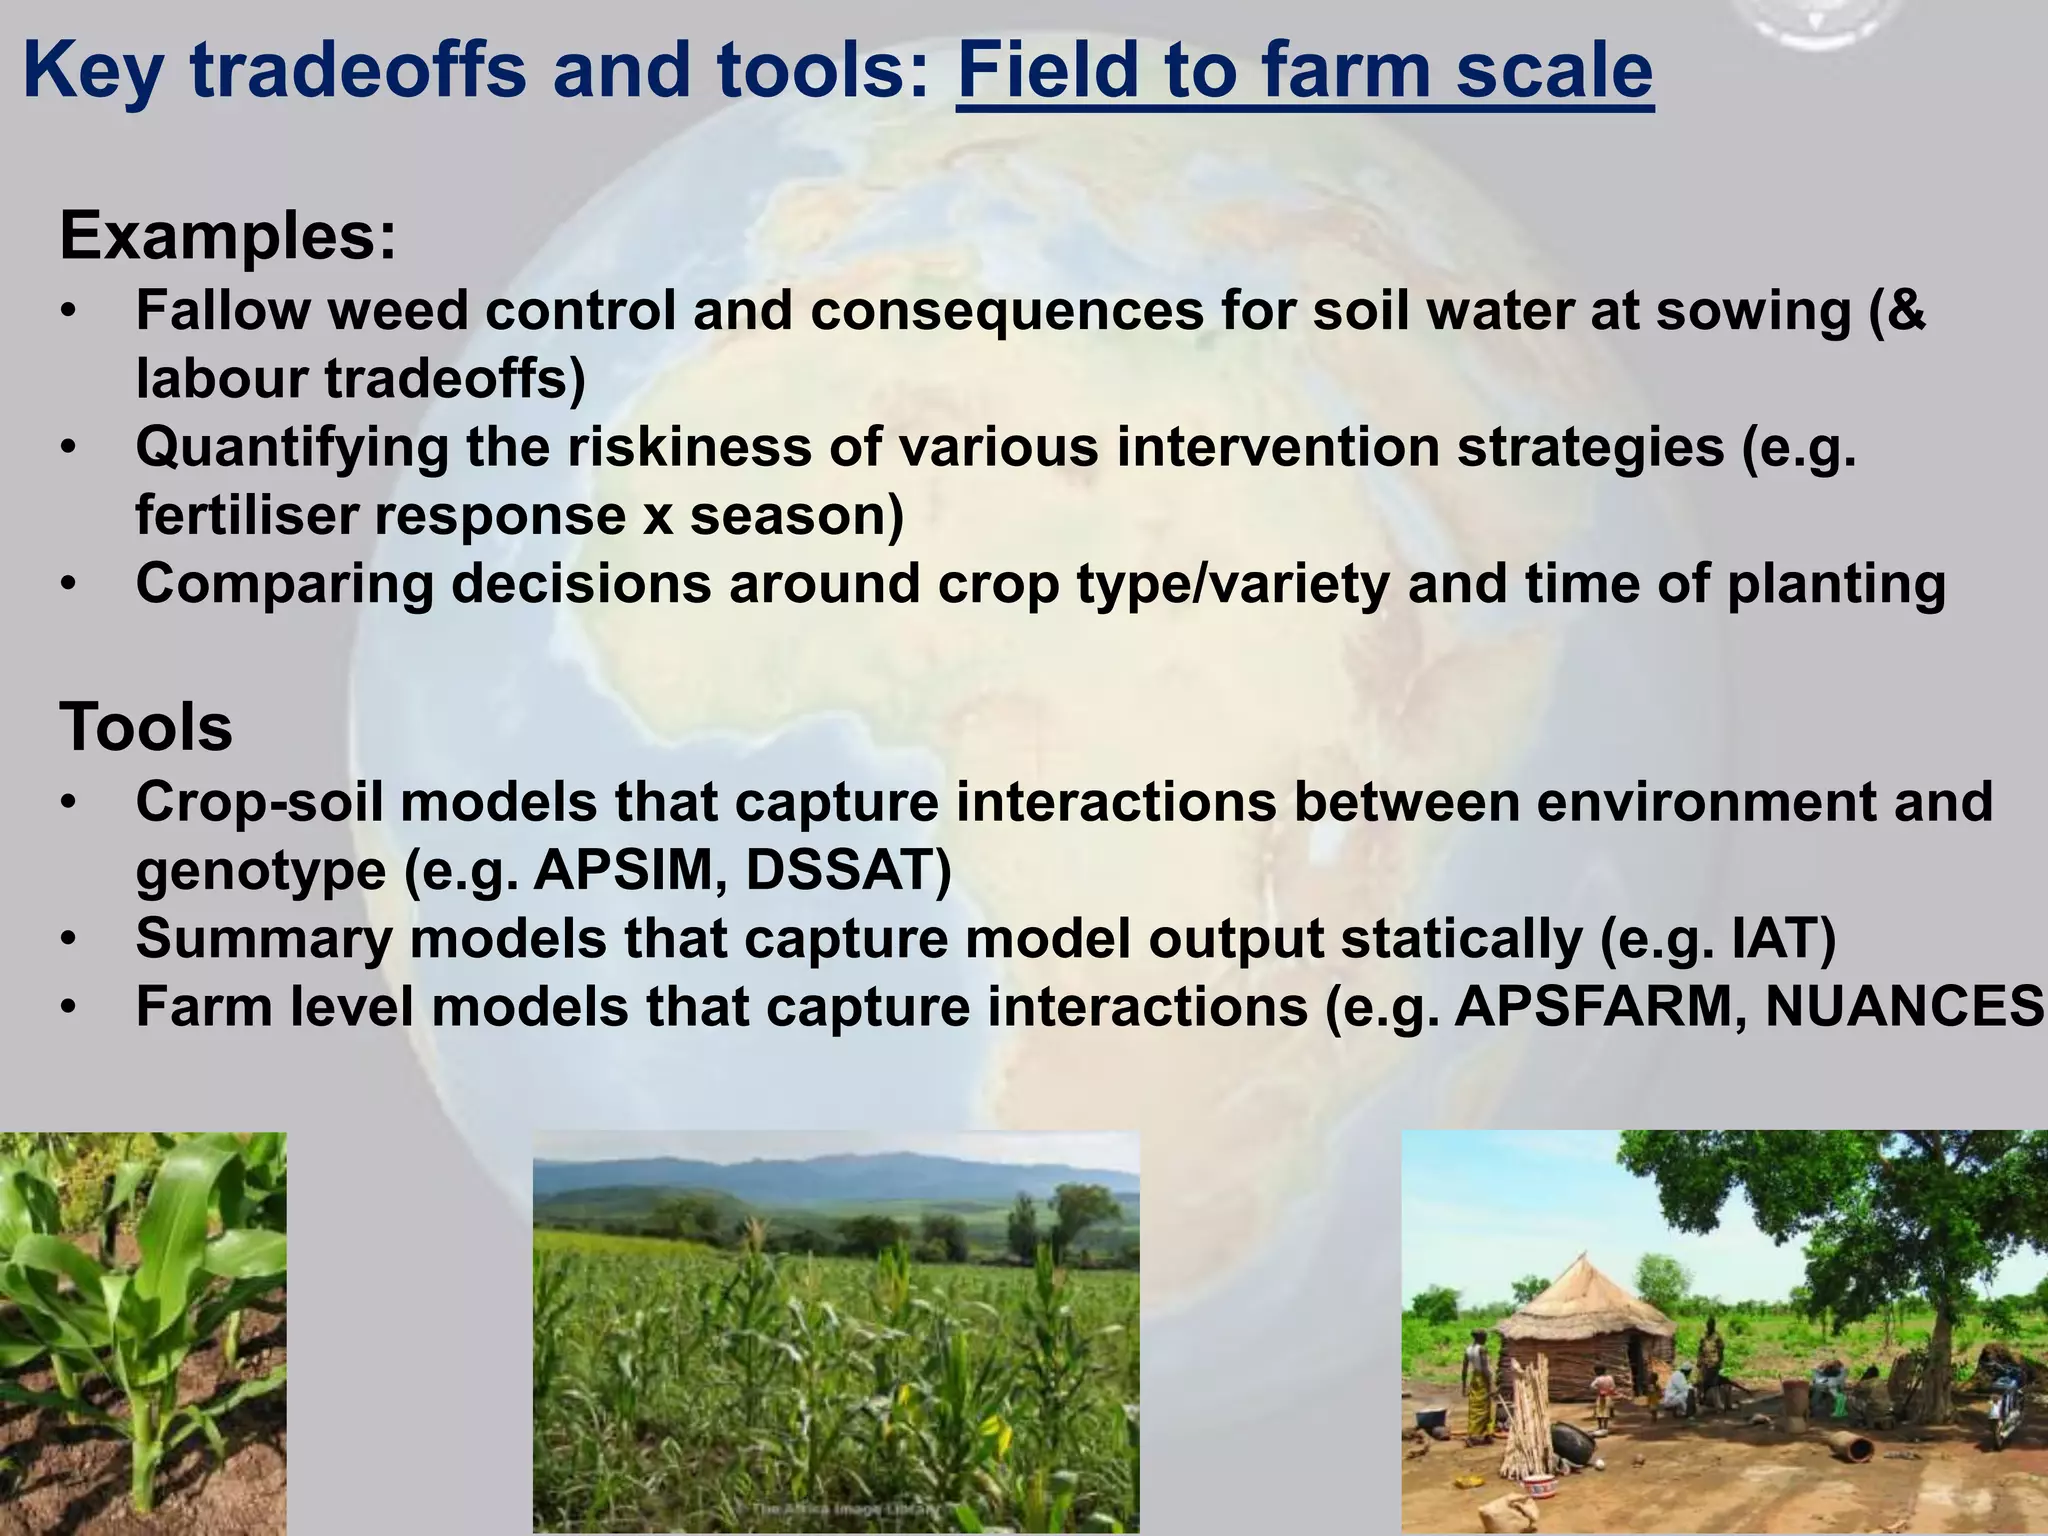
Examples
• High and low harvest index (fodder, building material Vs grain)
• Short duration risk avoidance Vs longer duration higher yielding
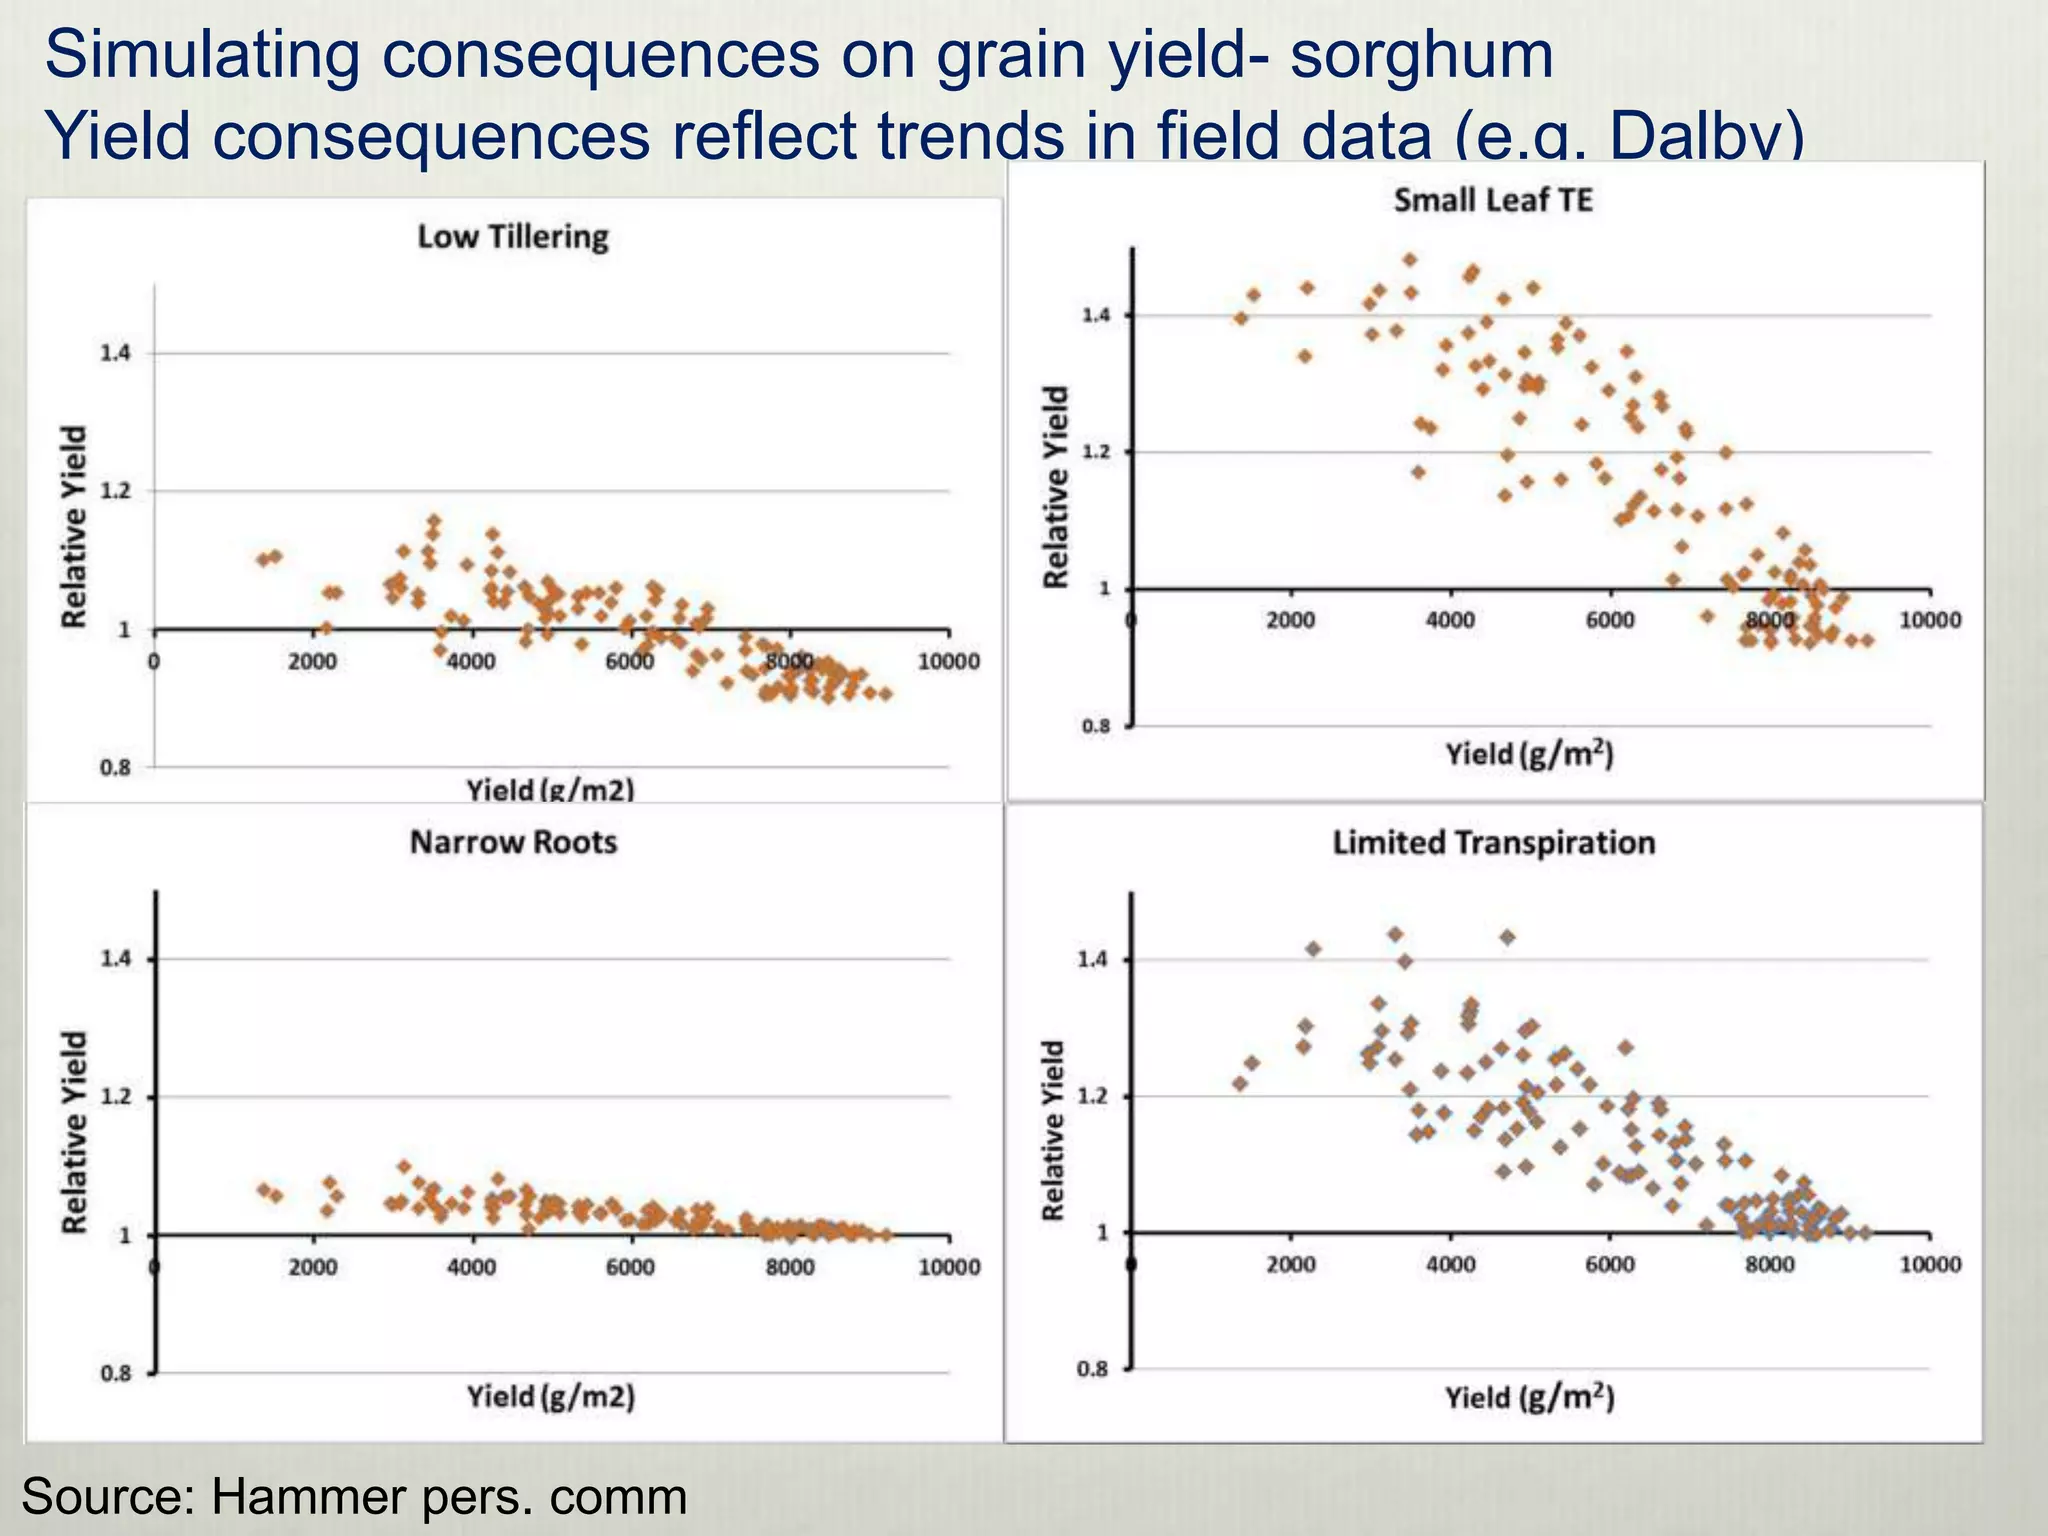
• Effect of stay green traits in sorghum across environment
Tools
• Detailed crop models that capture interactions between environment
and genotype….and phenotype
e.g. Hammer et al. (2010) uses “….sufficient physiological rigour for complex
phenotypic traits to become emergent properties of the model dynamics.”
[Hammer et al. 2010. J. Exp. Botany 61(8), 2185-2202.]
Microbe-plant](https://image.slidesharecdn.com/19feb2013crp1-1anthonywhitbread-130304094112-phpapp02/75/Workshop-Trade-off-Analysis-CGIAR_19-Feb-2013_CRP-1-1_Anthony-Whitbread-8-2048.jpg)


![[Day 2] Center Presentation: IFPRI](https://cdn.slidesharecdn.com/ss_thumbnails/cgiar-csi-day2-1apr2009-center-ifpri-090405003244-phpapp02-thumbnail.jpg?width=640&height=640&fit=bounds)


