Downloaded 1,906 times


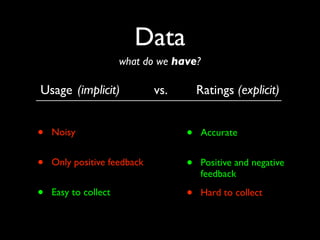
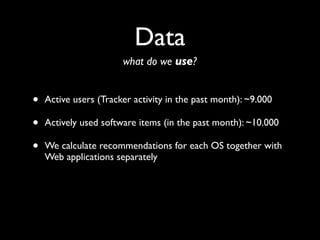


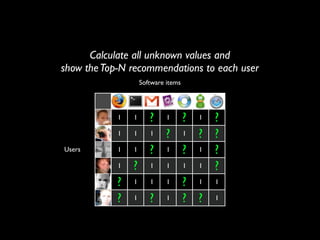
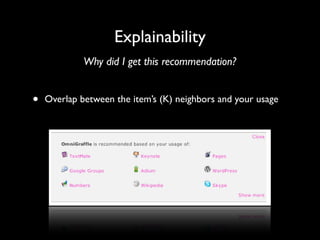
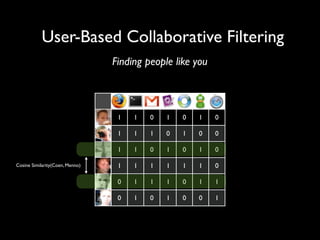
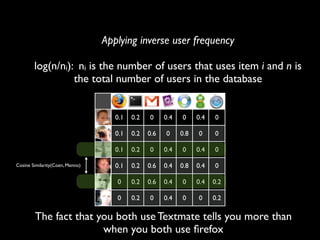

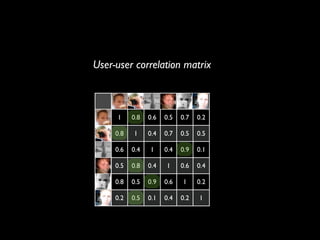
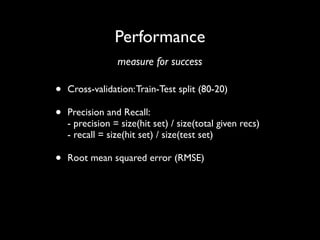
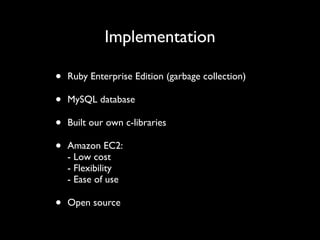


The document discusses building a recommender system using collaborative filtering approaches. It describes collecting usage and rating data, calculating item-item and user-user similarities, making predictions for unknown values using k-nearest neighbors, and evaluating the system using measures like precision, recall and root mean squared error. Implementation details like programming languages, databases and cloud infrastructure are also summarized.


![[Final]collaborative filtering and recommender systems](https://cdn.slidesharecdn.com/ss_thumbnails/finalcollaborativefilteringandrecommendersystems-141103044224-conversion-gate01-thumbnail.jpg?width=640&height=640&fit=bounds)