Investment patterns report january 2019
•
0 likes•69 views

Investment patterns report january 2019

Recommended
Recommended
More Related Content
What's hot
What's hot (20)
Similar to Investment patterns report january 2019
Similar to Investment patterns report january 2019 (20)
More from ahli bank
More from ahli bank (20)
Recently uploaded
Recently uploaded (20)
Investment patterns report january 2019
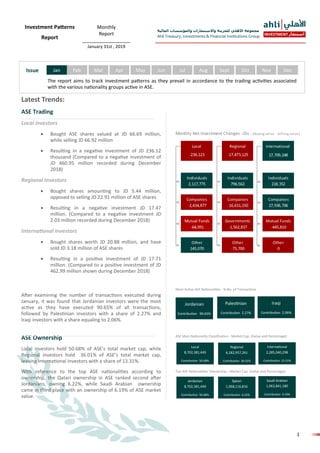
- 1. المالية والمؤسسات واالستثمارات للخزينة األهلي مجموعة Ahli Treasury, Investments & Financial Institutions Group 1 INVESTMENT استثمار Jan Feb Mar Apr May Jun Jul Aug Sept Oct Nov DecIssue Investment Patterns Report Monthly Report __________________ January 31st , 2019 The report aims to track investment patterns as they prevail in accordance to the trading activities associated with the various nationality groups active in ASE. Latest Trends: ASE Trading Local investors • Bought ASE shares valued at JD 66.69 million, while selling JD 66.92 million • Resulting in a negative investment of JD 236.12 thousand (Compared to a negative investment of JD 460.95 million recorded during December 2018) Regional Investors • Bought shares amounting to JD 5.44 million, opposed to selling JD 22.91 million of ASE shares • Resulting in a negative investment JD 17.47 million. (Compared to a negative investment JD 2.03 million recorded during December 2018) International investors • Bought shares worth JD 20.88 million, and have sold JD 3.18 million of ASE shares • Resulting in a positive investment of JD 17.71 million. (Compared to a positive investment of JD 462.99 million shown during December 2018) After examining the number of transactions executed during January, it was found that Jordanian investors were the most active as they have executed 90.65% of all transactions, followed by Palestinian investors with a share of 2.27% and Iraqi investors with a share equaling to 2.06%. ASE Ownership Local investors hold 50.68% of ASE’s total market cap, while Regional investors hold 36.01% of ASE’s total market cap, leaving International investors with a share of 13.31%. With reference to the top ASE nationalities according to ownership, the Qatari ownership in ASE ranked second after Jordanians, owning 6.22%, while Saudi Arabian ownership came in third place with an ownership of 6.19% of ASE market value. Jordanian Contribution 90.65% Iraqi Contribution 2.06% Palestinian Contribution 2.27% Most Active ASE Nationalities - % No. of Transactions Local 8,702,381,449 Contribution 50.68% Regional 6,182,957,261 Contribution 36.01% Saudi Arabian 1,062,841,180 Contribution 6.19% ASE Main Nationality Classification - Market Cap. (Value and Percentage): Top ASE Nationalities’ Ownership—Market Cap. (Value and Percentage): Qatari 1,068,116,816 Contribution 6.22% Jordanian 8,702,381,449 Contribution 50.68% International 2,285,040,298 Contribution 13.31%
- 2. المالية والمؤسسات واالستثمارات للخزينة األهلي مجموعة Ahli Treasury, Investments & Financial Institutions Group 2 INVESTMENT استثمار ASE Nationality Classification - By Sector Net Investment - JD Million BySector Nationality Sell Buy Net Investment JD (Market Value)Securities Market Value Securities Market Value Banking Sector Local 3,152,441 6,352,540 3,920,456 9,505,178 3,152,638 Regional 1,065,890 4,782,240 598,206 2,414,469 -2,367,771 International 496,900 1,365,282 196,569 580,414 -784,867 Total Banking 4,715,231 12,500,062 4,715,231 12,500,062 Insurance Sector Local 223,522 209,345 175,423 238,916 29,571 Regional 2,364 3,418 5,652 7,640 4,222 International 25,000 105,000 69,811 71,207 -33,793 Total Insurance 250,886 317,763 250,886 317,763 Services Sector Local 51,932,455 47,475,519 51,643,283 43,823,610 -3,651,909 Regional 3,804,207 16,699,735 2,829,517 1,440,321 -15,259,414 International 662,726 1,160,388 1,926,588 20,071,710 18,911,323 Total Services 56,399,388 65,335,642 56,399,388 65,335,642 Industry Sector Local 13,224,631 12,889,270 13,312,839 13,122,846 233,576 Regional 2,023,695 1,429,181 2,095,899 1,579,020 149,839 International 233,572 544,409 73,160 160,994 -383,415 Total Industry 15,481,898 14,862,860 15,481,898 14,862,860 All Sectors Local 68,533,049 66,926,674 69,052,001 66,690,550 -236,123 Regional 6,896,156 22,914,575 5,529,274 5,441,450 -17,473,125 International 1,418,198 3,175,079 2,266,128 20,884,327 17,709,248 Grand Total 76,847,403 93,016,327 76,847,403 93,016,327 Local -0.24 Regional -17.47 International 17.71
- 3. المالية والمؤسسات واالستثمارات للخزينة األهلي مجموعة Ahli Treasury, Investments & Financial Institutions Group 3 INVESTMENT استثمار ASE Nationality Classification - By Investor Category Net Investment - JD Million ByInvestorCategory Nationality Investor Category Sell Buy Net Investment JD (Market Value)Securities Market Value Securities Market Value Local Individuals 56,807,322 51,170,065 58,853,576 53,287,840 2,117,775 Companies 11,392,762 15,282,096 9,752,478 12,847,219 -2,434,877 Mutual Funds 48,946 126,783 41,033 62,692 -64,091 Institutions 3,529 4,129 124,424 144,992 140,863 Organizations 280,490 343,600 280,490 347,808 4,207 Total 68,533,049 66,926,674 69,052,001 66,690,550 -236,123 Regional Individuals 4,780,317 3,519,807 4,885,448 4,316,369 796,562 Companies 1,805,115 17,756,231 643,826 1,125,081 -16,631,150 Mutual Funds 57,500 75,700 0 0 -75,700 Governments 253,224 1,562,837 0 0 -1,562,837 Total 6,896,156 22,914,575 5,529,274 5,441,450 -17,473,125 International Individuals 419,694 292,016 310,415 510,368 218,352 Companies 603,543 1,435,376 1,664,811 19,372,081 17,936,706 Mutual Funds 394,961 1,447,687 290,902 1,001,877 -445,810 Total 1,418,198 3,175,079 2,266,128 20,884,327 17,709,248 All Nationalities Individuals 62,007,333 54,981,888 64,049,439 58,114,577 3,132,688 Companies 13,801,420 34,473,703 12,061,115 33,344,382 -1,129,321 Mutual Funds 501,407 1,650,170 331,935 1,064,569 -585,601 Institutions 3,529 4,129 124,424 144,992 140,863 Organizations 280,490 343,600 280,490 347,808 4,207 Governments 253,224 1,562,837 0 0 -1,562,837 Grand Total 76,847,403 93,016,327 76,847,403 93,016,327 3.13 -1.13 -0.59 0.14 0.00 -1.563 Individuals Companies Mutual Funds Institutions Organizations Governments
- 4. المالية والمؤسسات واالستثمارات للخزينة األهلي مجموعة Ahli Treasury, Investments & Financial Institutions Group 4 INVESTMENT استثمار ASE Ownership Classification OwnershipSectorTop10Nationalities Serial Nationality Shareholders Securities Total Value No. % No. % Amount in JOD % 1 Jordanian 612,520 93.57 5,016,124,668 65.81 8,702,381,449 50.68 2 Qatari 374 0.06 180,609,694 2.37 1,068,166,816 6.22 3 Saudi Arabian 2,519 0.38 387,821,233 5.09 1,062,841,180 6.19 4 Kuwaiti 3,004 0.46 217,849,972 2.86 1,008,544,495 5.87 5 Caymanian 34 0.01 278,761,838 3.66 674,217,697 3.93 6 Bahraini 132 0.02 346,780,848 4.55 669,050,094 3.90 7 Libyan 101 0.02 139,237,867 1.83 628,570,666 3.66 8 Lebanese 1,186 0.18 215,369,472 2.83 392,365,697 2.29 9 Chinese 7 0.00 21,509,922 0.28 376,175,948 2.19 10 Palestinian 23,850 3.64 148,439,005 1.95 355,672,222 2.07 11 Other 10,865 1.66 669,532,420 8.78 2,232,392,744 13.00 Total 654,592 100 7,622,036,939 100 17,170,379,008 100
- 5. المالية والمؤسسات واالستثمارات للخزينة األهلي مجموعة Ahli Treasury, Investments & Financial Institutions Group 5 INVESTMENT استثمار Disclaimer: The trading and financial related data contained in this report has been obtained from sources considered by Jordan Ahli Bank to be reliable in all material respects. However, the accuracy, fairness and completeness thereof are not guaranteed by Jordan Ahli Bank and its employees and its third-party suppliers shall have no liability for errors or omissions with respect to the service or its delivery, regardless of the cause or source of such error or omission. This is not an invitation to buy or sell stocks traded in Amman Stock Exchange. The Purpose of this report is to provide information and analysis related to Amman Stock Exchange and assists investors to obtain information to support their decisions. The reader should not make any investment decision solely based on the information contained in this report and he/she should consult with his/her investment advisor before investing. This report is a copyright of Jordan Ahli Bank and should not be reproduced or redistributed partially or fully in away shape or manner without the express written consent of the Jordan Ahli Bank. Information Sources • Amman Stock Exchange: www.exchange.jo • Securities Depository Center: www.sdc.com.jo Contact Us: Lina N. Bakhit Head of Ahli Treasury, Investments and Financial Institutions Group E-mail: Lina.bakhit@ahlibank.com.jo Tel.: +962-6-4649529 Majed Hejab Head of Investments E-mail: Majed.Hejab@ahlibank.com.jo Tel.: 500 2130 / Ext: 1810 Research & Studies Department Rabe Al-Bataineh Head of Research & Studies E-mail: Research.dept@ahlibank.com.jo Tel.: 500 2130 / Ext: 1814