Investment patterns report october 2020
•
0 likes•34 views

The document analyzes investment patterns and trends in the Amman Stock Exchange (ASE) for October 2020. It finds that local Jordanian investors were net sellers of ASE shares, while regional investors from surrounding countries were net buyers. International Western investors were also net sellers. Overall, Jordanian investors make up over half of ASE ownership and trading activity. The top sectors by nationality are banking, services and industry. [END SUMMARY]

Recommended
Recommended
More Related Content
What's hot
What's hot (20)
Similar to Investment patterns report october 2020
Similar to Investment patterns report october 2020 (20)
More from ahli bank
More from ahli bank (20)
Recently uploaded
Recently uploaded (20)
Investment patterns report october 2020
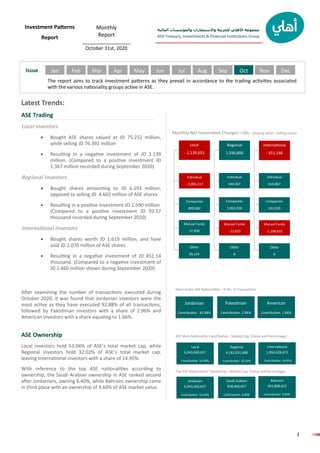
- 1. المالية والمؤسسات واالستثمارات للخزينة األهلي مجموعة Ahli Treasury, Investments & Financial Institutions Group 1 INVESTMENT استثمار Issue Investment Patterns Report Monthly Report __________________ October 31st, 2020 The report aims to track investment patterns as they prevail in accordance to the trading activities associated with the various nationality groups active in ASE. Latest Trends: ASE Trading Local investors • Bought ASE shares valued at JD 75.252 million, while selling JD 76.392 million • Resulting in a negative investment of JD 1.139 million. (Compared to a positive investment JD 1.367 million recorded during September 2020) Regional Investors • Bought shares amounting to JD 6.193 million, opposed to selling JD 4.602 million of ASE shares • Resulting in a positive investment JD 1.590 million. (Compared to a positive investment JD 92.57 thousand recorded during September 2020) International investors • Bought shares worth JD 1.619 million, and have sold JD 2.070 million of ASE shares • Resulting in a negative investment of JD 451.14 thousand. (Compared to a negative investment of JD 1.460 million shown during September 2020) After examining the number of transactions executed during October 2020, it was found that Jordanian investors were the most active as they have executed 92.88% of all transactions, followed by Palestinian investors with a share of 2.96% and American investors with a share equaling to 1.66%. ASE Ownership Local investors hold 53.04% of ASE’s total market cap, while Regional investors hold 32.02% of ASE’s total market cap, leaving International investors with a share of 14.95%. With reference to the top ASE nationalities according to ownership, the Saudi Arabian ownership in ASE ranked second after Jordanians, owning 6.40%, while Bahraini ownership came in third place with an ownership of 4.60% of ASE market value. Jordanian Contribution 92.88% American Contribution 1.66% Palestinian Contribution 2.96% Most Active ASE Nationalities - % No. of Transactions Local 6,943,460,657 Contribution 53.04% Regional 4,192,031,488 Contribution 32.02% Bahraini 602,868,623 Contribution 4.60% ASE Main Nationality Classification - Market Cap. (Value and Percentage): Top ASE Nationalities’ Ownership—Market Cap. (Value and Percentage): Saudi Arabian 838,460,657 Contribution 6.40% Jordanian 6,943,460,657 Contribution 53.04% International 1,956,628,472 Contribution 14.95% Jan Local - 1,139,653 International - 451,146 Regional 1,590,800 Individual - 2,005,317 Individual 614,867 Individual 544,367 Companies 132,618 Companies 1,062,058 Companies 809,082 Mutual Funds 17,458 Mutual Funds -1,198,631 Mutual Funds - 15,625 Other 0 Other 0 Other 39,124 Monthly Net Investment Changes—JDs : (Buying value—Selling value) Feb Mar Apr May Jun Jul Aug Sep Oct Nov Dec
- 2. المالية والمؤسسات واالستثمارات للخزينة األهلي مجموعة Ahli Treasury, Investments & Financial Institutions Group 2 INVESTMENT استثمار ASE Nationality Classification - By Sector Net Investment - JD Million BySector Nationality Sell Buy Net Investment JD (Market Value)Securities Market Value Securities Market Value Banking Sector Local 2,505,540 4,353,288 2,945,541 4,648,987 295,699 Regional 839,215 1,377,665 954,606 2,020,513 642,848 International 749,370 1,729,581 193,978 791,034 -938,547 Total Banking 4,094,125 7,460,535 4,094,125 7,460,535 Insurance Sector Local 2,701,788 1,993,909 2,714,847 2,000,589 6,681 Regional 10,753 4,194 161 79 -4,115 International 2,467 2,566 0 0 -2,566 Total Insurance 2,715,008 2,000,668 2,715,008 2,000,668 Services Sector Local 78,167,472 51,897,906 73,981,639 50,400,726 -1,497,180 Regional 3,355,366 1,748,107 6,569,617 2,654,429 906,322 International 444,457 216,790 1,416,039 807,648 590,858 Total Services 81,967,295 53,862,803 81,967,295 53,862,803 Industry Sector Local 28,509,463 18,146,936 28,413,352 18,202,084 55,148 Regional 1,288,593 1,472,650 1,449,589 1,518,394 45,745 International 77,014 121,486 12,129 20,594 -100,892 Total Industry 29,875,070 19,741,071 29,875,070 19,741,071 All Sectors Local 111,884,263 76,392,039 108,055,379 75,252,386 -1,139,653 Regional 5,493,927 4,602,616 8,973,973 6,193,416 1,590,800 International 1,273,308 2,070,422 1,622,146 1,619,276 -451,146 Grand Total 118,651,498 83,065,077 118,651,498 83,065,077
- 3. المالية والمؤسسات واالستثمارات للخزينة األهلي مجموعة Ahli Treasury, Investments & Financial Institutions Group 3 INVESTMENT استثمار ASE Nationality Classification - By Investor Category Net Investment - JD Million ByInvestorCategory Nationality Investor Category Sell Buy Net Investment JD (Market Value)Securities Market Value Securities Market Value Local Individuals 100,311,628 67,800,032 93,093,561 65,794,714 -2,005,317 Companies 11,420,295 8,356,326 14,624,855 9,165,408 809,082 Mutual Funds 152,240 235,506 292,963 252,964 17,458 Institutions 100 176 44,000 39,300 39,124 Total 111,884,263 76,392,039 108,055,379 75,252,386 -1,139,653 Regional Individuals 4,592,376 3,332,080 7,947,700 3,876,447 544,367 Companies 894,051 1,254,911 1,026,273 2,316,969 1,062,058 Mutual Funds 7,500 15,625 0 0 -15,625 Total 5,493,927 4,602,616 8,973,973 6,193,416 1,590,800 International Individuals 71,052 186,613 206,496 801,480 614,867 Companies 250,689 635,399 1,373,759 768,017 132,618 Mutual Funds 951,567 1,248,410 41,891 49,779 -1,198,631 Total 1,273,308 2,070,422 1,622,146 1,619,276 -451,146 All Nationalities Individuals 104,975,056 71,318,725 101,247,757 70,472,641 -846,083 Companies 12,565,035 10,246,636 17,024,887 12,250,394 2,003,757 Mutual Funds 1,111,307 1,499,540 334,854 302,743 -1,196,798 Institutions 100 176 44,000 39,300 39,124 Grand Total 118,651,498 83,065,077 118,651,498 83,065,077
- 4. المالية والمؤسسات واالستثمارات للخزينة األهلي مجموعة Ahli Treasury, Investments & Financial Institutions Group 4 INVESTMENT استثمار ASE Ownership Classification OwnershipSectorTop10Nationalities Serial Nationality Shareholders Securities Total Value No. % No. % Amount in JOD % 1 Jordanian 589,779 93.59 4,899,233,263 65.48 6,943,460,657 53.04 2 Saudi Arabian 2,473 0.39 402,643,575 5.38 838,217,973 6.40 3 Bahraini 126 0.02 350,797,623 4.69 602,868,623 4.60 4 Kuwaiti 2,577 0.41 251,597,344 3.36 585,760,998 4.47 5 Caymanian 33 0.01 276,030,335 3.69 582,877,505 4.45 6 Qatari 387 0.06 189,618,215 2.53 443,693,245 3.39 7 Chinese 6 0.00 23,294,922 0.31 440,268,315 3.36 8 Libyan 99 0.02 139,715,231 1.87 320,132,658 2.45 9 Joint Arab 2 0.00 16,833,395 0.23 315,195,566 2.41 10 Palestinian 23,101 3.67 135,680,068 1.81 293,858,827 2.24 11 Other 11,620 1.84 796,691,393 10.65 1,725,786,251 13.18 Total 630,203 100 7,482,135,364 100 13,092,120,618 100 Sector No. of Regis- ters Nationality Shareholders No. % Securities No. % Total Value Amount in JD % Banking 16 Local 72,032 87.47 1,461,200,544 48.12 2,647,043,906 42.47 Regional 8,966 10.89 1,291,849,625 42.55 2,969,926,092 47.66 International 1,353 1.64 283,404,831 9.33 615,183,603 9.87 Total 82,351 100 3,036,455,000 100 6,232,153,600 100 Insurance 24 Local 14,134 94.83 181,035,095 67.32 206,945,677 69.14 Regional 671 4.50 68,420,929 25.44 56,898,103 19.01 International 99 0.66 19,466,828 7.24 35,460,044 11.85 Total 14,904 100 268,922,852 100 299,303,824 100 Services 144 Local 355,204 95.78 2,577,549,567 82.01 2,763,166,626 73.12 Regional 14,432 3.89 369,036,394 11.74 354,399,699 9.38 International 1,221 0.33 196,465,403 6.25 661,404,229 17.50 Total 370,857 100 3,143,051,364 100 3,778,970,554 100 Industry 56 Local 148,409 91.56 679,448,057 65.73 1,326,304,448 47.68 Regional 12,136 7.49 202,400,470 19.58 810,807,594 29.15 International 1,546 0.95 151,857,621 14.69 644,580,597 23.17 Total 162,091 100 1,033,706,148 100 2,781,692,640 100 All Sectors Local 589,779 93.59 4,899,233,263 65.48 6,943,460,657 53.04 240 Regional 36,205 5.75 1,931,707,418 25.82 4,192,031,488 32.02 International 4,219 0.67 651,194,683 8.70 1,956,628,472 14.95 Grand Total 630,203 100 7,482,135,364 100 13,092,120,618 100
- 5. المالية والمؤسسات واالستثمارات للخزينة األهلي مجموعة Ahli Treasury, Investments & Financial Institutions Group 5 INVESTMENT استثمار Disclaimer: The trading and financial related data contained in this report has been obtained from sources considered by Jordan Ahli Bank to be reliable in all material respects. However, the accuracy, fairness and completeness thereof are not guaranteed by Jordan Ahli Bank and its employees and its third-party suppliers shall have no liability for errors or omissions with respect to the service or its delivery, re- gardless of the cause or source of such error or omission. This is not an invitation to buy or sell stocks traded in Amman Stock Exchange. The Purpose of this report is to provide information and analysis related to Amman Stock Exchange and assists investors to obtain infor- mation to support their decisions. The reader should not make any investment decision solely based on the information contained in this report and he/she should consult with his/her investment advisor before investing. This report is a copyright of Jordan Ahli Bank and should not be reproduced or redistributed partially or fully in away shape or manner without the express written consent of the Jordan Ahli Bank. Information Sources • Amman Stock Exchange: www.exchange.jo • Securities Depository Center: www.sdc.com.jo Contact Us: Lina N. Bakhit Chief Business Officer—CBO E-mail: Lina.bakhit@ahlibank.com.jo Tel.: 520 6000 / Ext: 1800 Majed Hejab Senior Vice President—SVP Head of Treasury, Investments and Financial Institutions E-mail: Majed.Hejab@ahlibank.com.jo Tel.: 520 6000 / Ext: 1810 Research & Studies Department Rabe Al-Bataineh Head of Research and Studies E-mail: Research.dept@ahlibank.com.jo Tel.: 520 6000 / Ext: 1814