Investment patterns report november 2020
•
0 likes•57 views

Investment patterns report november 2020

Recommended
Recommended
More Related Content
What's hot
What's hot (20)
Similar to Investment patterns report november 2020
Similar to Investment patterns report november 2020 (20)
More from ahli bank
More from ahli bank (20)
Recently uploaded
Recently uploaded (20)
Investment patterns report november 2020
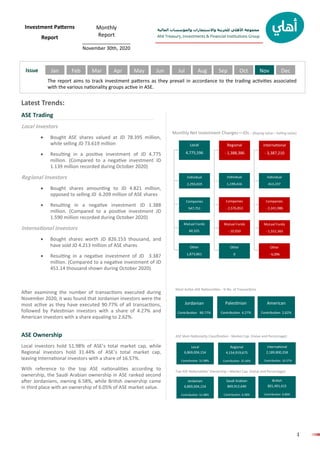
- 1. المالية والمؤسسات واالستثمارات للخزينة األهلي مجموعة Ahli Treasury, Investments & Financial Institutions Group 1 INVESTMENT استثمار Issue Investment Patterns Report Monthly Report __________________ November 30th, 2020 The report aims to track investment patterns as they prevail in accordance to the trading activities associated with the various nationality groups active in ASE. Latest Trends: ASE Trading Local investors • Bought ASE shares valued at JD 78.395 million, while selling JD 73.619 million • Resulting in a positive investment of JD 4.775 million. (Compared to a negative investment JD 1.139 million recorded during October 2020) Regional Investors • Bought shares amounting to JD 4.821 million, opposed to selling JD 6.209 million of ASE shares • Resulting in a negative investment JD 1.388 million. (Compared to a positive investment JD 1.590 million recorded during October 2020) International investors • Bought shares worth JD 826.153 thousand, and have sold JD 4.213 million of ASE shares • Resulting in a negative investment of JD 3.387 million. (Compared to a negative investment of JD 451.14 thousand shown during October 2020) After examining the number of transactions executed during November 2020, it was found that Jordanian investors were the most active as they have executed 90.77% of all transactions, followed by Palestinian investors with a share of 4.27% and American investors with a share equaling to 2.62%. ASE Ownership Local investors hold 51.98% of ASE’s total market cap, while Regional investors hold 31.44% of ASE’s total market cap, leaving International investors with a share of 16.57%. With reference to the top ASE nationalities according to ownership, the Saudi Arabian ownership in ASE ranked second after Jordanians, owning 6.58%, while British ownership came in third place with an ownership of 6.05% of ASE market value. Jordanian Contribution 90.77% American Contribution 2.62% Palestinian Contribution 4.27% Most Active ASE Nationalities - % No. of Transactions Local 6,869,004,154 Contribution 51.98% Regional 4,154,919,675 Contribution 31.44% British 801,491,415 Contribution 6.06% ASE Main Nationality Classification - Market Cap. (Value and Percentage): Top ASE Nationalities’ Ownership—Market Cap. (Value and Percentage): Saudi Arabian 869,912,640 Contribution 6.58% Jordanian 6,869,004,154 Contribution 51.98% International 2,189,800,358 Contribution 16.57% Jan Local 4,775,596 International - 3,387,210 Regional - 1,388,386 Individual 2,293,659 Individual 413,237 Individual 1,199,416 Companies - 2,241,986 Companies - 2,576,853 Companies 547,751 Mutual Funds 60,325 Mutual Funds - 1,552,365 Mutual Funds - 10,950 Other - 6,096 Other 0 Other 1,873,861 Monthly Net Investment Changes—JDs : (Buying value—Selling value) Feb Mar Apr May Jun Jul Aug Sep Oct Nov Dec
- 2. المالية والمؤسسات واالستثمارات للخزينة األهلي مجموعة Ahli Treasury, Investments & Financial Institutions Group 2 INVESTMENT استثمار ASE Nationality Classification - By Sector Net Investment - JD Million By Sector Nationality Sell Buy Net Investment JD (Market Value) Securities Market Value Securities Market Value Banking Sector Local 2,500,347 4,254,385 3,400,451 6,958,928 2,704,543 Regional 351,384 781,876 238,995 759,037 -22,839 International 1,044,340 3,490,432 256,625 808,728 -2,681,704 Total Banking 3,896,071 8,526,693 3,896,071 8,526,693 Insurance Sector Local 7,059,589 4,749,675 7,058,299 4,750,333 659 Regional 62,270 39,476 63,560 38,818 -659 Total Insurance 7,121,859 4,789,151 7,121,859 4,789,151 Services Sector Local 57,029,350 38,603,407 63,420,911 40,213,438 1,610,031 Regional 13,024,614 3,957,882 6,727,509 2,414,949 -1,542,933 International 102,456 77,618 8,000 10,520 -67,098 Total Services 70,156,420 42,638,908 70,156,420 42,638,908 Industry Sector Local 34,184,089 26,011,938 34,531,679 26,472,302 460,364 Regional 2,428,979 1,430,445 2,345,320 1,608,489 178,044 International 266,413 645,313 2,482 6,905 -638,407 Total Industry 36,879,481 28,087,696 36,879,481 28,087,696 All Sectors Local 100,773,375 73,619,405 108,411,340 78,395,001 4,775,596 Regional 15,867,247 6,209,680 9,375,384 4,821,293 -1,388,386 International 1,413,209 4,213,363 267,107 826,153 -3,387,210 Grand Total 118,053,831 84,042,447.34 118,053,831 84,042,447.34
- 3. المالية والمؤسسات واالستثمارات للخزينة األهلي مجموعة Ahli Treasury, Investments & Financial Institutions Group 3 INVESTMENT استثمار ASE Nationality Classification - By Investor Category Net Investment - JD Million By Investor Category Nationality Investor Category Sell Buy Net Investment JD (Market Value) Securities Market Value Securities Market Value Local Individuals 84,034,474 62,783,778 86,526,531 65,077,437 2,293,659 Companies 16,524,676 10,654,839 20,645,851 11,202,591 547,751 Mutual Funds 183,372 97,744 199,599 158,069 60,325 Institutions 30,853 83,044 1,039,359 1,956,905 1,873,861 Total 100,773,375 73,619,405 108,411,340 78,395,001 4,775,596 Regional Individuals 7,110,776 3,371,489 9,108,485 4,570,906 1,199,416 Companies 8,751,471 2,827,241 266,899 250,388 -2,576,853 Mutual Funds 5,000 10,950 0 0 -10,950 Total 15,867,247 6,209,680 9,375,384 4,821,293 -1,388,386 International Individuals 27,055 95,865 135,591 509,102 413,237 Companies 606,504 2,287,485 47,894 45,499 -2,241,986 Mutual Funds 778,156 1,823,917 83,622 271,552 -1,552,365 Associations 1,494 6,096 0 0 -6,096 Total 1,413,209 4,213,363 267,107 826,153 -3,387,210 All Nationalities Individuals 91,172,305 66,251,132 95,770,607 70,157,444 3,906,313 Companies 25,882,651 15,769,565 20,960,644 11,498,478 -4,271,087 Mutual Funds 966,528 1,932,611 283,221 429,621 -1,502,991 Institutions 30,853 83,044 1,039,359 1,956,905 1,873,861 Associations 1,494 6,096 0 0 -6,096 Grand Total 118,053,831 84,042,447 118,053,831 84,042,447
- 4. المالية والمؤسسات واالستثمارات للخزينة األهلي مجموعة Ahli Treasury, Investments & Financial Institutions Group 4 INVESTMENT استثمار ASE Ownership Classification Ownership Sector Top 10 Nationalities Serial Nationality Shareholders Securities Total Value No. % No. % Amount in JOD % 1 Jordanian 587,177 93.60 4,896,199,471 65.44 6,869,004,154.23 51.98 2 Saudi Arabian 2,463 0.39 402,556,549 5.38 869,912,640.30 6.58 3 British 259 0.04 67,130,798 0.90 801,491,415.17 6.07 4 Bahraini 124 0.02 350,787,387 4.69 600,245,534.52 4.54 5 Kuwaiti 2,590 0.41 251,541,702 3.36 579,537,152.35 4.39 6 Qatari 385 0.06 190,137,357 2.54 449,101,529.04 3.40 7 Chinese 6 0.00 23,294,922 0.31 439,336,528.61 3.32 8 Libyan 99 0.02 139,715,231 1.87 325,375,318.24 2.46 9 Joint Arab 2 0.00 16,833,395 0.23 314,563,629.70 2.38 10 Caymanian 26 0.00 253,587,831 3.39 298,611,512.34 2.26 11 Other 34,180 5.45 890,350,721 11.90 1,666,544,775 12.61 Total 627,311 100 7,482,135,364 100 13,213,724,189 100 Sector No. of Regis- ters Nationality Shareholders No. % Securities No. % Total Value Amount in JD % Banking 16 Local 72,045 87.47 1,462,088,233 48.15 2,663,972,628 42.59 Regional 8,968 10.89 1,291,742,461 42.54 2,969,929,380 47.49 International 1,352 1.64 282,624,306 9.31 620,414,692 9.92 Total 82,365 100 3,036,455,000 100 6,254,316,700 100 Insurance 23 Local 13,775 95.08 181,069,149 67.33 206,976,110 68.77 Regional 623 4.30 68,393,860 25.43 58,692,351 19.50 International 90 0.62 19,459,843 7.24 35,300,383 11.73 Total 14,488 100 268,922,852 100 300,968,844 100 Services 144 Local 353,335 95.79 2,573,209,323 81.87 2,652,294,259 69.55 Regional 14,350 3.89 356,528,938 11.34 276,539,606 7.25 International 1,177 0.32 213,313,103 6.79 884,545,367 23.20 Total 368,862 100 3,143,051,364 100 3,813,379,232 100 Industry 56 Local 148,022 91.60 679,832,766 65.77 1,345,761,157 47.30 Regional 12,038 7.45 202,281,718 19.57 849,758,338 29.87 International 1,536 0.95 151,591,664 14.67 649,539,918 22.83 Total 161,596 100 1,033,706,148 100 2,845,059,413 100 All Sectors Local 587,177 93.60 4,896,199,471 65.44 6,869,004,154 51.98 239 Regional 35,979 5.74 1,918,946,977 25.65 4,154,919,676 31.44 International 4,155 0.66 666,988,916 8.91 2,189,800,359 16.57 Grand Total 627,311 100 7,482,135,364 100 13,213,724,189 100
- 5. المالية والمؤسسات واالستثمارات للخزينة األهلي مجموعة Ahli Treasury, Investments & Financial Institutions Group 5 INVESTMENT استثمار Disclaimer: The trading and financial related data contained in this report has been obtained from sources considered by Jordan Ahli Bank to be reliable in all material respects. However, the accuracy, fairness and completeness thereof are not guaranteed by Jordan Ahli Bank and its employees and its third-party suppliers shall have no liability for errors or omissions with respect to the service or its delivery, re- gardless of the cause or source of such error or omission. This is not an invitation to buy or sell stocks traded in Amman Stock Exchange. The Purpose of this report is to provide information and analysis related to Amman Stock Exchange and assists investors to obtain infor- mation to support their decisions. The reader should not make any investment decision solely based on the information contained in this report and he/she should consult with his/her investment advisor before investing. This report is a copyright of Jordan Ahli Bank and should not be reproduced or redistributed partially or fully in away shape or manner without the express written consent of the Jordan Ahli Bank. Information Sources • Amman Stock Exchange: www.exchange.jo • Securities Depository Center: www.sdc.com.jo Contact Us: Lina N. Bakhit Chief Business Officer—CBO E-mail: Lina.bakhit@ahlibank.com.jo Tel.: 520 6000 / Ext: 1800 Majed Hejab Senior Vice President—SVP Head of Treasury, Investments and Financial Institutions E-mail: Majed.Hejab@ahlibank.com.jo Tel.: 520 6000 / Ext: 1810 Research & Studies Department Rabe Al-Bataineh Head of Research and Studies E-mail: Research.dept@ahlibank.com.jo Tel.: 520 6000 / Ext: 1814