Investment patterns report march 2020
•
0 likes•67 views

Investment patterns report march 2020

Recommended
Recommended
More Related Content
What's hot
What's hot (20)
Similar to Investment patterns report march 2020
Similar to Investment patterns report march 2020 (20)
More from ahli bank
More from ahli bank (20)
Recently uploaded
Recently uploaded (20)
Investment patterns report march 2020
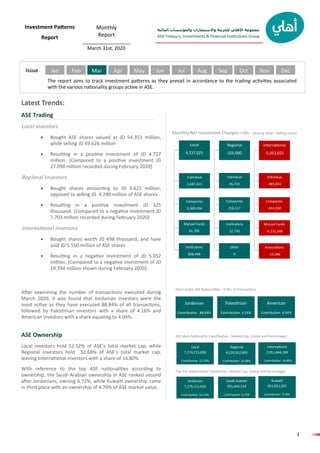
- 1. المالية والمؤسسات واالستثمارات للخزينة األهلي مجموعة Ahli Treasury, Investments & Financial Institutions Group 1 INVESTMENT استثمار Issue Investment Patterns Report Monthly Report __________________ March 31st, 2020 The report aims to track investment patterns as they prevail in accordance to the trading activities associated with the various nationality groups active in ASE. Latest Trends: ASE Trading Local investors • Bought ASE shares valued at JD 54.353 million, while selling JD 49.626 million • Resulting in a positive investment of JD 4.727 million. (Compared to a positive investment JD 27.098 million recorded during February 2020) Regional Investors • Bought shares amounting to JD 4.615 million, opposed to selling JD 4.290 million of ASE shares • Resulting in a positive investment JD 325 thousand. (Compared to a negative investment JD 7.703 million recorded during February 2020) International investors • Bought shares worth JD 498 thousand, and have sold JD 5.550 million of ASE shares • Resulting in a negative investment of JD 5.052 million. (Compared to a negative investment of JD 19.394 million shown during February 2020) After examining the number of transactions executed during March 2020, it was found that Jordanian investors were the most active as they have executed 88.84% of all transactions, followed by Palestinian investors with a share of 4.16% and American investors with a share equaling to 4.04%. ASE Ownership Local investors hold 52.52% of ASE’s total market cap, while Regional investors hold 32.68% of ASE’s total market cap, leaving International investors with a share of 14.80%. With reference to the top ASE nationalities according to ownership, the Saudi Arabian ownership in ASE ranked second after Jordanians, owning 6.72%, while Kuwaiti ownership came in third place with an ownership of 4.70% of ASE market value. Jordanian Contribution 88.84% American Contribution 4.04% Palestinian Contribution 4.16% Most Active ASE Nationalities - % No. of Transactions Local 7,279,215,830 Contribution 52.52% Regional 4,529,352,892 Contribution 32.68% Kuwaiti 651,631,392 Contribution 4.70% ASE Main Nationality Classification - Market Cap. (Value and Percentage): Top ASE Nationalities’ Ownership—Market Cap. (Value and Percentage): Saudi Arabian 931,645,514 Contribution 6.72% Jordanian 7,279,215,830 Contribution 52.52% International 2,051,844,289 Contribution 14.80% Jan Local 4,727,025 International -5,052,025 Regional 325,000 Individual 1,687,415 Individual -493,041 Individual 45,733 Companies -414,350 Companies 256,517 Companies 2,369,456 Mutual Funds 61,705 Mutual Funds -4,131,248 Institutions 22,750 Associations -13,386 Other 0 Institutions 608,448 Monthly Net Investment Changes—JDs : (Buying value—Selling value) Feb Mar Apr May Jun Jul Aug Sep Oct Nov Dec
- 2. المالية والمؤسسات واالستثمارات للخزينة األهلي مجموعة Ahli Treasury, Investments & Financial Institutions Group 2 INVESTMENT استثمار ASE Nationality Classification - By Sector Net Investment - JD Million BySector Nationality Sell Buy Net Investment JD (Market Value)Securities Market Value Securities Market Value Banking Sector Local 5,168,136 8,360,318 6,688,039 11,623,866 3,263,549 Regional 927,047 1,903,213 589,893 1,632,645 (270,568) International 1,366,280 3,290,458 183,531 297,478 (2,992,980) Total Banking 7,461,463 13,553,990 7,461,463 13,553,990 Insurance Sector Local 663,308 1,020,109 664,058 1,020,680 572 Regional 1,150 980 400 408 (572) Total Insurance 664,458 1,021,088 664,458 1,021,088 Services Sector Local 31,184,660 24,496,145 30,040,972 25,364,987 868,843 Regional 1,872,494 1,175,992 3,751,415 1,691,882 515,890 International 905,178 1,470,976 169,945 86,243 (1,384,733) Total Services 33,962,332 27,143,113 33,962,332 27,143,113 Industry Sector Local 15,347,300 15,750,164 15,332,849 16,344,226 594,062 Regional 1,421,007 1,209,885 1,547,977 1,290,135 80,250 International 169,809 789,386 57,290 115,074 (674,312) Total Industry 16,938,116 17,749,435 16,938,116 17,749,435 All Sectors Local 52,363,404 49,626,735 52,725,918 54,353,760 4,727,025 Regional 4,221,698 4,290,070 5,889,685 4,615,070 325,000 International 2,441,267 5,550,821 410,766 498,796 (5,052,025) Grand Total 59,026,369 59,467,626 59,026,369 59,467,626
- 3. المالية والمؤسسات واالستثمارات للخزينة األهلي مجموعة Ahli Treasury, Investments & Financial Institutions Group 3 INVESTMENT استثمار ASE Nationality Classification - By Investor Category Net Investment - JD Million ByInvestorCategory Nationality Investor Category Sell Buy Net Investment JD (Market Value)Securities Market Value Securities Market Value Local Individuals 47,778,859 42,173,281 46,909,162 43,860,696 1,687,415 Companies 4,492,559 7,382,697 5,469,021 9,752,153 2,369,456 Mutual Funds 76,986 61,157 67,231 122,862 61,705 Institutions 15,000 9,600 280,504 618,048 608,448 Total 52,363,404 49,626,735 52,725,918 54,353,760 4,727,025 Regional Individuals 3,722,979 3,418,815 4,334,031 3,464,547 45,733 Companies 498,719 871,256 1,530,654 1,127,773 256,517 Institutions - - 25,000 22,750 22,750 Total 4,221,698 4,290,070 5,889,685 4,615,070 325,000 International Individuals 51,503 600,480 181,960 107,438 (493,041) Companies 757,126 506,800 82,500 92,450 (414,350) Mutual Funds 1,630,136 4,430,155 146,306 298,907 (4,131,248) Associations 2,502 13,386 - - (13,386) Total 2,441,267 5,550,821 410,766 498,796 (5,052,025) All Nationalities Individuals 51,553,341 46,192,575 51,425,153 47,432,682 1,240,107 Companies 5,748,404 8,760,753 7,082,175 10,972,376 2,211,622 Mutual Funds 1,707,122 4,491,312 213,537 421,770 (4,069,542) Institutions 15,000 9,600 305,504 640,798 631,198 Associations 2,502 13,386 - - (13,386) Grand Total 59,026,369 59,467,626 59,026,369 59,467,626 -
- 4. المالية والمؤسسات واالستثمارات للخزينة األهلي مجموعة Ahli Treasury, Investments & Financial Institutions Group 4 INVESTMENT استثمار ASE Ownership Classification OwnershipSectorTop10Nationalities Serial Nationality Shareholders Securities Total Value No. % No. % Amount in JOD % 1 Jordanian 589,044 93.52 4,876,406,356 65.51 7,279,215,830 52.52 2 Saudi Arabian 2,486 0.39 404,027,008 5.43 931,645,514 6.72 3 Kuwaiti 2,894 0.46 222,627,864 2.99 651,631,393 4.70 4 Caymanian 32 0.01 280,749,004 3.77 630,161,009 4.55 5 Bahraini 126 0.02 350,527,280 4.71 591,548,902 4.27 6 Qatari 387 0.06 185,306,481 2.49 545,338,184 3.93 7 Chinese 6 0.00 23,294,922 0.31 404,161,665 2.92 8 Libyan 97 0.02 139,668,741 1.88 361,879,997 2.61 9 Palestinian 23,088 3.67 133,944,800 1.80 317,507,326 2.29 10 Joint Arab 2 0.00 17,113,365 0.23 290,141,525 2.09 11 Other 11,675 1.85 809,744,543 10.88 1,857,181,666 13.40 Total 629,837 100 7,443,410,364 100 13,860,413,012 100 Sector No. of Regis- ters Nationality Shareholders No. % Securities No. % Total Value Amount in JD % Banking 16 Local 71,924 87.03 1,436,688,842 48.11 2,924,704,630 41.87 Regional 9,345 11.31 1,263,106,000 42.29 3,338,248,867 47.79 International 1,377 1.67 286,660,158 9.60 722,014,703 10.34 Total 82,646 100 2,986,455,000 100 6,984,968,200 100 Insurance 23 Local 13,701 95.15 179,442,689 67.13 208,380,282 68.54 Regional 609 4.23 68,421,044 25.60 61,472,932 20.22 International 90 0.63 19,459,119 7.28 34,172,191 11.24 Total 14,400 100 267,322,852 100 304,025,405 100 Services 144 Local 355,553 95.77 2,586,095,499 81.89 2,872,754,745 73.07 Regional 14,476 3.90 368,903,879 11.68 365,264,325 9.29 International 1,237 0.33 202,926,986 6.43 693,759,203 17.65 Total 371,266 100 3,157,926,364 100 3,931,778,273 100 Industry 56 Local 147,866 91.54 674,179,326 65.35 1,273,376,172 48.24 Regional 12,104 7.49 205,166,977 19.89 764,366,769 28.96 International 1,555 0.96 152,359,845 14.77 601,898,193 22.80 Total 161,525 100 1,031,706,148 100 2,639,641,133 100 All Sectors Local 589,044 93.52 4,876,406,356 65.51 7,279,215,830 52.52 239 Regional 36,534 5.80 1,905,597,900 25.60 4,529,352,892 32.68 International 4,259 0.68 661,406,108 8.89 2,051,844,289 14.80 Grand Total 629,837 100 7,443,410,364 100 13,860,413,012 100
- 5. المالية والمؤسسات واالستثمارات للخزينة األهلي مجموعة Ahli Treasury, Investments & Financial Institutions Group 5 INVESTMENT استثمار Disclaimer: The trading and financial related data contained in this report has been obtained from sources considered by Jordan Ahli Bank to be reliable in all material respects. However, the accuracy, fairness and completeness thereof are not guaranteed by Jordan Ahli Bank and its employees and its third-party suppliers shall have no liability for errors or omissions with respect to the service or its delivery, re- gardless of the cause or source of such error or omission. This is not an invitation to buy or sell stocks traded in Amman Stock Exchange. The Purpose of this report is to provide information and analysis related to Amman Stock Exchange and assists investors to obtain infor- mation to support their decisions. The reader should not make any investment decision solely based on the information contained in this report and he/she should consult with his/her investment advisor before investing. This report is a copyright of Jordan Ahli Bank and should not be reproduced or redistributed partially or fully in away shape or manner without the express written consent of the Jordan Ahli Bank. Information Sources • Amman Stock Exchange: www.exchange.jo • Securities Depository Center: www.sdc.com.jo Contact Us: Lina N. Bakhit Chief Business Officer—CBO E-mail: Lina.bakhit@ahlibank.com.jo Tel.: 520 6000 / Ext: 1800 Majed Hejab Senior Vice President—SVP Head of Treasury, Investments and Financial Institutions E-mail: Majed.Hejab@ahlibank.com.jo Tel.: 520 6000 / Ext: 1810 Research & Studies Department Rabe Al-Bataineh Head of Research and Studies E-mail: Research.dept@ahlibank.com.jo Tel.: 520 6000 / Ext: 1814