Investment patterns report august 2020
•
0 likes•80 views

Investment patterns report august 2020

Recommended
Recommended
More Related Content
What's hot
What's hot (20)
Similar to Investment patterns report august 2020
Similar to Investment patterns report august 2020 (20)
More from ahli bank
More from ahli bank (20)
Recently uploaded
Recently uploaded (20)
Investment patterns report august 2020
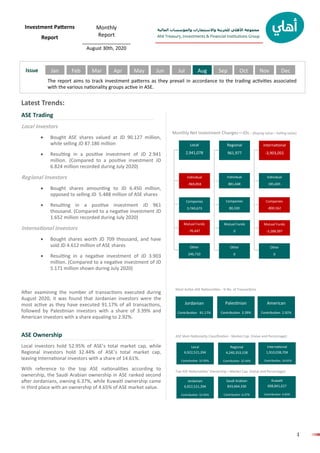
- 1. المالية والمؤسسات واالستثمارات للخزينة األهلي مجموعة Ahli Treasury, Investments & Financial Institutions Group 1 INVESTMENT استثمار Issue Investment Patterns Report Monthly Report __________________ August 30th, 2020 The report aims to track investment patterns as they prevail in accordance to the trading activities associated with the various nationality groups active in ASE. Latest Trends: ASE Trading Local investors • Bought ASE shares valued at JD 90.127 million, while selling JD 87.186 million • Resulting in a positive investment of JD 2.941 million. (Compared to a positive investment JD 6.824 million recorded during July 2020) Regional Investors • Bought shares amounting to JD 6.450 million, opposed to selling JD 5.488 million of ASE shares • Resulting in a positive investment JD 961 thousand. (Compared to a negative investment JD 1.652 million recorded during July 2020) International investors • Bought shares worth JD 709 thousand, and have sold JD 4.612 million of ASE shares • Resulting in a negative investment of JD 3.903 million. (Compared to a negative investment of JD 5.171 million shown during July 2020) After examining the number of transactions executed during August 2020, it was found that Jordanian investors were the most active as they have executed 91.17% of all transactions, followed by Palestinian investors with a share of 3.39% and American investors with a share equaling to 2.92%. ASE Ownership Local investors hold 52.95% of ASE’s total market cap, while Regional investors hold 32.44% of ASE’s total market cap, leaving International investors with a share of 14.61%. With reference to the top ASE nationalities according to ownership, the Saudi Arabian ownership in ASE ranked second after Jordanians, owning 6.37%, while Kuwaiti ownership came in third place with an ownership of 4.65% of ASE market value. Jordanian Contribution 91.17% American Contribution 2.92% Palestinian Contribution 3.39% Most Active ASE Nationalities - % No. of Transactions Local 6,922,521,394 Contribution 52.95% Regional 4,240,353,158 Contribution 32.44% Kuwaiti 608,841,627 Contribution 4.65% ASE Main Nationality Classification - Market Cap. (Value and Percentage): Top ASE Nationalities’ Ownership—Market Cap. (Value and Percentage): Saudi Arabian 833,664,330 Contribution 6.37% Jordanian 6,922,521,394 Contribution 52.95% International 1,910,038,704 Contribution 14.61% Jan Local 2,941,078 International -3,903,055 Regional 961,977 Individual -969,858 Individual 185,605 Individual 881,648 Companies -800,562 Companies 80,330 Companies 3,740,673 Mutual Funds -76,447 Mutual Funds -3,288,097 Mutual Funds 0 Other 0 Other 0 Other 246,710 Monthly Net Investment Changes—JDs : (Buying value—Selling value) Feb Mar Apr May Jun Jul Aug Sep Oct Nov Dec
- 2. المالية والمؤسسات واالستثمارات للخزينة األهلي مجموعة Ahli Treasury, Investments & Financial Institutions Group 2 INVESTMENT استثمار ASE Nationality Classification - By Sector Net Investment - JD Million BySector Nationality Sell Buy Net Investment JD (Market Value)Securities Market Value Securities Market Value Banking Sector Local 3,514,317 5,915,596 4,437,178 8,903,124 2,987,528 Regional 674,144 1,079,991 705,802 1,342,194 262,203 International 1,108,509 3,853,160 153,990 603,430 -3,249,730 Total Banking 5,296,970 10,848,747 5,296,970 10,848,747 Insurance Sector Local 6,910,457 7,122,010 6,925,555 7,136,561 14,551 Regional 44,842 46,741 31,594 33,212 -13,529 International 2,100 1,239 250 218 -1,022 Total Insurance 6,957,399 7,169,990 6,957,399 7,169,990 Services Sector Local 82,499,172 50,864,243 80,616,603 49,868,367 -995,875 Regional 6,916,769 2,732,259 9,199,805 4,084,191 1,351,932 International 532,892 408,848 132,425 52,792 -356,056 Total Services 89,948,833 54,005,350 89,948,833 54,005,350 Industry Sector Local 32,109,361 23,284,798 33,044,224 24,219,672 934,874 Regional 2,651,859 1,629,619 1,864,495 990,992 -638,627 International 150,822 349,514 3,323 53,268 -296,247 Total Industry 34,912,042 25,263,932 34,912,042 25,263,932 All Sectors Local 125,033,307 87,186,646 125,023,560 90,127,724 2,941,078 Regional 10,287,614 5,488,611 11,801,696 6,450,588 961,977 International 1,794,323 4,612,762 289,988 709,707 -3,903,055 Grand Total 137,115,244 97,288,019 137,115,244 97,288,019
- 3. المالية والمؤسسات واالستثمارات للخزينة األهلي مجموعة Ahli Treasury, Investments & Financial Institutions Group 3 INVESTMENT استثمار ASE Nationality Classification - By Investor Category Net Investment - JD Million ByInvestorCategory Nationality Investor Category Sell Buy Net Investment JD (Market Value)Securities Market Value Securities Market Value Local Individuals 109,042,806 74,823,124 110,043,894 73,853,265 -969,858 Companies 14,752,047 11,982,810 14,713,240 15,723,483 3,740,673 Mutual Funds 1,148,454 344,412 129,247 267,965 -76,447 Institutions 90,000 36,301 137,179 283,011 246,710 Total 125,033,307 87,186,646 125,023,560 90,127,724 2,941,078 Regional Individuals 8,236,172 4,818,074 10,143,510 5,699,722 881,648 Companies 2,051,442 670,537 1,658,186 750,867 80,330 Total 10,287,614 5,488,611 11,801,696 6,450,588 961,977 International Individuals 22,731 16,493 139,880 202,098 185,605 Companies 487,908 1,269,337 133,051 468,774 -800,562 Mutual Funds 1,283,684 3,326,932 17,057 38,835 -3,288,097 Total 1,794,323 4,612,762 289,988 709,707 -3,903,055 All Nationalities Individuals 117,301,709 79,657,691 120,327,284 79,755,085 97,394 Companies 17,291,397 13,922,684 16,504,477 16,943,124 3,020,440 Mutual Funds 2,432,138 3,671,344 146,304 306,800 -3,364,544 Institutions 90,000 36,301 137,179 283,011 246,710 Grand Total 137,115,244 97,288,019 137,115,244 97,288,019
- 4. المالية والمؤسسات واالستثمارات للخزينة األهلي مجموعة Ahli Treasury, Investments & Financial Institutions Group 4 INVESTMENT استثمار ASE Ownership Classification OwnershipSectorTop10Nationalities Serial Nationality Shareholders Securities Total Value No. % No. % Amount in JOD % 1 Jordanian 589,881 93.59 4,897,733,050 65.47 6,922,521,394 52.95 2 Saudi Arabian 2,480 0.39 403,350,836 5.39 833,664,331 6.38 3 Kuwaiti 2,576 0.41 251,719,520 3.36 608,841,628 4.66 4 Bahraini 126 0.02 350,617,737 4.69 603,361,695 4.62 5 Caymanian 33 0.01 276,205,335 3.69 583,947,241 4.47 6 Qatari 386 0.06 186,413,343 2.49 491,721,422 3.76 7 Chinese 6 0.00 23,294,922 0.31 405,326,382 3.10 8 Libyan 98 0.02 139,702,031 1.87 340,224,427 2.60 9 Joint Arab 2 0.00 17,034,221 0.23 290,732,563 2.22 10 Palestinian 23,079 3.66 135,691,210 1.81 285,607,124 2.18 11 Other 11,593 1.84 799,088,159 10.68 1,706,965,050 13.06 Total 630,260 100 7,480,850,364 100 13,072,913,257 100 Sector No. of Regis- ters Nationality Shareholders No. % Securities No. % Total Value Amount in JD % Banking 16 Local 72,019 87.46 1,460,520,193 48.10 2,691,884,472 42.04 Regional 8,970 10.89 1,291,435,449 42.53 3,082,353,541 48.13 International 1,357 1.65 284,499,358 9.37 629,699,787 9.83 Total 82,346 100 3,036,455,000 100 6,403,937,800 100 Insurance 23 Local 13,778 95.15 179,476,324 67.14 209,180,747 69.67 Regional 611 4.22 68,392,259 25.58 56,599,555 18.85 International 91 0.63 19,454,269 7.28 34,474,840 11.48 Total 14,480 100 267,322,852 100 300,255,142 100 Services 144 Local 355,565 95.79 2,579,219,988 82.05 2,767,352,224 73.33 Regional 14,420 3.89 367,939,584 11.71 349,599,134 9.26 International 1,226 0.33 196,206,792 6.24 657,041,060 17.41 Total 371,211 100 3,143,366,364 100 3,773,992,417 100 Industry 56 Local 148,519 91.55 678,516,545 65.64 1,254,103,952 48.33 Regional 12,157 7.49 203,107,959 19.65 751,800,928 28.97 International 1,547 0.95 152,081,644 14.71 588,823,018 22.69 Total 162,223 100 1,033,706,148 100 2,594,727,898 100 All Sectors Local 589,881 93.59 4,897,733,050 65.47 6,922,521,394 52.95 239 Regional 36,158 5.74 1,930,875,251 25.81 4,240,353,158 32.44 International 4,221 0.67 652,242,063 8.72 1,910,038,704 14.61 Grand Total 630,260 100 7,480,850,364 100 13,072,913,257 100
- 5. المالية والمؤسسات واالستثمارات للخزينة األهلي مجموعة Ahli Treasury, Investments & Financial Institutions Group 5 INVESTMENT استثمار Disclaimer: The trading and financial related data contained in this report has been obtained from sources considered by Jordan Ahli Bank to be reliable in all material respects. However, the accuracy, fairness and completeness thereof are not guaranteed by Jordan Ahli Bank and its employees and its third-party suppliers shall have no liability for errors or omissions with respect to the service or its delivery, re- gardless of the cause or source of such error or omission. This is not an invitation to buy or sell stocks traded in Amman Stock Exchange. The Purpose of this report is to provide information and analysis related to Amman Stock Exchange and assists investors to obtain infor- mation to support their decisions. The reader should not make any investment decision solely based on the information contained in this report and he/she should consult with his/her investment advisor before investing. This report is a copyright of Jordan Ahli Bank and should not be reproduced or redistributed partially or fully in away shape or manner without the express written consent of the Jordan Ahli Bank. Information Sources • Amman Stock Exchange: www.exchange.jo • Securities Depository Center: www.sdc.com.jo Contact Us: Lina N. Bakhit Chief Business Officer—CBO E-mail: Lina.bakhit@ahlibank.com.jo Tel.: 520 6000 / Ext: 1800 Majed Hejab Senior Vice President—SVP Head of Treasury, Investments and Financial Institutions E-mail: Majed.Hejab@ahlibank.com.jo Tel.: 520 6000 / Ext: 1810 Research & Studies Department Rabe Al-Bataineh Head of Research and Studies E-mail: Research.dept@ahlibank.com.jo Tel.: 520 6000 / Ext: 1814