Investment patterns report november 2019
•
0 likes•59 views

The report analyzes investment patterns and trends in the Amman Stock Exchange (ASE) for November 2019. Local Jordanian investors were the most active but had a net negative investment of JD 14.6 million. Regional investors had a net positive investment of JD 15.5 million while international investors had a net negative investment of JD 928 thousand. Jordanians make up over half of ASE ownership while regional investors own about a third. [END SUMMARY]

Recommended
Recommended
More Related Content
What's hot
What's hot (20)
Similar to Investment patterns report november 2019
Similar to Investment patterns report november 2019 (20)
More from ahli bank
More from ahli bank (20)
Recently uploaded
Recently uploaded (20)
Investment patterns report november 2019
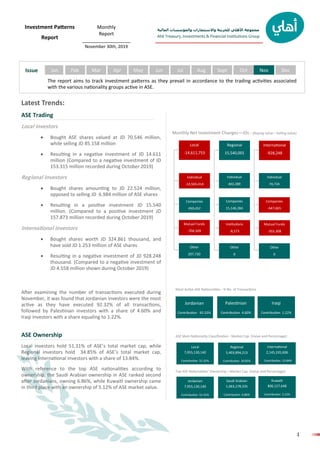
- 1. المالية والمؤسسات واالستثمارات للخزينة األهلي مجموعة Ahli Treasury, Investments & Financial Institutions Group 1 INVESTMENT استثمار Jan Feb Mar Apr May Jun Jul Aug Sept Oct Nov DecIssue Investment Patterns Report Monthly Report __________________ November 30th, 2019 The report aims to track investment patterns as they prevail in accordance to the trading activities associated with the various nationality groups active in ASE. Latest Trends: ASE Trading Local investors • Bought ASE shares valued at JD 70.546 million, while selling JD 85.158 million • Resulting in a negative investment of JD 14.611 million (Compared to a negative investment of JD 153.315 million recorded during October 2019) Regional Investors • Bought shares amounting to JD 22.524 million, opposed to selling JD 6.984 million of ASE shares • Resulting in a positive investment JD 15.540 million. (Compared to a positive investment JD 157.873 million recorded during October 2019) International investors • Bought shares worth JD 324.861 thousand, and have sold JD 1.253 million of ASE shares • Resulting in a negative investment of JD 928.248 thousand. (Compared to a negative investment of JD 4.558 million shown during October 2019) After examining the number of transactions executed during November, it was found that Jordanian investors were the most active as they have executed 92.32% of all transactions, followed by Palestinian investors with a share of 4.60% and Iraqi investors with a share equaling to 1.22%. ASE Ownership Local investors hold 51.31% of ASE’s total market cap, while Regional investors hold 34.85% of ASE’s total market cap, leaving International investors with a share of 13.84%. With reference to the top ASE nationalities according to ownership, the Saudi Arabian ownership in ASE ranked second after Jordanians, owning 6.86%, while Kuwaiti ownership came in third place with an ownership of 5.12% of ASE market value. Jordanian Contribution 92.32% Iraqi Contribution 1.22% Palestinian Contribution 4.60% Most Active ASE Nationalities - % No. of Transactions Local 7,955,130,140 Contribution 51.31% Regional 5,403,894,213 Contribution 34.85% Kuwaiti 806,127,648 Contribution 5.12% ASE Main Nationality Classification - Market Cap. (Value and Percentage): Top ASE Nationalities’ Ownership—Market Cap. (Value and Percentage): Saudi Arabian 1,063,278,335 Contribution 6.86% Jordanian 7,955,130,140 Contribution 51.31% International 2,145,335,606 Contribution 13.84% Local -14,611,753 International -928,248 Regional 15,540,001 Individual -14,565,414 Individual 74,724 Individual 402,289 Companies -647,665 Companies 15,146,284 Companies 450,452 Mutual Funds -704,509 Mutual Funds -355,308 Institutions -8,573 Other 0 Other 0 Other 207,720 Monthly Net Investment Changes—JDs : (Buying value—Selling value)
- 2. المالية والمؤسسات واالستثمارات للخزينة األهلي مجموعة Ahli Treasury, Investments & Financial Institutions Group 2 INVESTMENT استثمار ASE Nationality Classification - By Sector Net Investment - JD Million BySector Nationality Sell Buy Net Investment JD (Market Value)Securities Market Value Securities Market Value Banking Sector Local 13,502,980 16,541,991 3,546,691 6,832,545 -9,709,447 Regional 515,619 2,396,741 10,518,670 12,596,872 10,200,131 International 140,295 705,273 93,533 214,590 -490,684 Total Banking 14,158,894 19,644,006 14,158,894 19,644,006 Insurance Sector Local 2,875,347 3,084,436 2,615,451 2,825,984 -258,452 Regional 2,990 3,110 264,886 264,141 261,032 International 2,000 2,580 0 0 -2,580 Total Insurance 2,880,337 3,090,126 2,880,337 3,090,126 Services Sector Local 57,648,932 46,966,219 56,141,539 46,111,046 -855,172 Regional 4,878,750 2,743,169 6,932,925 4,049,156 1,305,987 International 691,878 509,654 145,096 58,839 -450,815 Total Services 63,219,560 50,219,041 63,219,560 50,219,041 Industry Sector Local 17,847,360 18,565,378 16,540,092 14,776,696 -3,788,682 Regional 2,110,071 1,841,644 3,416,924 5,614,495 3,772,851 International 19,923 35,601 20,338 51,432 15,831 Total Industry 19,977,354 20,442,623 19,977,354 20,442,623 All Sectors Local 91,874,619 85,158,024 78,843,773 70,546,271 -14,611,753 Regional 7,507,430 6,984,663 21,133,405 22,524,664 15,540,001 International 854,096 1,253,108 258,967 324,861 -928,248 Grand Total 100,236,145 93,395,796 100,236,145 93,395,796
- 3. المالية والمؤسسات واالستثمارات للخزينة األهلي مجموعة Ahli Treasury, Investments & Financial Institutions Group 3 INVESTMENT استثمار ASE Nationality Classification - By Investor Category Net Investment - JD Million ByInvestorCategory Nationality Investor Category Sell Buy Net Investment JD (Market Value)Securities Market Value Securities Market Value Local Individuals 76,810,266 68,658,712 64,597,424 54,093,298 -14,565,414 Companies 13,644,958 15,701,090 13,988,194 16,151,542 450,452 Mutual Funds 1,353,545 771,806 84,077 67,297 -704,509 Institutions 65,850 26,416 165,027 226,954 200,539 Organizations 0 0 9,051 7,181 7,181 Total 91,874,619 85,158,024 78,843,773 70,546,271 -14,611,753 Regional Individuals 5,921,451 4,987,462 7,047,713 5,389,751 402,289 Companies 1,585,454 1,988,628 14,085,692 17,134,912 15,146,284 Institutions 525 8,573 0 0 -8,573 Total 7,507,430 6,984,663 21,133,405 22,524,664 15,540,001 International Individuals 51,282 53,571 174,129 128,295 74,724 Companies 744,533 840,723 82,972 193,058 -647,665 Mutual Funds 58,281 358,815 1,866 3,507 -355,308 Total 854,096 1,253,108 258,967 324,861 -928,248 All Nationalities Individuals 82,782,999 73,699,745 71,819,266 59,611,345 -14,088,401 Companies 15,974,945 18,530,441 28,156,858 33,479,513 14,949,072 Mutual Funds 1,411,826 1,130,621 85,943 70,804 -1,059,817 Institutions 66,375 34,989 165,027 226,954 191,966 Organizations 0 0 9,051 7,181 7,181 Grand Total 100,236,145 93,395,796 100,236,145 93,395,796
- 4. المالية والمؤسسات واالستثمارات للخزينة األهلي مجموعة Ahli Treasury, Investments & Financial Institutions Group 4 INVESTMENT استثمار ASE Ownership Classification OwnershipSectorTop10Nationalities Serial Nationality Shareholders Securities Total Value No. % No. % Amount in JOD % 1 Jordanian 590,896 93.54 4,888,863,285 65.44 7,955,130,141 51.31 2 Saudi Arabian 2,490 0.39 406,038,794 5.44 1,063,278,335 6.86 3 Kuwaiti 2,870 0.45 221,820,532 2.97 806,127,649 5.20 4 Qatari 385 0.06 184,536,894 2.47 751,148,195 4.84 5 Bahraini 127 0.02 338,590,289 4.53 633,359,888 4.09 6 Caymanian 32 0.01 281,735,691 3.77 610,316,253 3.94 7 Libyan 97 0.02 139,670,226 1.87 473,782,662 3.06 8 Chinese 6 0.00 23,294,922 0.31 469,386,600 3.03 9 Lebanese 1,142 0.18 209,049,823 2.80 352,146,424 2.27 10 Palestinian 23,065 3.65 132,339,591 1.77 350,353,611 2.26 11 Other 10,582 1.68 644,472,473 8.63 2,039,330,203 13.15 Total 631,692 100 7,470,412,520 100 15,504,359,959 100 Sector No. of Regis- ters Nationality Shareholders No. % Securities No. % Total Value Amount in JD % Banking 16 Local 71,570 86.99 1,408,941,232 47.18 3,321,757,931 40.16 Regional 9,312 11.32 1,304,055,536 43.67 4,142,585,051 50.09 International 1,388 1.69 273,458,232 9.16 806,745,818 9.75 Total 82,270 100 2,986,455,000 100 8,271,088,800 100 Insurance 23 Local 13,726 95.21 192,785,586 72.12 234,474,152 72.37 Regional 598 4.15 55,068,628 20.60 53,978,590 16.66 International 92 0.64 19,468,638 7.28 35,554,883 10.97 Total 14,416 100 267,322,852 100 324,007,625 100 Services 145 Local 357,539 95.78 2,612,989,287 82.04 2,987,654,796 74.76 Regional 14,491 3.88 364,362,366 11.44 377,125,448 9.44 International 1,262 0.34 207,576,867 6.52 631,815,536 15.81 Total 373,292 100 3,184,928,520 100 3,996,595,781 100 Industry 56 Local 148,061 91.56 674,147,180 65.34 1,411,243,262 48.45 Regional 12,098 7.48 204,896,779 19.86 830,205,123 28.50 International 1,555 0.96 152,662,189 14.80 671,219,368 23.05 Total 161,714 100 1,031,706,148 100 2,912,667,753 100 All Sectors Local 590,896 93.54 4,888,863,285 65.44 7,955,130,141 51.31 240 Regional 36,499 5.78 1,928,383,309 25.81 5,403,894,213 34.85 International 4,297 0.68 653,165,926 8.74 2,145,335,606 13.84 Grand Total 631,692 100 7,470,412,520 100 15,504,359,960 100
- 5. المالية والمؤسسات واالستثمارات للخزينة األهلي مجموعة Ahli Treasury, Investments & Financial Institutions Group 5 INVESTMENT استثمار Disclaimer: The trading and financial related data contained in this report has been obtained from sources considered by Jordan Ahli Bank to be reliable in all material respects. However, the accuracy, fairness and completeness thereof are not guaranteed by Jordan Ahli Bank and its employees and its third-party suppliers shall have no liability for errors or omissions with respect to the service or its delivery, re- gardless of the cause or source of such error or omission. This is not an invitation to buy or sell stocks traded in Amman Stock Exchange. The Purpose of this report is to provide information and analysis related to Amman Stock Exchange and assists investors to obtain infor- mation to support their decisions. The reader should not make any investment decision solely based on the information contained in this report and he/she should consult with his/her investment advisor before investing. This report is a copyright of Jordan Ahli Bank and should not be reproduced or redistributed partially or fully in away shape or manner without the express written consent of the Jordan Ahli Bank. Information Sources • Amman Stock Exchange: www.exchange.jo • Securities Depository Center: www.sdc.com.jo Contact Us: Lina N. Bakhit Chief Business Officer—CBO E-mail: Lina.bakhit@ahlibank.com.jo Tel.: 520 6000 / Ext: 1800 Majed Hejab Senior Vice President—SVP Head of Treasury, Investments and Financial Institutions E-mail: Majed.Hejab@ahlibank.com.jo Tel.: 520 6000 / Ext: 1810 Research & Studies Department Rabe Al-Bataineh Head of Research and Studies E-mail: Research.dept@ahlibank.com.jo Tel.: 520 6000 / Ext: 1814