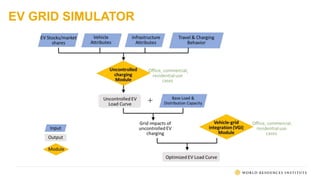
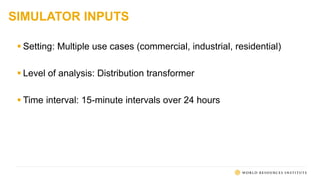
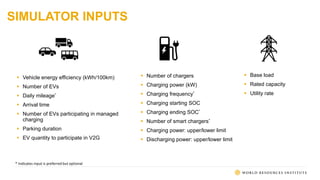
IMAGE | GREENTECHMEDIA
ELECTRIC VEHICLE GRID SIMULATOR
WRI Electric Mobility | April 2, 2020
AGENDA
 Current model inputs and outputs
 Case studies
 Future model improvements
EV GRID SIMULATOR
SIMULATOR INPUTS
 Setting: Multiple use cases (commercial, industrial, residential)
 Level of analysis: Distribution transformer
 Time interval: 15-minute intervals over 24 hours
SIMULATOR INPUTS
 Vehicle energy efficiency (kWh/100km)
 Number of EVs
 Daily mileage*
 Arrival time
 Number of EVs participating in managed
charging
 Parking duration
 EV quantity to participate in V2G
 Base load
 Rated capacity
 Utility rate
 Number of chargers
 Charging power (kW)
 Charging frequency*
 Charging starting SOC
 Charging ending SOC*
 Number of smart chargers*
 Charging power: upper/lower limit
 Discharging power: upper/lower limit
* Indicates input is preferred but optional
SIMULATOR OUTPUTS
Distribution transformer impact
 Increases in peak load
 Increased capacity required
 Time of peak load
 Peak-valley difference
EV load characteristics
 Max EV load
 EV ratio in peak load
 EV load over time
 Utilization factor
MODEL INSIGHTS
 Optimized EV charging strategy
 Time-sensitive electricity cost analysis
 Electricity cost and demand charge mitigation
 Determine VGI potential based on vehicle and infrastructure
specifications.
 Energy potential of parked vehicles
 Viability of various VGI applications
CASE STUDY: FREIGHT DEPOT
 Hypothetical scenario at commercial freight facility.
 Developed to observe a large quantity of vehicles returning to
charge at a single location.
 Key questions:
 Will distribution transformer be overloaded as electrification increases?
 How will managed charging mitigate overloading and potentially avoid
demand charges?
CASE STUDY: FREIGHT DEPOT
Unmanaged Charging Managed Charging
Number of vehicles: 150
Max capacity: 2400 kW
CASE STUDY: SUZHOU, CHINA
 City of Suzhou is looking to re-align their energy system
to accommodate future growth and test new concepts
 Second largest city in China by electricity consumption
 One of the wealthiest cities in China, witnessing rapid EV growth
CASE STUDY: SUZHOU, CHINA
0
1000
2000
3000
4000
5000
6000
0:00
1:15
2:30
3:45
5:00
6:15
7:30
8:45
10:00
11:15
12:30
13:45
15:00
16:15
17:30
18:45
20:00
21:15
22:30
23:45
kW
33%EV penetration 66%EV penetration
100%EV penetration Base load
Distribution capacity 80% of Distribution capacity
0
500
1000
1500
2000
2500
3000
3500
4000
4500
00:00
01:15
02:30
03:45
05:00
06:15
07:30
08:45
10:00
11:15
12:30
13:45
15:00
16:15
17:30
18:45
20:00
21:15
22:30
23:45
kW
33%EV penetration 66%EV penetration
100%EV penetration Base load
Distribution capacity 80% of Distribution capacity
0
1000
2000
3000
4000
5000
6000
7000
8000
0:00
1:15
2:30
3:45
5:00
6:15
7:30
8:45
10:00
11:15
12:30
13:45
15:00
16:15
17:30
18:45
20:00
21:15
22:30
23:45
kW
33%EV penetration 66%EV penetration
100%EV penetration Base load
Distribution capacity 80% of Distribution capacity
Case 1: Office Case 2: Commercial Complex Case 3: Residential Neighborhood
Suzhou modelling results indicate that residential distribution feeders
are most vulnerable to (or potentially hinder) large EV deployment
EV GRID SIMULATOR

Electric Vehicle Grid Simulator

  • 1.
    IMAGE | GREENTECHMEDIA ELECTRICVEHICLE GRID SIMULATOR WRI Electric Mobility | April 2, 2020
  • 2.
    AGENDA  Current modelinputs and outputs  Case studies  Future model improvements
  • 3.
  • 4.
    SIMULATOR INPUTS  Setting:Multiple use cases (commercial, industrial, residential)  Level of analysis: Distribution transformer  Time interval: 15-minute intervals over 24 hours
  • 5.
    SIMULATOR INPUTS  Vehicleenergy efficiency (kWh/100km)  Number of EVs  Daily mileage*  Arrival time  Number of EVs participating in managed charging  Parking duration  EV quantity to participate in V2G  Base load  Rated capacity  Utility rate  Number of chargers  Charging power (kW)  Charging frequency*  Charging starting SOC  Charging ending SOC*  Number of smart chargers*  Charging power: upper/lower limit  Discharging power: upper/lower limit * Indicates input is preferred but optional
  • 6.
    SIMULATOR OUTPUTS Distribution transformerimpact  Increases in peak load  Increased capacity required  Time of peak load  Peak-valley difference EV load characteristics  Max EV load  EV ratio in peak load  EV load over time  Utilization factor
  • 7.
    MODEL INSIGHTS  OptimizedEV charging strategy  Time-sensitive electricity cost analysis  Electricity cost and demand charge mitigation  Determine VGI potential based on vehicle and infrastructure specifications.  Energy potential of parked vehicles  Viability of various VGI applications
  • 8.
    CASE STUDY: FREIGHTDEPOT  Hypothetical scenario at commercial freight facility.  Developed to observe a large quantity of vehicles returning to charge at a single location.  Key questions:  Will distribution transformer be overloaded as electrification increases?  How will managed charging mitigate overloading and potentially avoid demand charges?
  • 9.
    CASE STUDY: FREIGHTDEPOT Unmanaged Charging Managed Charging Number of vehicles: 150 Max capacity: 2400 kW
  • 10.
    CASE STUDY: SUZHOU,CHINA  City of Suzhou is looking to re-align their energy system to accommodate future growth and test new concepts  Second largest city in China by electricity consumption  One of the wealthiest cities in China, witnessing rapid EV growth
  • 11.
    CASE STUDY: SUZHOU,CHINA 0 1000 2000 3000 4000 5000 6000 0:00 1:15 2:30 3:45 5:00 6:15 7:30 8:45 10:00 11:15 12:30 13:45 15:00 16:15 17:30 18:45 20:00 21:15 22:30 23:45 kW 33%EV penetration 66%EV penetration 100%EV penetration Base load Distribution capacity 80% of Distribution capacity 0 500 1000 1500 2000 2500 3000 3500 4000 4500 00:00 01:15 02:30 03:45 05:00 06:15 07:30 08:45 10:00 11:15 12:30 13:45 15:00 16:15 17:30 18:45 20:00 21:15 22:30 23:45 kW 33%EV penetration 66%EV penetration 100%EV penetration Base load Distribution capacity 80% of Distribution capacity 0 1000 2000 3000 4000 5000 6000 7000 8000 0:00 1:15 2:30 3:45 5:00 6:15 7:30 8:45 10:00 11:15 12:30 13:45 15:00 16:15 17:30 18:45 20:00 21:15 22:30 23:45 kW 33%EV penetration 66%EV penetration 100%EV penetration Base load Distribution capacity 80% of Distribution capacity Case 1: Office Case 2: Commercial Complex Case 3: Residential Neighborhood Suzhou modelling results indicate that residential distribution feeders are most vulnerable to (or potentially hinder) large EV deployment
  • 12.

Editor's Notes

  • #4 Using data inputs on vehicles, charging points, and electric power infrastructure. An analysis is run of current infrastructure constraints and how EV adoption would impact this, and how EVs can be used to mitigate and improve electricity consumption patterns.
  • #6 Note which inputs are OPTIONAL
  • #7 Reorganize these into the main outputs – max ev load, transformer capacity, cost information.