A Systematic Review Of The Literature Concerning The Relationship Between Obesity And Mortality In The Elderly
•
0 likes•2 views

Paper Writing Service http://StudyHub.vip/A-Systematic-Review-Of-The-Literature-C 👈

Recommended
Recommended
More Related Content
Similar to A Systematic Review Of The Literature Concerning The Relationship Between Obesity And Mortality In The Elderly
Similar to A Systematic Review Of The Literature Concerning The Relationship Between Obesity And Mortality In The Elderly (20)
More from Valerie Felton
More from Valerie Felton (20)
Recently uploaded
Recently uploaded (20)
A Systematic Review Of The Literature Concerning The Relationship Between Obesity And Mortality In The Elderly
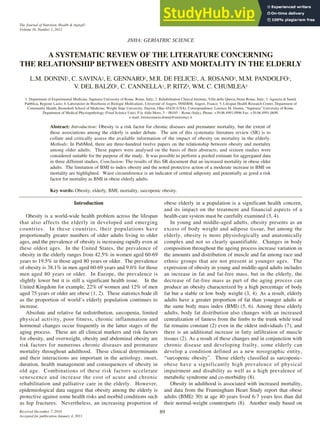
- 1. Introduction Obesity is a world-wide health problem across the lifespan that also affects the elderly in developed and emerging countries. In these countries, their populations have proportionally greater numbers of older adults living to older ages, and the prevalence of obesity is increasing rapidly even at these oldest ages. In the United States, the prevalence of obesity in the elderly ranges from 42.5% in women aged 60-69 years to 19.5% in those aged 80 years or older. The prevalence of obesity is 38.1% in men aged 60-69 years and 9.6% for those men aged 80 years or older. In Europe, the prevalence is slightly lower but it is still a significant health issue. In the United Kingdom for example, 22% of women and 12% of men aged 75 years or older are obese (1, 2). These statistics bode ill as the proportion of world’s elderly population continues to increase. Absolute and relative fat redistribution, sarcopenia, limited physical activity, poor fitness, chronic inflammation and hormonal changes occur frequently in the latter stages of the aging process. These are all clinical markers and risk factors for obesity, and overweight, obesity and abdominal obesity are risk factors for numerous chronic diseases and premature mortality throughout adulthood. These clinical determinants and their interactions are important in the aetiology, onset, duration, health management and consequences of obesity in old age. Combinations of these risk factors accelerate senescence and increase the cost of acute and chronic rehabilitation and palliative care in the elderly. However, epidemiological data suggest that obesity among the elderly is protective against some health risks and morbid conditions such as hip fractures. Nevertheless, an increasing proportion of obese elderly in a population is a significant health concern, and its impact on the treatment and financial aspects of a health-care system must be carefully examined (3, 4). In young and middle-aged adults, obesity presents as an excess of body weight and adipose tissue, but among the elderly, obesity is more physiologically and anatomically complex and not so clearly quantifiable. Changes in body composition throughout the ageing process increase variation in the amounts and distribution of muscle and fat among race and ethnic groups that are not present at younger ages. The expression of obesity in young and middle-aged adults includes an increase in fat and fat-free mass, but in the elderly, the decrease of fat-free mass as part of the aging process can produce an obesity characterized by a high percentage of body fat but a stable or low body weight (3, 4). As a result, elderly adults have a greater proportion of fat than younger adults at the same body mass index (BMI) (5, 6). Among these elderly adults, body fat distribution also changes with an increased centralization of fatness from the limbs to the trunk while total fat remains constant (2) even in the oldest individuals (7), and there is an additional increase in fatty infiltration of muscle tissues (2). As a result of these changes and in conjunction with chronic disease and developing frailty, some elderly can develop a condition defined as a new nosographic entity, “sarcopenic obesity”. Those elderly classified as sarcopenic- obese have a significantly high prevalence of physical impairment and disability as well as a high prevalence of metabolic syndrome and co-morbidity (8). Obesity in adulthood is associated with increased mortality, and data from the Framingham Heart Study report that obese adults (BMI≥ 30) at age 40 years lived 6-7 years less than did their normal-weight counterparts (8). Another study based on A SYSTEMATIC REVIEW OF THE LITERATURE CONCERNING THE RELATIONSHIP BETWEEN OBESITY AND MORTALITY IN THE ELDERLY L.M. DONINI1, C. SAVINA2, E. GENNARO1, M.R. DE FELICE2, A. ROSANO3, M.M. PANDOLFO1, V. DEL BALZO1, C. CANNELLA1, P. RITZ4, WM. C. CHUMLEA5 1. Department of Experimental Medicine, Sapienza University of Rome, Rome, Italy; 2. Rehabilitation Clinical Institute, Villa delle Querce,Nemi Rome, Italy; 3. Agenzia di Sanità Pubblica, Regione Lazio; 4. Laboratoire de Biochimie et Biologie Moléculaire, Université of Angers, INSERM, Angers, France; 5. Lifespan Health Research Center, Department of Community Health, Boonshoft School of Medicine, Wright State University, Dayton, Ohio 45420 (USA). Correspondence: Lorenzo M. Donini, “Sapienza” University of Rome, Department of Medical Physiopathology (Food Science Unit), P.le Aldo Moro, 5 – 00185 – Rome (Italy), Phone: +39.06.4991.0996 Fax: +39.06.4991.0699, e-mail: lorenzomaria.donini@uniroma1.it Abstract: Introduction: Obesity is a risk factor for chronic diseases and premature mortality, but the extent of these associations among the elderly is under debate. The aim of this systematic literature review (SR) is to collate and critically assess the available information of the impact of obesity on mortality in the elderly. Methods: In PubMed, there are three-hundred twelve papers on the relationship between obesity and mortality among older adults. These papers were analysed on the basis of their abstracts, and sixteen studies were considered suitable for the purpose of the study. It was possible to perform a pooled estimate for aggregated data in three different studies. Conclusion: The results of this SR document that an increased mortality in obese older adults. The limitation of BMI to index obesity and the noted protective action of a moderate increase in BMI on mortality are highlighted. Waist circumference is an indicator of central adiposity and potentially as good a risk factor for mortality as BMI in obese elderly adults. Key words: Obesity, elderly, BMI, mortality, sarcopenic obesity. 89 The Journal of Nutrition, Health & Aging© Volume 16, Number 1, 2012 JNHA: GERIATRIC SCIENCE Received December 7, 2010 Accepted for publication January 4, 2011
- 2. several U.S. data sets (US Life Tables (1999), the third National Health and Nutrition Examination Survey (NHANES III), NHANES I and II, and the NHANES II Mortality Study) also reported that obesity reduces life expectancy, particularly so in younger adults. For example, in obese (BMI≥ 45) white men and women aged 20-30 years, the minimum years of life lost was 13 and 8 years, respectively (9). However, the relationship between body weight and mortality in the elderly is controversial because optimal weight varies by age, race and sex, and weight is positively associated with longevity in older populations (10). Much of the current literature reports a curvilinear relationship where the risk of death increases among the very heavy and the very lean, but overweight, healthy adults have a reduced risk of death. However, in most of these studies it is unclear if the increased longevity of the overweight elderly is a result of comparisons to lean (or malnourished) or to normal-weight subjects. The aim of this systematic literature review (SR) is to collate, review and critically assess current scientific and clinical information on the impact of obesity on mortality in the elderly so as to help clarify and improve our understanding of the complex relationship between the increasing health problem of obesity in elderly adults and the risk of mortality. This knowledge can help to reduce the cost of health care and improve the quality of life in this segment of the world’s population. Material and Methods This SR was conducted following steps codified by Egger and colleagues (11). 1. Creation of the working group at three institutions a. “Sapienza” University of Rome: one methodological operator (expert in statistics: AR) and three clinical operators (LMD, CS, EG) two of whom were senior researchers experienced in clinical geriatric nutrition. b. INSERM U558, Service de Nutrition, Pôle cardiovasculaire et métabolique, CHU Toulouse (F) one senior investigator (PR) of energy metabolism in the elderly. c. Lifespan Health Research Center, Boonshoft School of Medicine Dayton, Ohio, (USA) one senior investigator (WCC) experienced in body composition and nutritional assessment in the elderly. 2. Formulation and revision of questions based on evidence presented in the introduction: obesity in the elderly and its relation to mortality. 3. Identification of relevant studies and development of a research strategy plan. a. In PubMed (Public Medline run by the National Center of Biotechnology Information (NCBI) of the National Library of Medicine of Bethesda (USA), through: i. selection of key words such as obesity, aged, elderly BMI, mortality that defines of the interest field of the documents to search, grouped in inverted commas (“…”) and used separately or in combination; ii. use of the Boolean “AND” operator to allow logical relations among concepts; iii.use of research modalities such as advanced search. iv.limitations 1. a time limit of papers published in the last 10 years 2. papers on human subjects 3. studies of Caucasian subjects ≥ 65 years of age 4. papers in English, French or Italian b. Senior researchers experienced in geriatric clinical nutrition through revision of reviews and individual articles on nutrition and geriatrics published in reviews qualified in the Index Medicus: i. clinical nutrition reviews in journals such as Nutrition, American Journal of Clinical Nutrition, Nutrition Reviews, British Journal of Nutrition, Journal of Nutrition Health & Aging ii. geriatric reviews in Journals such as Age & Aging, Journal of the American Geriatric Society, Journals of Gerontology, 4. Definition of the selection criteria of the studies to be included in the SR: a. Studies exploring the impact of obesity in the elderly on mortality b. Study design based upon clinical trials, randomized controlled trials c. Studies with end-points of morbid and mortal events d. Study outcome with identifying parameters and covariates correlated with obesity morbidity and mortality 5. The quality of the selected publications was further critiqued based up on the following characteristics: a. Study duration (temporal, up to an event (death, …); b. Enrollment criteria (random, all present at a certain time, …); c. Description of the sample and analysis of drop-outs d. Analysis of the interaction of covariates and confounding variables conditioning the relation between obesity and mortality (sex, age, economic level), pathologies (number or severity of current pathologies), drugs (number and typology of drugs prescribed), depression; 6. Analysis and presentation of study outcomes were compared: a. The data extrapolated from the selected publications were collated and tabulated to allow for comparisons. b. The first author, the name of the journal where the study was published and year of publication, study characteristics, design, setting, selection criteria, subjects included, duration of the study, measure of mortality. 7. Statistical analysis was carried out in the form of : a. A narrative résumé of the reports (review or RCT; setting and design of the study; selection criteria of the studied sample; drop out, analysis of interactions and confounding and covariates) b. Meta-analysis for pooled estimate for aggregated data (12) RELATIONSHIP BETWEEN OBESITY AND MORTALITY IN THE ELDERLY The Journal of Nutrition, Health & Aging© Volume 16, Number 1, 2012 90
- 3. Results General characteristics of the studies analysed in the SR As of February 2010, three-hundred twelve published papers on the topic of the relationship between obesity and mortality in the elderly were listed in PubMed. We reviewed the abstracts of all these papers and selected sixteen for inclusion in the SR based upon the criteria presented in the methods section. Most of these were prospective longitudinal or population-based epidemiological studies aimed at cardiovascular or cancer prevention. Over 200,000 subjects 65 years of age and older were included in these sixteen reports, and all were living in their local communities except in one study (13). The duration of follow-up among the studies ranged from 13 months to 15 years. All the subjects were Caucasian except in the study of Dey (13) where ethnicity was not reported. The drop-out rate was noted only in four studies, and analysis of dropouts was conducted in only two studies. In all sixteen studies, a BMI ≥ 30 kg/m² defined obesity, and the risk of mortality was analysed using Cox proportional hazard models except in two reports (14, 15). The inclusion of covariates of morbidity and mortality differed across the different studies, but waist circumference (WC), sex, age, smoking status and cardiovascular disease were included in most studies. The relationship between obesity and mortality in old age Obesity and mortality are not always considered coincident in each study. In most a U-shaped-curve relationship occurs between BMI and mortality with an increase risk of death for low (<18.5 kg/m²) or very high BMI values, but the nadir of the curves differ among the selected studies. Details of these studies discussed below are presented in Tables 1-3 for comparison. The largest study of the relationship between BMI and mortality was based on data of over a million participants for a total of 14 years of follow-up published by Calle et al. in 1999 (16). These authors found that a high BMI of over 25.0 kg/m² in women and 26.5 kg/m² in men was significantly associated with an increased risk for all cause mortality among men and women 65 years of age and older. During this study 9,681 elderly men and 19,509 elderly women died. The lowest death rate per 100,000 person-years was between a BMI of 20.5 and 21.9 kg/m² for those between 65 and 74 years of age, and of 23.5 to 24.9 kg/m² for those 75 years of age and older for both men and women. The highest mortality in all cases was at a BMI ≥ 35 kg/m² both for men (RR 2.68; 95% CI: 1.76-4.08) and women (RR: 1.89; 95% CI: 1.62-2.21). As expected, the shape and magnitude of the BMI and mortality relationship was substantially modified by a history of both smoking and disease, which are predictive factors of leanness and poor survival. Also, Adams and colleagues identified a "U" shaped curve that characterized the relationship between obesity and mortality in men, aged 66 to 71 years where the highest mortality rate was correlated with high values of BMI (≥ 40 kg/m²), and the lowest mortality rate was for a BMI of between 25 and 26.4 kg/m² (17). A “U” shaped curve relationship between BMI and mortality for men and women from ages 70 to 85 years was also demonstrated in the findings of by Dey and Rothenberg (13), during a follow-up of 15 years. The lowest mortality risk was in the middle quintile of BMI for the men of between 24.7 to 26.4 kg/m² and for the women between 24.6 and 26.5 kg/m². The nadir of the curve was at a BMI of 27-29 kg/m² for men and between 25-27 kg/m² for women. The mortality risk significantly increased for BMI values of between 28.6- 39.2 kg/m² for men and between 29.3- 39.8 kg/m² for women. The study of Wassertheil-Smoller and colleagues (18) included a sample of 3,975 older adults with hypertension (systolic blood pressure ≥ 160 mmHg and diastolic blood pressure ≤ 90 mmHg who were treated with atenolol and chlorthalidone), noted that the relation between BMI and cerebro-cardiovascular accidents confirmed the “U” shaped curve relationship between BMI and mortality. In this study, the nadir of this curve was at a BMI of 27.7 kg/m², and the lowest mortality risk was at a BMI of 25.8 kg/m² in men and of 29.6 kg/m² for women. Similar values were found for those who had never smoked (nadir of 27.9 kg/m²) or for current or recently stopped smokers (nadir of 29.1 kg/m²). For a BMI over 30 kg/m², the mortality risk rises significantly for both men and women. Stevens (14) conducted a study of a sample of 62,116 men and 262,019 women, including 46,954 who were aged 65 years and older (9,816 men and 37,138 women). For the group of 65-74 year old women with a BMI of 19.0 to 21.9 kg/m², there were 1,494 deaths per 100,000 person-years due to cardiovascular disease, compared with 1,854 deaths per 100,000 person-years among subjects with a BMI of 29.0 to 31.9 kg/m². For men and women aged over 75 years, the mortality rate did not increase with BMI; for women 75-84 years of age at a BMI of 19 to 21.9 kg/m², there were 5,259 deaths per 100,000 person-years due to cardiovascular disease, compared to 5,227 deaths per 100,000 person-years into the group with same age, same sex, but at a BMI of 29 to 31.9 kg/m². Although mortality increased with increasing BMI, the relative risk in these older adults is lower than that of younger adults. The BMI value corresponding to the nadir of the risk of mortality was of 27.4 kg/m² among those over 75 years of age and 28.5 kg/m² for those over 80 years of age. Hillier et al (19), analyzed a sample of 9,704 U.S. women aged 65 years and older and reported that the risk of developing cardiovascular and coronary disease is twice as high for women with the metabolic syndrome (NCEP criteria - National Cholesterol Education Panel - or World Health Organization criteria). Sixty-one percent of women with the metabolic syndrome died during the follow-up, compared to 34% of deaths among women without metabolic syndrome. In the study by Diehr et al (15) conducted on a sample of 5,201 old JNHA: GERIATRIC SCIENCE The Journal of Nutrition, Health & Aging© Volume 16, Number 1, 2012 91
- 4. 92 The Journal of Nutrition, Health & Aging© Volume 16, Number 1, 2012 RELATIONSHIP BETWEEN OBESITY AND MORTALITY IN THE ELDERLY Table 1 General Characteristics of selected studies Design Setting Selection criteria Limits of the study NON-INSTITUTIONALISED Janssen I et al: Cohort longitudinal study Participants to the Cardiovascular M and F ≥ 65 yrs old Participants were predominately white, and more than JAGS 2005; 53: 2112-8 Health Study (CHS) half were women All-cause mortality was the only outcome examined Wassertheil-Smoller S Randomized clinical trial Participants to the Systolic M and F ≥ 60 yrs old; SBP > Despite randomization, the control and treatment groups et al: Arch Intern Med 2000; Hypertension in the Elderly 160 mmHg and DBP < 90 differed in important unknown confounders 160: 494-500 Program trial (SHEP) mmHg Grabowski DC et al: Retrospective cohort study Participants to the Longitudinal M and F ≥ 70 yrs old It was not possible to examine the effects of smoking, JAGS 2001; 49: 968-979 Study of Aging (LSOA) exercise or aerobic capacity in this dataset. Self-reported heights and weights were used to compute BMI Hillier TA et al: Prospective cohort study Participants to the Study of M and F ≥ 70 yrs old Not reported Diabetes Care 2005; osteoporotic fractures (SOF) 28: 2258-60 Stevens J. et al : Prospective cohort study Participants to the American analysis was restricted to Self-reported heights and weights were used to compute BMI N Engl J Med 1998; Cancer Society’s subjects who had never BMI was estimated only once, at one age, for each subject 338: 1-7 Cancer Prevention Study I smoked, who had no history the number of years of follow-up was the same in the cohort of cancer, heart disease or of 30-year-old subjects and among 85-year-old subjects stroke, Involuntary weight oss 4.5 kg in past 2 yr Diehr P. et al: Cohort longitudinal study Participants to the M and F > 65 yrs old who Too short follow- up Am J Public Health Cardiovascular Health Study had never smoked Exclusion of the sickest and thinnest people 1998; 88: 623-629 (CHS) Calle E. et al : Prospective cohort study Participants to the American M and F > 30 yrs old The increased risk of death from specific causes that was N Engl J Med 1999; Cancer Society’s Cancer associated with leanness in this and other studies may 341: 1097-105 Prevention Study II reflect pre-existing, but unrecognized, disease processes Unable to control for long-term weight loss Self-reported heights and weights were used to compute BMI No direct measure of adiposity or of lean body mass, and no measure of central adiposity Janssen I: Prospective cohort study Participants to the M and F > 65 yrs old No measure of adiposity distribution Obesity 2007; 15: Cardiovascular Health Study Participants were predominately white 1827-40 (CHS) Adams KF et al Prospective cohort study Participants to the National M and F aged 50-71 years Not reported N Engl J Med 2006; Institutes of Health (NHI)-Ay 355: 763-78 ARP Diet and Health Stud Ajani UA et al: Randomized placebo- Participants to the Physicians’ M and F aged 40-84 years Self-reported heights and weights were used to compute BMI Ann Epidemiol controlled trial Health Study 2004; 10: 731-739 Dorn JM et al : Prospective cohort study Participants to the Buffalo Blood M and F aged 20-96 years, Self-reported heights and weights were used to compute BMI Am J Epid 1997; Pressure Study who had no history of cancer, BMI and other characteristics were determined only at 146: 919-931 heart disease or stroke, baseline diabetes No measures of body composition or fat distribution were available Miller MD et al: Prospective cohort study Participants to the Australian M and F > 70 yrs old Some of the most ill people may have been excluded due to JAGS 2002; 50: Longitudinal Study of Aging selection criteria 1272-1277 Men were significantly older than women Visscher TLS et al: Prospective cohort study Participants to the Rotterdam M and F aged 55-102 years No informations about weight loss or health status Int J of Obes Study 2001; 25: 1730-1735 INSTITUTIONALISED and FREE-LIVING SUBJECTS Dey DK et al : Prospective cohort study Subjects enrolled at the Göteborg M and F > 70 yrs old Chronic diseases were not considered Eur J Clin Nutr. 2001; University (Sweden) 55 : 482-492 INSTITUTIONALISED SUBJECTS Volpato S et al: Prospective cohort study M and F institutionalised in M and F aged 65-99 years, Body composition was obtained from Bioelectrical JAGS 29004; 52: the “Istituto di riposo per who had no history of impedance analysis 886-891 anziani” of Padua (Italy) acute diseases in the last 30 No informations about muscle mass, physical activity, days and weight loss The sample was mainly constituted by women Taylor DH et al: Cross-sectional study Participants to the National Long M and F > 65 yrs old Confounders factors (smoking habits, alcohol consumption) JAGS 2001; 49: Term Care Survey (NLTCS) were not considered 1319-1326 Legend: BMI: body mass index
- 5. 93 The Journal of Nutrition, Health & Aging© Volume 16, Number 1, 2012 JNHA: GERIATRIC SCIENCE adults, a decrease in mortality was again noted with increasing BMI, but this effect was reversed for values of BMI between 32 and 34 kg/m² for both men and women. Among men the number of deaths per 100,000 person-years, starting from values of 5,977 for a BMI between 20 and 22 kg/m², reached values of 2,260 per 100,000 person-years for a BMI 30.1 to 32 kg/m², and decreased to 3,931 per 100,000 person-years when the BMI was between 32.1 and 34 kg/m². For women, the same trend was observed, with a mortality of 1,710 deaths per 100,000 person-years for a BMI between 20 and 22 kg/m², arriving at 1,429 deaths per 100,000 person-years when BMI was between 30.1 and 32 kg/m². For values of BMI between 32.1 and 34 kg/m², the mortality rate increased again. Once more the relationship between BMI and mortality was represented by a "U" shaped curve. The relationship between BMI and mortality was similar in the study of Dorn et al (20) where in a sample of 1,308 men and women, aged between 20 and 96 years with a follow up period of 29 years, there were 91 and 95 deaths among men and women respectively 65-96 years of age. A “U” shaped curve Table 2 Characteristics of the sample analysed in the studies selected in the systematic review Subjects Study duration Drop out FREE-LIVING SUBJECTS Janssen I et al: 5200 M and F; 94,7% whites Enrollement: 1989-1990. Not indicated JAGS 2005; 53: 2112-8 9 yrs follow-up Wassertheil-Smoller S 4736 M and F, black and white 5 yrs follow-up 47 participants (BMI not available) et al: Arch Intern Med 2000; 160: 494-500 Grabowski DC et al: 7.527 participants: black, white (91,4%) and Enrollement:1984 Not indicated JAGS 2001; hispanic 8 yrs follow-up 49: 968-979 Hillier TA et al: 9704 F (99% non-hispanic white) Enrollement:1986-1988 Functionally impaired subjects Diabetes Care 2005; 28: 12 yrs follow-up 2258-60 Stevens J. et al : 62.116 M and 262.019 F (46.954 elderly Enrollement:1959-1960 Not indicated N Engl J Med 1998; participants: 9.816 M, 37.138 F) 13 years follow-up 338: 1-7 100% white Diehr P. et al: 4317 M and F Enrollement: 1989 Not indicated Am J Public Health 1998; 95% white 5 yrs follow-up 88: 623-629 Calle E. et al : 457.785 M, 588.369 F: Enrollement: 1982 Not indicated N Engl J Med 1999; white and black 14 years follow up 341: 1097-105 Janssen I: 4968 M and F Enrollement: 1989-90 Not indicated Obesity 2007; 15: White: 94,8% 9 years follow up 1827-40 Adams KF et al 527265 participants (313047 M, 214218 F) Enrollement: 1995-6 Not indicated N Engl J Med 2006; 90% white 10 years follow up 355: 763-78 Ajani UA et al: 85078 M Enrollement: 1983 Not indicated Ann Epidemiol 2004; 10: 100% white 5 years follow up 731-739 Dorn JM et al : 1308 participants (611 M, 697 F) Enrollement:1960-61 Not indicated Am J Epid 1997; 100% white 29 years follow up 146: 919-931 Miller MD et al: JAGS 2002; 50: 1396 M and F Enrollement:1992 Not indicated 1272-1277 100% white 8 years follow up Visscher TLS et al: 6296 M and F Enrollement:1990-93 Not indicated Int J of Obes 100% white 5 years follow up 2001; 25: 1730-1735 INSTITUTIONALISED and FREE-LIVING SUBJECTS Dey DK et al : 2628 subjects (1225 U, 1403 F) Enrollement:1971-1981 35 subjects (15 M, 20 F) weight and stature not available Eur J Clin Nutr. 2001; 15 years follow up 3 F with BMI ≥ 40 55 : 482-492 Neoplastic subjects (77 M and 108 F) INSTITUTIONALISED SUBJECTS Volpato S et al: 344 subjects (272 F, 72 U) Enrollement: 1990 Not indicated JAGS 29004; 52: 4 years follow up 886-891 Taylor DH et al: 4208 M and F Enrollement:1994 Not indicated JAGS 2001; 49: 100% white 1 year follow up 1319-1326 Legend: BMI: body mass index
- 6. RELATIONSHIP BETWEEN OBESITY AND MORTALITY IN THE ELDERLY The Journal of Nutrition, Health & Aging© Volume 16, Number 1, 2012 94 Table 3 Correlation between mortality and obesity Mortality analysis Correlation between mortality and obesity FREE-LIVING SUBJECTS Janssen I et al: Cox-proportional hazards model, considering BMI and WC were both negative predictors of mortality. JAGS 2005; 53: 2112-8 sex, age, ethnicity, socioeconomic status, BMI and WC examined simultaneously, BMI was a negative predictor of mortality, smoking habits, physical activity, health status whereas WC was a positive predictor of mortality. Mortality rates per 1000 person-year After controlling for WC, mortality risk decreased 21% for every standard deviation increase in BMI. After controlling for BMI, mortality risk increased 13% for every standard deviation increase in WC. The patterns of associations were consistent by sex, age, and disease status. Wassertheil-Smoller S et al: Cox-proportional hazard analysis, considering The relation between BMI and cerebro-cardiovascular accidents, confirms the “U” shaped Arch Intern Med 2000; 160: age, ethnicity, sex, educational level relation between BMI and mortality 494-500 Mortality rates per 1000 person-year The nadir of this curve is at a BMI of 27.7 kg/m² The lowest mortality risk is associated with a BMI of 25.8 kg/m² in men and of 29.6 kg/m² for women. Similar values for patients who had never smoked (nadir of 27.9 kg/m²) or for patients who smoke now or in the recent past (nadir of 29.1 kg/m²) For BMI over 30 kg/m², the mortality risk rises significantly for both men and women. Grabowski DC et al: JAGS 2001; Cox proportional hazard model Decreased mortality in obese older people. 49: 968-979 The group of malnourished subjects (BMI <19.4 kg/m²) has the highest mortality (53.9%; HR 1.46), followed by the normal-weight subjects (37%), whereas the overweight-obese group (BMI > 28.5 kg/m²) has the lowest mortality (33.5%; HR 0.86). Lowest mortality in obese older people persists despite controlling for different confounders: demographic factors, health service utilisation and functional status. Hillier TA et al: Cox proportional hazard model considering age 61% of elderly women with metabolic syndrome died during the follow-up, compared to 34% of Diabetes Care 2005; 28: 2258-60 and smoking habits deaths among women without metabolic syndrome. Stevens J. et al : Proportional-hazard analysis (PROC PHREG, For 65-74 years old women with a BMI of 19.0 to 21.9 kg/m², 1,494 deaths per 100,000 person- N Engl J Med 1998; 338: 1-7 SAS Institute, Cary, N.C.) years due to cardiovascular disease, compared with 1854 deaths per 100,000 person-years Likelihood-ratio test among subjects with a BMI of 29.0 to 31.9 kg/m². Weighted linear regression analysis For men and women aged over 75 years, the mortality rate does not increase with BMI: within the group of women 75-84 years with BMI of 19 to 21.9 kg / m², Although there is an increase in mortality with increasing BMI, the RR is lower than that of younger individuals. The BMI value corresponding to the nadir of the risk of mortality is of 27.4 kg/m² among the ultra seventy-five and 28.5 kg/m² among the ultra eighty. Diehr P. et al: Mortality rate (5 years-person) Relation between BMI and mortality is represented by a "U" shaped curve (decrease in Am J Public Health 1998; Logistic regression model mortality with increasing BMI; reversed effect for values of BMI between 32 and 34 kg/m² for 88: 623-629 both men and women) Men: death rate per 100,000 person-years is of 5977 for a BMI between 20 and 22 kg/m², 2260 for a BMI 30.1 to 32 kg/m², 3931 when the BMI is between 32.1 and 34 kg / m² Women: mortality rate of 1710 for a BMI between 20 and 22 kg/m², 1429 when the BMI is between 30.1 and 32 kg/m². For values of BMI between 32.1 and 34 kg/m², the rate increases again. Calle E. et al : Mortality rate considering age A high BMI is associated with higher rates of death from all causes among men and women N Engl J Med 1999; 341: 1097-105 Cox proportional hazard model ("U" shaped relation): - the lowest death rate per 100,000 person-years was within the class of BMI between 20.5 and 21.9 kg/m² for age between 65 and 74 years, and the BMI class of 23.5 to 24.9 kg/m² for subjects > 75 years - the highest mortality in all cases was at BMI ≥ 35 kg/m² both for men (RR 2.68; 95% CI: 1.76- 4.08) and women (RR: 1.89; 95% CI: 1.62-2.21). The association between BMI and mortality is substantially modified by a history of both smoking and disease, factors that are predictive of leanness and poor survival. Janssen I: Cox proportional hazard model Compared with the normal-weight group, the risks of myocardial infarction, stroke, sleep apnea, Obesity 2007; 15: 1827-40 urinary incontinence, cancer, and osteoporosis is not different in the overweight group (p < 0.05). The risks for arthritis and physical disability are modestly increased in the overweight group (p < 0.05), whereas the risk for type 2 diabetes is increased by 78% in the overweight group (p < 0.01). After adjusting for all relevant covariates, all cause mortality risk was 11% lower in the overweight group (p _ 0.05). Adams KF et al Mortality rates per 100.000 person-year Cox regression analysis, considering ethnicity, educational level, smoking habits, alcohol N Engl J Med 2006; 355: 763-78 consumption, chronic diseases Increased risk of death for the highest and lowest categories of BMI among both men and women, in all racial or ethnic groups, and at all ages. Ajani UA et al: Proportional hazard regression model The highest RR of mortality occurs for BMI above 30 kg/m² whereas there is a reduced risk of Ann Epidemiol 2004; 10: mortality for BMI between 27.5 and 29.9 kg/m². 731-739 Dorn JM et al : Cox proportional hazard model “U” shaped curve correctly described the relation between BMI and mortality Am J Epid 1997; associated with cardiovascular diseases 146: 919-931 As regards men, the lowest mortality is linked to a range of BMI between 25.2 and 27.4 kg/m². Miller MD et al: Cox proportional hazard regression model After adjustment for potential confounders (baseline age, gender, marital status, smoking, self- JAGS 2002; 50: 1272-1277 rated health, ability to conduct activities of daily living, comorbidity, cognition performance, and presence of depression), those older Australians with a low CAMA (Corrected Arm Muscle
- 7. described the relationship between BMI and mortality associated with cardiovascular diseases in this sample. For the men, the lowest mortality was linked to BMI values of between 25.2 and 27.4 kg/m². An increased risk of mortality associated with an increased BMI was also identified by the analysis conducted by Ajani and collaborators (21). In their study of older adults aged between 70 and 80 years, the highest relative risk of mortality occurred for BMI values above 30 kg/m², but there was a reduced risk of mortality for BMI between 27.5 and 29.9 kg/m². According to the study conducted in 1994 by Taylor et al (22) in 4,208 institutionalized elderly adults, BMI and mortality were linked by a "J" shaped curve, with the nadir of the curve corresponding to values of BMI between 30 and 34.9 kg/m² for subjects aged between 65 and 84 years, and between 25 and 29.9 kg/m² for subjects aged ≥ 85 years. The results from this study indicate that the lowest mortality risk was associated with a BMI corresponding to the first degree of obesity based on international guidelines (23). In contrast to the findings of previous studies, analysis of the Longitudinal Study of Aging (LSOA) conducted by Grabowski et al (24), noted a decreased mortality in obese older adults. Within this sample, malnourished subjects at BMI values of <19.4 kg/m² who represents less than 10% of the population, had the highest mortality (53.9%; HR 1.46), followed by the normal-weight subjects (37%); whereas, the overweight-obese group (BMI > 28.5 kg/m²) had the lowest mortality (33.5%; HR 0.86). This low mortality in the obese group persisted despite controlling for several confounders such as demographic factors, health service utilisation and functional status. According to the studies conducted by Janssen (25, 26) with a follow-up of 9 years in a cohort from the Cardiovascular Health Study (CHS), after adjusting for confounding variables (age, sex, race, socio-economic status, physical activities and prevalent diseases), the risk for all-cause mortality was 11% lower in the overweight group (BMI 25 to 29.9 kg/m²) and 17% lower in the obese group ( BMI ≥ 30 kg/m²) compared with the normal-weight group (BMI ≤ 24.9 kg/m²). The effect of an elevated BMI on decreasing mortality risk was particularly evident in the oldest (≥ 75 years) and those in the lowest smoking exposure category. Measurements of Obesity In some of the studies reviewed, it was questioned whether BMI is an adequate descriptive indicator of mortality among elderly adults when compared to waist circumference (WC), which is strongly related to both visceral and total fat at the same age group. The risk relationship of BMI and WC on mortality in both women and men were examined with particular attention to independent predictive value of these two anthropometric variables (27). Janssen et al (26) showed that death rates per 1,000 person-years (adjusted for age and sex) were highest in those older adults who had a high WC (96.4±8 and 107.4±8 cm) within the overweight and obese BMI categories (27.2±1 and 32.6±2 kg/m²). Within the low (82.0±7 cm) and moderate (91±7 cm) WC categories, deaths rates were lower in the BMI overweight (25.4±2 kg/m²) and obese (28.9±4 kg/m²) adults, than in those with a normal BMI (22.8±2 kg/m²). After controlling for WC, mortality risk decreased 21% for every standard deviation increase in BMI; whereas, after controlling for BMI, mortality risk increased only 13% for every standard deviation increase in WC. Another study, conducted by Visscher et al (28), maintains that high values of WC are a better predictor of mortality than BMI. WC values between 90 and 102 cm and greater than 102 cm are associated with increased mortality and indicate that WC is able to predict mortality risk more specifically than BMI. Some studies have used other measures or indices of obesity. Miller and collaborators in an earlier study conducted (29) on a population of 1,396 elderly adults used corrected arm muscle area (the ratio between the average circumference of the arm and triceps skinfold) which had a greater predictive value for mortality among during a 8 year follow up, but it is very prone to measurement error. In addition, Volpato et al (30) conducted JNHA: GERIATRIC SCIENCE The Journal of Nutrition, Health & Aging© Volume 16, Number 1, 2012 95 Area) had an increased risk of mortality at 8-year follow-up (HR 1.94, 95% CI 1.25–3.00) There was no increased risk in 8-year mortality identified for those with a high or low BMI. Visscher TLS et al: Int J of Obes Cox proportional hazard model U shaped curve describes the relation between BMI and mortality 2001; 25: 1730-1735 An increased risk is present for BMI≥30 A linear correlation is present between WC and mortality. INSTITUTIONALISED and FREE-LIVING SUBJECTS Dey DK et al : Cox proportional hazard regression model “U” shaped relation between BMI and mortality Eur J Clin Nutr. 2001; 55 : 482-492 The lowest mortality risk has been found in the middle quintile of BMI (24.7 to 26.4 kg/m²) for men and women The nadir of the curve is at 27-29 kg/m² for men and at 25-27 kg/m² for women. The mortality risk significantly increases for values of BMI between 28.6 and 39.2 kg/m² for men and between 29.3 and 39.8 kg/m² for women. INSTITUTIONALISED SUBJECTS Volpato S et al: Kaplan-Meier Curves After adjustment for age and sex, subjects with low BMI had significantly higher mortality than JAGS 29004; 52: 886-891 Cox Proportional Hazard Model those with higher BMI levels. In a fully adjusted regression model, there was no association between BMI levels and risk of mortality, with subjects in the top tertile having the same likelihood of mortality as subjects in the lowest tertile (RR 0.94, 95% CI 0.61–1.43). Taylor DH et al: Mortality rates per 1000 person-year BMI and mortality are linked by a "J" shaped curve, with the nadir of the curve corresponding to JAGS 2001; 49: 1319-1326 Multivariate logistic regression values of BMI between 30 and 34.9 kg/m² for subjects aged between 65 and 84 years, and between 25 and 29.9 kg/m² for subjects aged ≥ 85 years. Legend: BMI: body mass index; WC: waist circumference; CVD: cardio vascular diseases: BCM: body cell mass
- 8. a study on 344 subjects aged between 65 and 99 years in a nursing home in Padua (Italy) where the lowest mortality risk was associated with a BMI of between 23.6 and 29.2 kg/m². However, the association loses force if body cell mass (BCM) was considered in the analysis. With high BCM values, subjects with a low BMI (19.3-23.5 kg/m²), intermediate BMI (23.6 to 29 2 kg/m²) or high BMI (≥ 29.2 kg/m²) had the same probability of surviving. Meta-analysis and pooled estimated It was possible to conduct a meta-analysis using separate data stratified by age, gender, classes of BMI and mortality from three of the studies conducted by Adams (17), Calle (16) and Diehr (15). Through a pooled estimate (12), we obtained a new estimate of the relation between obesity and mortality in older adults simultaneously using all the information achieved from the three studies (Table 4). BMI was stratified into the following classes: ≤ 20, 20-25, 25-30 and >30 kg/m². The mortality rate was highest among malnourished subjects, decreased with increasing BMI but rose again when the values of BMI were over 30 kg/m². The analysis of the data from these three studies, included 58,227 deaths (30,036 deaths among men and 28,191 deaths among women), over the follow- up period which demonstrated a clear a “U” shaped curve association between BMI and mortality. The lowest mortality rate was for 2,108 deaths per 100,000 person-years for men and 1,366 deaths per 100,000 person-years for the women at a BMI of 25-30 and 20-25 kg/m², respectively. These findings indicate that a lower BMI may be more protective against mortality for women rather than men. Table 4 Pooled estimate of mortality rate per 100,000 person-years stratified by gender and classes of BMI BMI Mortality rate 95% CI (kg/m2 ) Men ≤20,0 3500,5 3311,2-3689,9 20-25 2200,3 2156,6-2243,9 25-30 2108,0 2072,9-2143,1 >30 2781,2 2704,8-2857,7 Women ≤20,0 1795,3 1736,2-1854,4 20-25 1366,3 1343,1-1389,4 25-30 1524,2 1490,1-1558,4 >30 1974,9 1910,2-2039,6 Legend: BMI: body mass index; CI: confidence interval Discussion The results of this SR present data that show an increased mortality in obese and older adults. The limitation of BMI to index obesity and the noted protective action of a moderate increase in BMI on mortality have been highlighted. Limitations of BMI as a measure of geriatric adiposity BMI is an epidemiological index that can categorizes a population into underweight (BMI ≤ 18.5 kg/m²), normal weight (BMI between 18.5 and 24.9 kg/m²), overweight (BMI between 25 and 29.9 kg/m²) and obese (BMI ≥ 30 kg/m²) (31) based on validated measures of body composition. BMI is a well-accepted index of body fatness, but it lacks specificity in clinical practice (32). It is significantly correlated with fat mass (r = 0.6-0.7), and with fat-free mass (r = 0.5-0.6) (33, 34), and it has low sensitivity in subjects with increased fat mass (35). Furthermore, the correlation of BMI with the fat mass decreases with age, race, in athletes, in those with pathological conditions and in weight loss (36). Body composition changes affect the application of BMI in the elderly, because the aging process modifies both the numerator (weight) and the denominator (stature). Several studies documented in this review, reported that the well recognized age-related decline in stature induces a false BMI value resulting from an increase of 1.5 kg/m² in men and 2.5 kg/m² in women despite minimal changes in body weight (38). Studies conducted by Wassertheil-Smoller (18), Stevens (14), Diehr (15) and Miller (29) all demonstrated that ranges of BMI from a young adult population are not a suitable health risk reference for an elderly population. There is an increase in mortality with increasing BMI in younger adults, but among the elderly, the relative risk is lower than that of young and middle-aged adults. The literature reviewed in this report confirms that abdominal fatness, even in geriatric age groups, is more strongly linked to morbidity and mortality than peripheral fat deposits (26, 39, 40). Data for waist circumference indicates that it is as effective as BMI as a risk factor, if not more so in assessing abdominal fatness and mortality risk in the elderly obese. In fact, according to the studies of Janssen (26) and Visscher (28), higher BMI values indicated lower mortality risk once the risk attributable to WC was accounted for. BMI indicating overweight or obese individuals is associated with reduced mortality risk when waist circumference is less than 93 cm for men and 79 cm for women (41, 42). This data may be attributed to the consideration that BMI is a reflection of lean mass for individuals with the same WC; whereas, WC is a reflection of fat mass for individuals with the same BMI. Therefore, WC predicts abdominal subcutaneous and visceral fat and the weighted evidence suggest that abdominal fatness is strongly related to morbidity than peripheral fatness, whereas accumulation of fat and lean mass in the arms and legs seems to be protective against cardiovascular risk factors The study of Volpato (30) reaches similar conclusions taking into account a different body composition parameter which is the BCM where, the association between BMI and mortality loses strength, indicating that the BCM can better predict survival independently than BMI values. BMI may remain unchanged despite changes in body composition in old age, while BCM can decrease, although the weight (and thus BMI) remains unchanged. RELATIONSHIP BETWEEN OBESITY AND MORTALITY IN THE ELDERLY The Journal of Nutrition, Health & Aging© Volume 16, Number 1, 2012 96
- 9. Relation between BMI and mortality in elderly The majority of studies reviewed in this report noted an increased risk of mortality in obese older adults with high BMI. This is confirmed primarily by the study that defines obesity based on WC and by the results of the meta-analysis we conducted. The two studies reviewed that arrive at different conclusions have limitations in their designs. The study of Grabowski (24) considered a broad range of BMI values so that the high mortality appears to be associated with BMI ranging from 19.5 to 28.4 kg/m², but thus includes malnourished or obese subjects. Moreover, this study makes no distinction between men and women in the classes of BMI as does the study of Janssen (25). Furthermore, in another study conducted in 2007, the same research group (26) noted that a BMI indicating overweight is associated with a small increased risk of disease, but at the same time it is also associated with a reduction in mortality risk. This confirms once again that the threshold values for classes of BMI cannot be transposed purely and simply on a geriatric age group. Therefore, it is not easy to show a protective effect of obesity in the geriatric age as much as the ineffectiveness of the tools at our disposal (BMI above all) to highlight just a state of obesity. BMI range at lower risk of mortality in elderly Almost all the studies in this SR confirmed that the lowest mortality is correlated with an average BMI of between 23.5 and 27.5 kg/m², higher than that in young and middle-aged adults (3, 43- 46). Also, the pooled estimate confirms that a U- shaped curve continues to describe the relationship between BMI and mortality in old age, but the nadir is shifted toward higher values of BMI (47) because subjects who are susceptible to the effects of excess body fat die before reaching old age (9, 48, 49). Older adults with a high BMI are resistant to the effect of an excess of adiposity (50). On the other hand, a moderately high BMI is a protective factor (increased fat mass and/or lean body mass) against acute events that occur frequently in geriatric age groups (51). Conclusions Obesity is a mortality risk in old age, but with threshold values to be defined taking into account the protective effect that a mild increase of fat mass seems to have against mortality. Clearly, further research is needed to better define the characteristics of obesity in the elderly, to identify the ranges of BMI associated with lower risk of mortality, distinguishing between men and women. It is also important to identify and/or to develop more effective tools in risk assessment related to adiposity excess in geriatric age. Finally, it remains to evaluate the cost/benefit ratio that measures of reduction of body fat have on the quality of life of elderly obese. References 1. Flegal KM, Carroll MD, Odgen CL, Johson CL. Prevalence and trends in obesity among US adults, 1999-2000. JAMA 2002; 288: 1723-7 2. Arterburn DE, Crane PK, Sullivan SD. The coming epidemic of obesity in elderly Americans. J Am Geriatr Soc 2004; 52: 1907-1912 3. Villareal DT, Banks M, Siener C, Sinacore DR, Klein S: Physical frailty and body composition in obese elderly men and women. Obes Res 2004; 12 (6): 913-920. 4. Chumlea WMC, Sun SS: The availability of body composition reference data for the elderly. JNHA 2004; 8(2): 76-78 5. Villareal DT, Apovian CM: Obesity in the older adults: technical review and position statement of the American society for nutrition and NAASO. Obes Res 2005; 13: 1849-1863 6. Moller N, O’Brien P, Nair KS: Disruption of the relationship between fat content and leptin levels with aging in humans. J Clin Endocrinol Metab 1998; 83: 931-4 7. Corrada MM, Hawas CH, Mozaffar F, Paganini-Hill A: Association of body fat index and weight change with all-cause mortality in the elderly. Am J Epidemiol 2006; 163: 938-949 8. Peeters A, Barendregt JJ, Willekens F, Mackenbach JP, Al Mamun A, Boneux L Obesity in adulthood and its consequences for life expectancy: a life-table analysis. Ann Intern Med 2003; 138, 24-32 9. Fontaine KR, Redden DT, Wang C, Westfall AO, Allison DB: Years of life lost due to obesity. JAMA 2003; 289, 187-193 10. Kennedy Rl, Chokkalingham K, Srinivasesn R: Obesity in the elderly: who should we be treating, and why, and how? Curr Opin Clin Nutr Metab Care 2004; 7(1): 3-9 11. Systematic Reviews in Health Care: Meta-analysis in context. Ed. By: M Egger, GD Smith, DG Altman. Second edition, London 2001. BMJ. Pag.: 3-68 12. Friedenreich CM. Methods for pooled analyses of epidemiologic studies Epidemiology. 1993;4(4):295-302 13. Dey DK, Rothenberg E: Body mass index, weight change and mortality in the elderly. A 15y longitudinal population study of 70y olds. Eur J Clin Nutr. 2001; 55: 482-492 14. Stevens J, Cai J: The effect of age on the association between body-mass index and mortality. N Engl J Med 1998; 338: 1-7 15. Diehr P, Bild E: Body mass index and mortality in non-smoking older adults: the cardiovascular health study. Am J Public Health 1998; 88: 623-629 16. Calle E, Thun J: Body mass index and mortality in a prospective cohort of US adults. N Engl J Med 1999; 341: 1097-105 17. Adams KF, Ph. D., Schatzkin A., Harris TB: Overweight, obesity and mortality in a large prospective cohort of persons 50 to 71 years old. N Engl J Med 2006; 355: 763- 78 18. Wassertheil-Smoller S et al: Relation of low body mass to death and stroke in the systolic hypertension in the elderly program. Arch Intern Med. 2000; 160: 494-500 19. Hillier TA, Rizzo JH.: Increased mortality associated with the metabolic syndrome in older women with diabetes. Diabetes Care 2005; 28(9):2258-60 20. Dorn JM, Schisterman EF: Body mass index and mortality in a general population sample of men and women. The Buffalo Health Study. Am J Epidemiol 1997; 146(11) : 919-31 21. Ajani UA, Lotufo PA: Body mass index and mortality among US male physicians. Am Epidemiol 2004; 14(10): 731-739 22. Taylor DH: The effect of middle- and old-age body mass index on short-term mortality in older people. JAGS 2001; 49: 1319-1326 23. Wallhagen MI: New NHLBI clinical guidelines for obesity and overweight will they promote health. Am J Public Health 2000; 90: 340-343 24. Grabowski DC, Ellis JE: High body mass index does not predict mortality in older people: analysis of the longitudinal study of aging. JAGS 2001; 49: 968-979 25. Janssen I. Morbidity and mortality risk associated with an overweight BMI in older men and women. Obesity 2007; 15(7): 1827-40 26. Janssen I, Katzmarzyk PT.: Body mass index is inversely related to mortality in older people after adjustment for waist circumference. JAGS 2005; 53(12):2112-8 27. Harris TB, Visser M, Everhart J, Cauley J, Tylavsky F, Fuerst T, Zamboni M: Waist circumference and sagittal diameter reflect total body fat better than visceral fat in older men and women. The health, aging and body composition study. Ann NY Acad Sci 2000; 904: 462-473 28. Visscher TLS, Seidell JC, Molarius: A comparison of body mass index, waist-hip ratio and waist circumference as predictors of all-cause mortality among the elderly: the Rotterdam study. Int J of Ob 2001; 25: 1730-1735 29. Michelle D. Miller, MNut Diet: Corrected arm muscle area: an independent predictor of long-term mortality in community-dwelling older adults? JAGS 2002; 50: 1272- 1277 30. Volpato S, Romagnoni F: Body mass index, body cell mass, and 4-year all-cause mortality risk in older nursing home residents. JAGS 2004; 52: 886-891 31. WHO: Preventing anda managing the global epidemic of obesity: report of the World Health Organisation Consultation of Obessity. WHO: Geneva, June 1997 32. Deurenberg P, Van Der Kooy K, Hulshof T, Evers P: Body mass index as a measure of body fatness in the elderly. Eur J Clin Nutr 1989; 43: 231-236 33. Gallagher D, Visser M, Sepúlveda D, Pierson RN, Harris T, Heymsfield SB: How JNHA: GERIATRIC SCIENCE The Journal of Nutrition, Health & Aging© Volume 16, Number 1, 2012 97
- 10. useful is body mass index for comparison of body fatness across age, sex and ethnic groups ? Am J Epidemiol. 1996 Feb 1;143(3):228-39 34. Baumgartner RN, Stauber PM, McHugh D, Koehler KM, Garry PJ: Cross-sectional age differences in body composition in persons 60+ years of age. J Gerontol 1995; 70: 1025-103 35. Smalley KJ, Knerr AN, Kendrick ZV, Colliver JA, Owen OE.: Reassessment of body mass indices. Am J Clin Nutr. 1990 Sep;52(3):405-8 36. Prentice AM, Jebb SA: Beyond body mass index. Obes Rev 2001; 2: 141-147 37. de Groot CP, Enzi G, Matthys O, Roszkiwski W, Scholl M: Ten-years changes in anthropometric characteristics of elderly Europeans. J Nutr Health Aging 2002; 6: 4- 8 38. Sorkin JD, Muller DC, Andres R: Longitudinal Change in height of men and women: implications for interpretation of the body mass index. The Baltimore Longitdinal Study of Aging. Am J Epidemiol 1999; 150: 969-977 39. Wong S, Janssen I, Ross R.: Abdominal adipose tissue distribution and metabolic risk. Sports Med. 2003;33(10):709-26 40. Ferreira I, Snijder MB, Twisk JW, van Mechelen W, Kemper HC, Seidell JC, Stehouwer CD.: Central fat mass versus peripheral fat and lean mass: opposite (averse versus favorable) associations with arterial stiffness? The Amsterdam Growth and Health Longitudinal Study. J Clin Endocrinol Metab. 2004 Jun;89(6):2632-9 41. National Institutes of Health (NIH); National Heart, Lung, and Blood Pressure (NHLB); North American Association for the Study of Obesity (NAASO. The practical guide: identification, evaluation, and treatment of overweight and obesity in adults, NIH Publication No 00-4084 National Institutes of Health: Rockeville, MD; 2000 42. Zamboni M, Mazzali G: Health consequences of obesity in the elderly: a review of four unresolved question. Int J Obes 2005; 29(9): 1011-29 43. Heiat A, Vaccarino V: An evidence-based assessment of federal guidelines for overweight and obesity as they apply to elderly persons. Arch Intern Med. 2001; 161: 1194-1203 44. Harris T, Cook EF, Garrison R, Higgins M, Kannel W, Goldman L: Body mass index and mortality among older persons. The Framingham Heart Study. JAMA 1988; 259: 1520-4 45. Cornoni-Huntley JC, Harris TB, Everett DF: An overview of body weight of older persons, including the impact on mortality. The National Health and Nutrition Examination Survey I-Epidemiologic Follow-up Study. J Clin EpidemioI 1991; 44: 743-53 46. Allison DB, Gallagher D, Heo M, Pi-Sunyer FX. Heymsfield SB. Body mass index and all-cause mortality among people age 70 and over: the Longitudinal Study of Aging. Int J Obes Relat Metab Disord 1997; 21: 424-31 47. Andres R, Elahi D, Tobin JD, Muller DC, Brant L. Impact of age on weight goals. Ann Intem Med 1985; 103: 1030-1033 48. Rossner S.: Obesity in the elderly – A future matter of concern? Obes Rev 2001; 2: 183-188 49. Inelmen EM, Sergi G, Coin A, Miotto F, Peruzza S, Enzi G: Can obesity be a risk factor in elderly people? Obes Rev 2003; 4: 147-155. 50. Janssen I, Mark AE. Elevated body mass index and mortality risk in the elderly. Obes Rev. 2007; 8(1): 41-59 51. Galanos AN, Pieper CF: Nutrition and function: is there a relation between body mass index and functional capabilities of community-dwelling elderly? JAGS 1994; 42: 368-373 RELATIONSHIP BETWEEN OBESITY AND MORTALITY IN THE ELDERLY The Journal of Nutrition, Health & Aging© Volume 16, Number 1, 2012 98
- 11. Reproduced with permission of the copyright owner. Further reproduction prohibited without permission.