SlideShare a Scribd company logo
1 of 2
Download to read offline
© 2018 Jones Lang LaSalle IP, Inc. All rights reserved. All information contained herein is from sources deemed reliable; however, no representation or warranty is made to the accuracy thereof.
Q1 2018
Tampa Bay
Office Insight
As a new year begins, it appears Tampa Bay is positioned to see a shift in how
it is defined as an office market. The disparity between high class office
demand and the availability of space has had historical implications on both
the ability for rental rates to grow and the options firms have when looking to
relocate or expand. Now, some of that can be alleviated as MetWest Three
breaks ground in Westshore, bringing 90,000 square feet of available space to
market, and both Strategic Property Partners and Feldman Equities make
progress on their ambitious developments in downtown Tampa.
The recipe is there, as existing building owners are already seeing historically
high rents of $33.00 - $34.00 gross Downtown and $36.00-$37.00 gross in
Westshore, with the latest building fetching a 10 percent premium and
breaking $40.00 in asking rent. On top of that, the first quarter of 2018 saw the
highest net absorption in the last seven quarters, with large users such as
EmCare, Surgery Partners, HDR Engineering, ER Squibb & Sons, and
Windhaven Managers moving into their new spaces in Gateway and
Westshore, and contributing to the nearly 250,000 s.f. of absorption the region
saw to start the year.
Outlook
As the culmination of population, job, and office demand growth comes to a
head in Tampa, 2018 could be the year where we see dirt moving on office
projects, especially in Downtown Tampa and Westshore. Increasing asking
rates and strong absorption are validating the proposals currently in the
pipeline, at a time where Tampa continues to shine as a great place to do
business in the southeast. Regardless of whether or not development springs
forward this year, we will continue to see increasing asking rates across the
region, especially in class A product, and falling concessions as leverage
remains in the hands of the Landlords.
Fundamentals Forecast
YTD net absorption 246,735 s.f. ▲
Under construction 416,554 s.f. ▲
Total vacancy 11.4% ▼
Average asking rent (gross) $25.28 p.s.f. ▲
Concessions Falling ▼
0
500,000
1,000,000
2015 2016 2017 Q1 2018
Supply and demand (s.f.) Net absorption
Deliveries
2018 is poised to be the year Tampa Bay’s pipeline
flows rather than trickles
14.6% 13.4% 12.2% 11.4%
2015 2016 2017 Q1 2018
Total vacancy
$0.00
$10.00
$20.00
$30.00
$40.00
2015 2016 2017 Q1 2018
Average asking rents ($/s.f.) Class A
Class B
For more information, contact: Kyle Koller | kyle.koller@am.jll.com
• The market continues to tighten as vacancy rates remain on the decline
– at a faster pace in class B product, but with class A vacancy currently
nearly half that of class B – at 8.3%.
• The groundbreaking of Westshore’s newest office building has broken
the $40.00 gross asking rate ceiling for the region.
• As developers continue to advance their proposals for downtown and
the suburbs, 2018 could see the start of multiple new office projects.
© 2018 Jones Lang LaSalle IP, Inc. All rights reserved. All information contained herein is from sources deemed reliable; however, no representation or warranty is made to the accuracy thereof.
Q1 2018
Tampa Bay
Office Statistics
For more information, contact: Kyle Koller | kyle.koller@am.jll.com
Class
Inventory
(s.f.)
YTD total net
absorption (s.f.)
YTD total net
absorption
(% of stock)
Direct
vacancy
(%)
Total
vacancy
(%)
Average
asking rent
($ p.s.f.)
YTD
Completions
(s.f.)
Under
Development
(s.f.)
Gateway/Bayside Totals 3,653,043 187,199 5.1% 12.1% 12.3% $22.30 0 0
I-75/I-4 Corridor Totals 6,332,171 -65,659 -1.0% 12.6% 12.7% $20.50 0 0
Northwest Totals 2,663,377 9,273 0.3% 9.6% 9.7% $20.94 0 148,800
Pinellas Outlying Totals 2,234,021 -28,856 -1.3% 26.9% 26.9% $18.44 0 0
St. Pete CBD Totals 2,168,064 3,483 0.2% 7.6% 7.7% $27.68 0 0
Tampa CBD Totals 6,024,782 56,002 0.9% 10.2% 10.5% $28.19 0 0
Westshore Totals 11,818,161 115,392 1.0% 8.2% 9.0% $30.37 0 267,754
Tampa Bay Totals 34,893,619 276,834 0.8% 11.0% 11.4% $25.28 0 416,554
Gateway/Bayside A 2,469,633 70,972 2.9% 5.5% 5.8% $23.87 0 0
I-75/I-4 Corridor A 3,280,175 -64,600 -2.0% 9.2% 9.3% $25.69 0 0
Northwest A 1,012,125 -2,243 -0.2% 2.1% 2.1% $26.85 0 148,800
Pinellas Outlying A 1,037,202 -7,010 -0.7% 20.3% 20.3% $21.06 0 0
St. Pete CBD A 1,633,077 -380 0.0% 6.8% 7.0% $28.82 0 0
Tampa CBD A 4,572,871 52,189 1.1% 10.7% 10.9% $29.50 0 0
Westshore A 7,409,363 75,169 1.0% 6.1% 6.7% $34.16 0 267,754
Tampa Bay A 21,414,446 124,097 0.6% 8.0% 8.3% $29.34 0 416,554
Gateway/Bayside B 1,183,410 116,227 9.8% 25.8% 25.8% $20.05 0 0
I-75/I-4 Corridor B 3,051,996 -1,059 0.0% 16.4% 16.4% $18.44 0 0
Northwest B 1,651,252 11,516 0.7% 14.2% 14.4% $20.34 0 0
Pinellas Outlying B 1,196,819 -21,846 -1.8% 32.7% 32.7% $16.96 0 0
St. Pete CBD B 534,987 3,863 0.7% 9.8% 9.8% $22.85 0 0
Tampa CBD B 1,451,911 3,813 0.3% 8.9% 9.1% $22.80 0 0
Westshore B 4,408,798 40,223 0.9% 11.7% 13.0% $25.54 0 0
Tampa Bay B 13,479,173 152,737 1.1% 15.8% 16.3% $20.99 0 0

More Related Content

What's hot

JLL Detroit Office Insight & Statistics - Q1 2018
JLL Detroit Office Insight & Statistics - Q1 2018JLL Detroit Office Insight & Statistics - Q1 2018
JLL Detroit Office Insight & Statistics - Q1 2018Harrison West
 
JLL Pittsburgh Office Insight & Statistics - Q2 2019
JLL Pittsburgh Office Insight & Statistics - Q2 2019JLL Pittsburgh Office Insight & Statistics - Q2 2019
JLL Pittsburgh Office Insight & Statistics - Q2 2019Tobiah Bilski
 
JLL Grand Rapids Office Insight & Statistics - Q1 2019
JLL Grand Rapids Office Insight & Statistics - Q1 2019JLL Grand Rapids Office Insight & Statistics - Q1 2019
JLL Grand Rapids Office Insight & Statistics - Q1 2019Harrison West
 
JLL Cleveland Office Outlook: Q3 2017
JLL Cleveland Office Outlook: Q3 2017JLL Cleveland Office Outlook: Q3 2017
JLL Cleveland Office Outlook: Q3 2017Andrew Batson
 
JLL Pittsburgh Office Insight & Statistics - Q3 2018
JLL Pittsburgh Office Insight & Statistics - Q3 2018JLL Pittsburgh Office Insight & Statistics - Q3 2018
JLL Pittsburgh Office Insight & Statistics - Q3 2018Tobiah Bilski
 
JLL Cleveland Office Outlook: Q2 2018
JLL Cleveland Office Outlook: Q2 2018JLL Cleveland Office Outlook: Q2 2018
JLL Cleveland Office Outlook: Q2 2018Andrew Batson
 
JLL Pittsburgh Office Insight & Statistics - Q2 2018
JLL Pittsburgh Office Insight & Statistics - Q2 2018 JLL Pittsburgh Office Insight & Statistics - Q2 2018
JLL Pittsburgh Office Insight & Statistics - Q2 2018 Tobiah Bilski
 
JLL Pittsburgh Office Insight & Statistics - Q4 2019
JLL Pittsburgh Office Insight & Statistics - Q4 2019JLL Pittsburgh Office Insight & Statistics - Q4 2019
JLL Pittsburgh Office Insight & Statistics - Q4 2019Tobiah Bilski
 
JLL Detroit Office Insight & Statistics – Q2 2016
JLL Detroit Office Insight & Statistics – Q2 2016JLL Detroit Office Insight & Statistics – Q2 2016
JLL Detroit Office Insight & Statistics – Q2 2016Aaron Moore
 
JLL Cleveland Office Outlook: Q2 2018
JLL Cleveland Office Outlook: Q2 2018JLL Cleveland Office Outlook: Q2 2018
JLL Cleveland Office Outlook: Q2 2018Andrew Batson
 
JLL Detroit Office Insight & Statistics - Q2 2017
JLL Detroit Office Insight & Statistics - Q2 2017JLL Detroit Office Insight & Statistics - Q2 2017
JLL Detroit Office Insight & Statistics - Q2 2017Harrison West
 
National Dashboard Report | Office - Metro Areas with Population < 1M
National Dashboard Report | Office - Metro Areas with Population < 1MNational Dashboard Report | Office - Metro Areas with Population < 1M
National Dashboard Report | Office - Metro Areas with Population < 1MDarren Shaw, SIOR
 
JLL Detroit Office Insight & Statistics - Q4 2018
JLL Detroit Office Insight & Statistics - Q4 2018JLL Detroit Office Insight & Statistics - Q4 2018
JLL Detroit Office Insight & Statistics - Q4 2018Harrison West
 
St. Louis Office Outlook Q3 2016
St. Louis Office Outlook Q3 2016St. Louis Office Outlook Q3 2016
St. Louis Office Outlook Q3 2016Blaise Tomazic
 
Industrial Insight and Statistics: Dallas-Fort Worth (2019-Q2)
Industrial Insight and Statistics: Dallas-Fort Worth (2019-Q2)Industrial Insight and Statistics: Dallas-Fort Worth (2019-Q2)
Industrial Insight and Statistics: Dallas-Fort Worth (2019-Q2)Nick Thomas
 
JLL Pittsburgh Office Insight & Statistics - Q4 2017
JLL Pittsburgh Office Insight & Statistics - Q4 2017JLL Pittsburgh Office Insight & Statistics - Q4 2017
JLL Pittsburgh Office Insight & Statistics - Q4 2017Tobiah Bilski
 
JLL Detroit Office Insight & Statistics - Q1 2019
JLL Detroit Office Insight & Statistics - Q1 2019JLL Detroit Office Insight & Statistics - Q1 2019
JLL Detroit Office Insight & Statistics - Q1 2019Harrison West
 
JLL Detroit Office Insight & Statistics - Q3 2017
JLL Detroit Office Insight & Statistics - Q3 2017JLL Detroit Office Insight & Statistics - Q3 2017
JLL Detroit Office Insight & Statistics - Q3 2017Harrison West
 
JLL Pittsburgh Office Insight & Statistics - Q1 2019
JLL Pittsburgh Office Insight & Statistics - Q1 2019JLL Pittsburgh Office Insight & Statistics - Q1 2019
JLL Pittsburgh Office Insight & Statistics - Q1 2019Tobiah Bilski
 

What's hot (20)

JLL Detroit Office Insight & Statistics - Q1 2018
JLL Detroit Office Insight & Statistics - Q1 2018JLL Detroit Office Insight & Statistics - Q1 2018
JLL Detroit Office Insight & Statistics - Q1 2018
 
JLL Pittsburgh Office Insight & Statistics - Q2 2019
JLL Pittsburgh Office Insight & Statistics - Q2 2019JLL Pittsburgh Office Insight & Statistics - Q2 2019
JLL Pittsburgh Office Insight & Statistics - Q2 2019
 
JLL Grand Rapids Office Insight & Statistics - Q1 2019
JLL Grand Rapids Office Insight & Statistics - Q1 2019JLL Grand Rapids Office Insight & Statistics - Q1 2019
JLL Grand Rapids Office Insight & Statistics - Q1 2019
 
JLL Cleveland Office Outlook: Q3 2017
JLL Cleveland Office Outlook: Q3 2017JLL Cleveland Office Outlook: Q3 2017
JLL Cleveland Office Outlook: Q3 2017
 
JLL Pittsburgh Office Insight & Statistics - Q3 2018
JLL Pittsburgh Office Insight & Statistics - Q3 2018JLL Pittsburgh Office Insight & Statistics - Q3 2018
JLL Pittsburgh Office Insight & Statistics - Q3 2018
 
JLL Cleveland Office Outlook: Q2 2018
JLL Cleveland Office Outlook: Q2 2018JLL Cleveland Office Outlook: Q2 2018
JLL Cleveland Office Outlook: Q2 2018
 
JLL Pittsburgh Office Insight & Statistics - Q2 2018
JLL Pittsburgh Office Insight & Statistics - Q2 2018 JLL Pittsburgh Office Insight & Statistics - Q2 2018
JLL Pittsburgh Office Insight & Statistics - Q2 2018
 
JLL Pittsburgh Office Insight & Statistics - Q4 2019
JLL Pittsburgh Office Insight & Statistics - Q4 2019JLL Pittsburgh Office Insight & Statistics - Q4 2019
JLL Pittsburgh Office Insight & Statistics - Q4 2019
 
Q1 2018 | Woodlands Office | Submarket Snapshot
Q1 2018 | Woodlands Office | Submarket SnapshotQ1 2018 | Woodlands Office | Submarket Snapshot
Q1 2018 | Woodlands Office | Submarket Snapshot
 
JLL Detroit Office Insight & Statistics – Q2 2016
JLL Detroit Office Insight & Statistics – Q2 2016JLL Detroit Office Insight & Statistics – Q2 2016
JLL Detroit Office Insight & Statistics – Q2 2016
 
JLL Cleveland Office Outlook: Q2 2018
JLL Cleveland Office Outlook: Q2 2018JLL Cleveland Office Outlook: Q2 2018
JLL Cleveland Office Outlook: Q2 2018
 
JLL Detroit Office Insight & Statistics - Q2 2017
JLL Detroit Office Insight & Statistics - Q2 2017JLL Detroit Office Insight & Statistics - Q2 2017
JLL Detroit Office Insight & Statistics - Q2 2017
 
National Dashboard Report | Office - Metro Areas with Population < 1M
National Dashboard Report | Office - Metro Areas with Population < 1MNational Dashboard Report | Office - Metro Areas with Population < 1M
National Dashboard Report | Office - Metro Areas with Population < 1M
 
JLL Detroit Office Insight & Statistics - Q4 2018
JLL Detroit Office Insight & Statistics - Q4 2018JLL Detroit Office Insight & Statistics - Q4 2018
JLL Detroit Office Insight & Statistics - Q4 2018
 
St. Louis Office Outlook Q3 2016
St. Louis Office Outlook Q3 2016St. Louis Office Outlook Q3 2016
St. Louis Office Outlook Q3 2016
 
Industrial Insight and Statistics: Dallas-Fort Worth (2019-Q2)
Industrial Insight and Statistics: Dallas-Fort Worth (2019-Q2)Industrial Insight and Statistics: Dallas-Fort Worth (2019-Q2)
Industrial Insight and Statistics: Dallas-Fort Worth (2019-Q2)
 
JLL Pittsburgh Office Insight & Statistics - Q4 2017
JLL Pittsburgh Office Insight & Statistics - Q4 2017JLL Pittsburgh Office Insight & Statistics - Q4 2017
JLL Pittsburgh Office Insight & Statistics - Q4 2017
 
JLL Detroit Office Insight & Statistics - Q1 2019
JLL Detroit Office Insight & Statistics - Q1 2019JLL Detroit Office Insight & Statistics - Q1 2019
JLL Detroit Office Insight & Statistics - Q1 2019
 
JLL Detroit Office Insight & Statistics - Q3 2017
JLL Detroit Office Insight & Statistics - Q3 2017JLL Detroit Office Insight & Statistics - Q3 2017
JLL Detroit Office Insight & Statistics - Q3 2017
 
JLL Pittsburgh Office Insight & Statistics - Q1 2019
JLL Pittsburgh Office Insight & Statistics - Q1 2019JLL Pittsburgh Office Insight & Statistics - Q1 2019
JLL Pittsburgh Office Insight & Statistics - Q1 2019
 

Similar to Tampa Bay 2018 Q1 Office Outlook

JLL - Tampa Bay 2018 Q1 Industrial Outlook
JLL - Tampa Bay 2018 Q1 Industrial OutlookJLL - Tampa Bay 2018 Q1 Industrial Outlook
JLL - Tampa Bay 2018 Q1 Industrial OutlookKyle Koller
 
JLL Louisville Office Outlook - Q2 2018
JLL Louisville Office Outlook - Q2 2018JLL Louisville Office Outlook - Q2 2018
JLL Louisville Office Outlook - Q2 2018Alex Westcott
 
JLL - Tampa Bay 2018 Q2 Industrial Outlook
JLL - Tampa Bay 2018 Q2 Industrial OutlookJLL - Tampa Bay 2018 Q2 Industrial Outlook
JLL - Tampa Bay 2018 Q2 Industrial OutlookKyle Koller
 
Broward County Office Outlook - Q4 2018
Broward County Office Outlook - Q4 2018Broward County Office Outlook - Q4 2018
Broward County Office Outlook - Q4 2018JLL Florida
 
JLL Grand Rapids Office Insight & Statistics - Q3 2018
JLL Grand Rapids Office Insight & Statistics - Q3 2018JLL Grand Rapids Office Insight & Statistics - Q3 2018
JLL Grand Rapids Office Insight & Statistics - Q3 2018Harrison West
 
JLL Pittsburgh Office Insight & Statistics - Q1 2020
JLL Pittsburgh Office Insight & Statistics - Q1 2020JLL Pittsburgh Office Insight & Statistics - Q1 2020
JLL Pittsburgh Office Insight & Statistics - Q1 2020Tobiah Bilski
 
Pittsburgh Office Insight & Stats Q4 2021
Pittsburgh Office Insight & Stats Q4 2021Pittsburgh Office Insight & Stats Q4 2021
Pittsburgh Office Insight & Stats Q4 2021Tobiah Bilski
 
JLL Columbus Office Outlook: Q2 2016
JLL Columbus Office Outlook: Q2 2016JLL Columbus Office Outlook: Q2 2016
JLL Columbus Office Outlook: Q2 2016Peter McStravick
 
JLL West Michigan Industrial Insight & Statistics - Q1 2020
JLL West Michigan Industrial Insight & Statistics - Q1 2020JLL West Michigan Industrial Insight & Statistics - Q1 2020
JLL West Michigan Industrial Insight & Statistics - Q1 2020Harrison West
 
JLL Cleveland Office Outlook: Q1 2018
JLL Cleveland Office Outlook: Q1 2018JLL Cleveland Office Outlook: Q1 2018
JLL Cleveland Office Outlook: Q1 2018Andrew Batson
 
JLL Cleveland Office Outlook: Q1 2018
JLL Cleveland Office Outlook: Q1 2018JLL Cleveland Office Outlook: Q1 2018
JLL Cleveland Office Outlook: Q1 2018Andrew Batson
 
JLL Pittsburgh Industrial Insight & Statistics - Q1 2020
JLL Pittsburgh Industrial Insight & Statistics - Q1 2020JLL Pittsburgh Industrial Insight & Statistics - Q1 2020
JLL Pittsburgh Industrial Insight & Statistics - Q1 2020Tobiah Bilski
 
JLL Cleveland Office Outlook: Q4 2017
JLL Cleveland Office Outlook: Q4 2017JLL Cleveland Office Outlook: Q4 2017
JLL Cleveland Office Outlook: Q4 2017Andrew Batson
 
Atlanta Office Sector Report (Q2 2016)
Atlanta Office Sector Report (Q2 2016)Atlanta Office Sector Report (Q2 2016)
Atlanta Office Sector Report (Q2 2016)Savills Studley
 
JLL Columbus Industrial Outlook - Q4 2020
JLL Columbus Industrial Outlook - Q4 2020JLL Columbus Industrial Outlook - Q4 2020
JLL Columbus Industrial Outlook - Q4 2020Emma Gresky
 
JLL Cleveland Industrial Outlook: Q3 2018
JLL Cleveland Industrial Outlook: Q3 2018JLL Cleveland Industrial Outlook: Q3 2018
JLL Cleveland Industrial Outlook: Q3 2018Andrew Batson
 
Q3 2015 Industrial Brief
Q3 2015 Industrial BriefQ3 2015 Industrial Brief
Q3 2015 Industrial BriefRyan Searle
 
JLL Cleveland Office Outlook: Q1 2018
JLL Cleveland Office Outlook: Q1 2018JLL Cleveland Office Outlook: Q1 2018
JLL Cleveland Office Outlook: Q1 2018Andrew Batson
 
Pittsburgh Office Insight & Stats Q1 2022
Pittsburgh Office Insight & Stats Q1 2022Pittsburgh Office Insight & Stats Q1 2022
Pittsburgh Office Insight & Stats Q1 2022Tobiah Bilski
 
JLL Pittsburgh Office Insight & Statistics - Q3 2019
 JLL Pittsburgh Office Insight & Statistics - Q3 2019 JLL Pittsburgh Office Insight & Statistics - Q3 2019
JLL Pittsburgh Office Insight & Statistics - Q3 2019Tobiah Bilski
 

Similar to Tampa Bay 2018 Q1 Office Outlook (20)

JLL - Tampa Bay 2018 Q1 Industrial Outlook
JLL - Tampa Bay 2018 Q1 Industrial OutlookJLL - Tampa Bay 2018 Q1 Industrial Outlook
JLL - Tampa Bay 2018 Q1 Industrial Outlook
 
JLL Louisville Office Outlook - Q2 2018
JLL Louisville Office Outlook - Q2 2018JLL Louisville Office Outlook - Q2 2018
JLL Louisville Office Outlook - Q2 2018
 
JLL - Tampa Bay 2018 Q2 Industrial Outlook
JLL - Tampa Bay 2018 Q2 Industrial OutlookJLL - Tampa Bay 2018 Q2 Industrial Outlook
JLL - Tampa Bay 2018 Q2 Industrial Outlook
 
Broward County Office Outlook - Q4 2018
Broward County Office Outlook - Q4 2018Broward County Office Outlook - Q4 2018
Broward County Office Outlook - Q4 2018
 
JLL Grand Rapids Office Insight & Statistics - Q3 2018
JLL Grand Rapids Office Insight & Statistics - Q3 2018JLL Grand Rapids Office Insight & Statistics - Q3 2018
JLL Grand Rapids Office Insight & Statistics - Q3 2018
 
JLL Pittsburgh Office Insight & Statistics - Q1 2020
JLL Pittsburgh Office Insight & Statistics - Q1 2020JLL Pittsburgh Office Insight & Statistics - Q1 2020
JLL Pittsburgh Office Insight & Statistics - Q1 2020
 
Pittsburgh Office Insight & Stats Q4 2021
Pittsburgh Office Insight & Stats Q4 2021Pittsburgh Office Insight & Stats Q4 2021
Pittsburgh Office Insight & Stats Q4 2021
 
JLL Columbus Office Outlook: Q2 2016
JLL Columbus Office Outlook: Q2 2016JLL Columbus Office Outlook: Q2 2016
JLL Columbus Office Outlook: Q2 2016
 
JLL West Michigan Industrial Insight & Statistics - Q1 2020
JLL West Michigan Industrial Insight & Statistics - Q1 2020JLL West Michigan Industrial Insight & Statistics - Q1 2020
JLL West Michigan Industrial Insight & Statistics - Q1 2020
 
JLL Cleveland Office Outlook: Q1 2018
JLL Cleveland Office Outlook: Q1 2018JLL Cleveland Office Outlook: Q1 2018
JLL Cleveland Office Outlook: Q1 2018
 
JLL Cleveland Office Outlook: Q1 2018
JLL Cleveland Office Outlook: Q1 2018JLL Cleveland Office Outlook: Q1 2018
JLL Cleveland Office Outlook: Q1 2018
 
JLL Pittsburgh Industrial Insight & Statistics - Q1 2020
JLL Pittsburgh Industrial Insight & Statistics - Q1 2020JLL Pittsburgh Industrial Insight & Statistics - Q1 2020
JLL Pittsburgh Industrial Insight & Statistics - Q1 2020
 
JLL Cleveland Office Outlook: Q4 2017
JLL Cleveland Office Outlook: Q4 2017JLL Cleveland Office Outlook: Q4 2017
JLL Cleveland Office Outlook: Q4 2017
 
Atlanta Office Sector Report (Q2 2016)
Atlanta Office Sector Report (Q2 2016)Atlanta Office Sector Report (Q2 2016)
Atlanta Office Sector Report (Q2 2016)
 
JLL Columbus Industrial Outlook - Q4 2020
JLL Columbus Industrial Outlook - Q4 2020JLL Columbus Industrial Outlook - Q4 2020
JLL Columbus Industrial Outlook - Q4 2020
 
JLL Cleveland Industrial Outlook: Q3 2018
JLL Cleveland Industrial Outlook: Q3 2018JLL Cleveland Industrial Outlook: Q3 2018
JLL Cleveland Industrial Outlook: Q3 2018
 
Q3 2015 Industrial Brief
Q3 2015 Industrial BriefQ3 2015 Industrial Brief
Q3 2015 Industrial Brief
 
JLL Cleveland Office Outlook: Q1 2018
JLL Cleveland Office Outlook: Q1 2018JLL Cleveland Office Outlook: Q1 2018
JLL Cleveland Office Outlook: Q1 2018
 
Pittsburgh Office Insight & Stats Q1 2022
Pittsburgh Office Insight & Stats Q1 2022Pittsburgh Office Insight & Stats Q1 2022
Pittsburgh Office Insight & Stats Q1 2022
 
JLL Pittsburgh Office Insight & Statistics - Q3 2019
 JLL Pittsburgh Office Insight & Statistics - Q3 2019 JLL Pittsburgh Office Insight & Statistics - Q3 2019
JLL Pittsburgh Office Insight & Statistics - Q3 2019
 

More from Kyle Koller

Tampa snapshot 11-15-2019
Tampa snapshot 11-15-2019Tampa snapshot 11-15-2019
Tampa snapshot 11-15-2019Kyle Koller
 
Milwaukee Snapshot - March 2017
Milwaukee Snapshot - March 2017Milwaukee Snapshot - March 2017
Milwaukee Snapshot - March 2017Kyle Koller
 
Milwaukee Chart of the Week October 24th, 2016
Milwaukee Chart of the Week October 24th, 2016Milwaukee Chart of the Week October 24th, 2016
Milwaukee Chart of the Week October 24th, 2016Kyle Koller
 
Milwaukee Chart of the Week August 29th, 2016
Milwaukee Chart of the Week August 29th, 2016Milwaukee Chart of the Week August 29th, 2016
Milwaukee Chart of the Week August 29th, 2016Kyle Koller
 
Milwaukee Chart of the Week August 15th, 2016
Milwaukee Chart of the Week August 15th, 2016Milwaukee Chart of the Week August 15th, 2016
Milwaukee Chart of the Week August 15th, 2016Kyle Koller
 
Milwaukee Chart of the Week March 7th, 2016
Milwaukee Chart of the Week March 7th, 2016Milwaukee Chart of the Week March 7th, 2016
Milwaukee Chart of the Week March 7th, 2016Kyle Koller
 

More from Kyle Koller (6)

Tampa snapshot 11-15-2019
Tampa snapshot 11-15-2019Tampa snapshot 11-15-2019
Tampa snapshot 11-15-2019
 
Milwaukee Snapshot - March 2017
Milwaukee Snapshot - March 2017Milwaukee Snapshot - March 2017
Milwaukee Snapshot - March 2017
 
Milwaukee Chart of the Week October 24th, 2016
Milwaukee Chart of the Week October 24th, 2016Milwaukee Chart of the Week October 24th, 2016
Milwaukee Chart of the Week October 24th, 2016
 
Milwaukee Chart of the Week August 29th, 2016
Milwaukee Chart of the Week August 29th, 2016Milwaukee Chart of the Week August 29th, 2016
Milwaukee Chart of the Week August 29th, 2016
 
Milwaukee Chart of the Week August 15th, 2016
Milwaukee Chart of the Week August 15th, 2016Milwaukee Chart of the Week August 15th, 2016
Milwaukee Chart of the Week August 15th, 2016
 
Milwaukee Chart of the Week March 7th, 2016
Milwaukee Chart of the Week March 7th, 2016Milwaukee Chart of the Week March 7th, 2016
Milwaukee Chart of the Week March 7th, 2016
 

Recently uploaded

Call Girls In Laxmi Nagar Delhi +91-8447779280! !Best Woman Seeking Man Escor...
Call Girls In Laxmi Nagar Delhi +91-8447779280! !Best Woman Seeking Man Escor...Call Girls In Laxmi Nagar Delhi +91-8447779280! !Best Woman Seeking Man Escor...
Call Girls In Laxmi Nagar Delhi +91-8447779280! !Best Woman Seeking Man Escor...asmaqueen5
 
Nanke Area Estate commercial ( Dir. Kat Kuo)
Nanke Area Estate commercial ( Dir. Kat Kuo)Nanke Area Estate commercial ( Dir. Kat Kuo)
Nanke Area Estate commercial ( Dir. Kat Kuo)jessica288382
 
call girls in ganesh nagar Delhi 8264348440 ✅ call girls ❤️
call girls in ganesh nagar Delhi 8264348440 ✅ call girls ❤️call girls in ganesh nagar Delhi 8264348440 ✅ call girls ❤️
call girls in ganesh nagar Delhi 8264348440 ✅ call girls ❤️soniya singh
 
call girls in lajapat nagar 9811711561/..
call girls in lajapat nagar 9811711561/..call girls in lajapat nagar 9811711561/..
call girls in lajapat nagar 9811711561/..vikas rana
 
3D Architectural Rendering Company by Panoram CGI
3D Architectural Rendering Company by Panoram CGI3D Architectural Rendering Company by Panoram CGI
3D Architectural Rendering Company by Panoram CGIPanoram CGI
 
Sankla East World Hadapsar Pune E-Brochure.pdf
Sankla East World Hadapsar Pune  E-Brochure.pdfSankla East World Hadapsar Pune  E-Brochure.pdf
Sankla East World Hadapsar Pune E-Brochure.pdfManishSaxena95
 
Majestique Viman Nagar Pune Brochure.pdf
Majestique Viman Nagar Pune Brochure.pdfMajestique Viman Nagar Pune Brochure.pdf
Majestique Viman Nagar Pune Brochure.pdfBabyrudram
 
Aparna Greenscapes Kompally Hyderabad E - Brochure.pdf
Aparna Greenscapes Kompally Hyderabad E - Brochure.pdfAparna Greenscapes Kompally Hyderabad E - Brochure.pdf
Aparna Greenscapes Kompally Hyderabad E - Brochure.pdffaheemali990101
 
FULL ENJOY 🔝 8264348440 🔝 Call Girls in DLF phase 3 | Gurgaon
FULL ENJOY 🔝 8264348440 🔝 Call Girls in DLF phase 3 | GurgaonFULL ENJOY 🔝 8264348440 🔝 Call Girls in DLF phase 3 | Gurgaon
FULL ENJOY 🔝 8264348440 🔝 Call Girls in DLF phase 3 | Gurgaonsoniya singh
 
Call Girls in laxmi Nagar Delhi 💯Call Us 🔝 9582086666🔝 South Delhi Escorts Se...
Call Girls in laxmi Nagar Delhi 💯Call Us 🔝 9582086666🔝 South Delhi Escorts Se...Call Girls in laxmi Nagar Delhi 💯Call Us 🔝 9582086666🔝 South Delhi Escorts Se...
Call Girls in laxmi Nagar Delhi 💯Call Us 🔝 9582086666🔝 South Delhi Escorts Se...delhimodel235
 
Call Girls in Noida Sector 13 Noida 💯Call Us 🔝 9582086666 🔝 South Delhi Escor...
Call Girls in Noida Sector 13 Noida 💯Call Us 🔝 9582086666 🔝 South Delhi Escor...Call Girls in Noida Sector 13 Noida 💯Call Us 🔝 9582086666 🔝 South Delhi Escor...
Call Girls in Noida Sector 13 Noida 💯Call Us 🔝 9582086666 🔝 South Delhi Escor...delhimodel235
 
Premium Villa Projects in Sarjapur Road Bengaluru
Premium Villa Projects in Sarjapur Road BengaluruPremium Villa Projects in Sarjapur Road Bengaluru
Premium Villa Projects in Sarjapur Road BengaluruShivaSeo3
 
:/Call Girls In Saidulajab Delhi ➥9990211544 High profile Riya Escorts In 24/...
:/Call Girls In Saidulajab Delhi ➥9990211544 High profile Riya Escorts In 24/...:/Call Girls In Saidulajab Delhi ➥9990211544 High profile Riya Escorts In 24/...
:/Call Girls In Saidulajab Delhi ➥9990211544 High profile Riya Escorts In 24/...lizamodels9
 
Kohinoor Flats In Hinjewadi Phase 2 | Homes Built To Suit Your Needs
Kohinoor Flats In Hinjewadi Phase 2 | Homes Built To Suit Your NeedsKohinoor Flats In Hinjewadi Phase 2 | Homes Built To Suit Your Needs
Kohinoor Flats In Hinjewadi Phase 2 | Homes Built To Suit Your Needsaidasheikh47
 
Call Girls in Model Town Delhi 💯Call Us 🔝8264348440🔝
Call Girls in Model Town Delhi 💯Call Us 🔝8264348440🔝Call Girls in Model Town Delhi 💯Call Us 🔝8264348440🔝
Call Girls in Model Town Delhi 💯Call Us 🔝8264348440🔝soniya singh
 
Listing Turkey Sylvana Istanbul - Bahcesehir
Listing Turkey Sylvana Istanbul - BahcesehirListing Turkey Sylvana Istanbul - Bahcesehir
Listing Turkey Sylvana Istanbul - BahcesehirListing Turkey
 
The Omaxe State Dwarka Delhi-broucher.pdf.pdf
The Omaxe State Dwarka Delhi-broucher.pdf.pdfThe Omaxe State Dwarka Delhi-broucher.pdf.pdf
The Omaxe State Dwarka Delhi-broucher.pdf.pdfkratirudram
 
Call Girls in Noida Sector 12 Noida 💯Call Us 🔝 9582086666 🔝 South Delhi Escor...
Call Girls in Noida Sector 12 Noida 💯Call Us 🔝 9582086666 🔝 South Delhi Escor...Call Girls in Noida Sector 12 Noida 💯Call Us 🔝 9582086666 🔝 South Delhi Escor...
Call Girls in Noida Sector 12 Noida 💯Call Us 🔝 9582086666 🔝 South Delhi Escor...delhimodel235
 
Girls in Kalyanpuri }Delhi↫8447779280↬Escort Service. In Delhi NCR
Girls in Kalyanpuri }Delhi↫8447779280↬Escort Service. In Delhi NCRGirls in Kalyanpuri }Delhi↫8447779280↬Escort Service. In Delhi NCR
Girls in Kalyanpuri }Delhi↫8447779280↬Escort Service. In Delhi NCRasmaqueen5
 

Recently uploaded (20)

Call Girls In Laxmi Nagar Delhi +91-8447779280! !Best Woman Seeking Man Escor...
Call Girls In Laxmi Nagar Delhi +91-8447779280! !Best Woman Seeking Man Escor...Call Girls In Laxmi Nagar Delhi +91-8447779280! !Best Woman Seeking Man Escor...
Call Girls In Laxmi Nagar Delhi +91-8447779280! !Best Woman Seeking Man Escor...
 
Nanke Area Estate commercial ( Dir. Kat Kuo)
Nanke Area Estate commercial ( Dir. Kat Kuo)Nanke Area Estate commercial ( Dir. Kat Kuo)
Nanke Area Estate commercial ( Dir. Kat Kuo)
 
call girls in ganesh nagar Delhi 8264348440 ✅ call girls ❤️
call girls in ganesh nagar Delhi 8264348440 ✅ call girls ❤️call girls in ganesh nagar Delhi 8264348440 ✅ call girls ❤️
call girls in ganesh nagar Delhi 8264348440 ✅ call girls ❤️
 
call girls in lajapat nagar 9811711561/..
call girls in lajapat nagar 9811711561/..call girls in lajapat nagar 9811711561/..
call girls in lajapat nagar 9811711561/..
 
3D Architectural Rendering Company by Panoram CGI
3D Architectural Rendering Company by Panoram CGI3D Architectural Rendering Company by Panoram CGI
3D Architectural Rendering Company by Panoram CGI
 
Sankla East World Hadapsar Pune E-Brochure.pdf
Sankla East World Hadapsar Pune  E-Brochure.pdfSankla East World Hadapsar Pune  E-Brochure.pdf
Sankla East World Hadapsar Pune E-Brochure.pdf
 
Majestique Viman Nagar Pune Brochure.pdf
Majestique Viman Nagar Pune Brochure.pdfMajestique Viman Nagar Pune Brochure.pdf
Majestique Viman Nagar Pune Brochure.pdf
 
Aparna Greenscapes Kompally Hyderabad E - Brochure.pdf
Aparna Greenscapes Kompally Hyderabad E - Brochure.pdfAparna Greenscapes Kompally Hyderabad E - Brochure.pdf
Aparna Greenscapes Kompally Hyderabad E - Brochure.pdf
 
FULL ENJOY 🔝 8264348440 🔝 Call Girls in DLF phase 3 | Gurgaon
FULL ENJOY 🔝 8264348440 🔝 Call Girls in DLF phase 3 | GurgaonFULL ENJOY 🔝 8264348440 🔝 Call Girls in DLF phase 3 | Gurgaon
FULL ENJOY 🔝 8264348440 🔝 Call Girls in DLF phase 3 | Gurgaon
 
Call Girls in laxmi Nagar Delhi 💯Call Us 🔝 9582086666🔝 South Delhi Escorts Se...
Call Girls in laxmi Nagar Delhi 💯Call Us 🔝 9582086666🔝 South Delhi Escorts Se...Call Girls in laxmi Nagar Delhi 💯Call Us 🔝 9582086666🔝 South Delhi Escorts Se...
Call Girls in laxmi Nagar Delhi 💯Call Us 🔝 9582086666🔝 South Delhi Escorts Se...
 
Call Girls in Noida Sector 13 Noida 💯Call Us 🔝 9582086666 🔝 South Delhi Escor...
Call Girls in Noida Sector 13 Noida 💯Call Us 🔝 9582086666 🔝 South Delhi Escor...Call Girls in Noida Sector 13 Noida 💯Call Us 🔝 9582086666 🔝 South Delhi Escor...
Call Girls in Noida Sector 13 Noida 💯Call Us 🔝 9582086666 🔝 South Delhi Escor...
 
Premium Villa Projects in Sarjapur Road Bengaluru
Premium Villa Projects in Sarjapur Road BengaluruPremium Villa Projects in Sarjapur Road Bengaluru
Premium Villa Projects in Sarjapur Road Bengaluru
 
:/Call Girls In Saidulajab Delhi ➥9990211544 High profile Riya Escorts In 24/...
:/Call Girls In Saidulajab Delhi ➥9990211544 High profile Riya Escorts In 24/...:/Call Girls In Saidulajab Delhi ➥9990211544 High profile Riya Escorts In 24/...
:/Call Girls In Saidulajab Delhi ➥9990211544 High profile Riya Escorts In 24/...
 
Kohinoor Flats In Hinjewadi Phase 2 | Homes Built To Suit Your Needs
Kohinoor Flats In Hinjewadi Phase 2 | Homes Built To Suit Your NeedsKohinoor Flats In Hinjewadi Phase 2 | Homes Built To Suit Your Needs
Kohinoor Flats In Hinjewadi Phase 2 | Homes Built To Suit Your Needs
 
Call Girls in Model Town Delhi 💯Call Us 🔝8264348440🔝
Call Girls in Model Town Delhi 💯Call Us 🔝8264348440🔝Call Girls in Model Town Delhi 💯Call Us 🔝8264348440🔝
Call Girls in Model Town Delhi 💯Call Us 🔝8264348440🔝
 
VIP Escorts in Delhi:🔝9953056974🔝 Hot Qutub Minar Delhi Escorts Service
VIP Escorts in Delhi:🔝9953056974🔝 Hot Qutub Minar Delhi Escorts ServiceVIP Escorts in Delhi:🔝9953056974🔝 Hot Qutub Minar Delhi Escorts Service
VIP Escorts in Delhi:🔝9953056974🔝 Hot Qutub Minar Delhi Escorts Service
 
Listing Turkey Sylvana Istanbul - Bahcesehir
Listing Turkey Sylvana Istanbul - BahcesehirListing Turkey Sylvana Istanbul - Bahcesehir
Listing Turkey Sylvana Istanbul - Bahcesehir
 
The Omaxe State Dwarka Delhi-broucher.pdf.pdf
The Omaxe State Dwarka Delhi-broucher.pdf.pdfThe Omaxe State Dwarka Delhi-broucher.pdf.pdf
The Omaxe State Dwarka Delhi-broucher.pdf.pdf
 
Call Girls in Noida Sector 12 Noida 💯Call Us 🔝 9582086666 🔝 South Delhi Escor...
Call Girls in Noida Sector 12 Noida 💯Call Us 🔝 9582086666 🔝 South Delhi Escor...Call Girls in Noida Sector 12 Noida 💯Call Us 🔝 9582086666 🔝 South Delhi Escor...
Call Girls in Noida Sector 12 Noida 💯Call Us 🔝 9582086666 🔝 South Delhi Escor...
 
Girls in Kalyanpuri }Delhi↫8447779280↬Escort Service. In Delhi NCR
Girls in Kalyanpuri }Delhi↫8447779280↬Escort Service. In Delhi NCRGirls in Kalyanpuri }Delhi↫8447779280↬Escort Service. In Delhi NCR
Girls in Kalyanpuri }Delhi↫8447779280↬Escort Service. In Delhi NCR
 

Tampa Bay 2018 Q1 Office Outlook

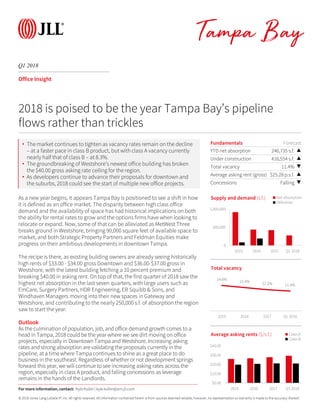
  • 1. © 2018 Jones Lang LaSalle IP, Inc. All rights reserved. All information contained herein is from sources deemed reliable; however, no representation or warranty is made to the accuracy thereof. Q1 2018 Tampa Bay Office Insight As a new year begins, it appears Tampa Bay is positioned to see a shift in how it is defined as an office market. The disparity between high class office demand and the availability of space has had historical implications on both the ability for rental rates to grow and the options firms have when looking to relocate or expand. Now, some of that can be alleviated as MetWest Three breaks ground in Westshore, bringing 90,000 square feet of available space to market, and both Strategic Property Partners and Feldman Equities make progress on their ambitious developments in downtown Tampa. The recipe is there, as existing building owners are already seeing historically high rents of $33.00 - $34.00 gross Downtown and $36.00-$37.00 gross in Westshore, with the latest building fetching a 10 percent premium and breaking $40.00 in asking rent. On top of that, the first quarter of 2018 saw the highest net absorption in the last seven quarters, with large users such as EmCare, Surgery Partners, HDR Engineering, ER Squibb & Sons, and Windhaven Managers moving into their new spaces in Gateway and Westshore, and contributing to the nearly 250,000 s.f. of absorption the region saw to start the year. Outlook As the culmination of population, job, and office demand growth comes to a head in Tampa, 2018 could be the year where we see dirt moving on office projects, especially in Downtown Tampa and Westshore. Increasing asking rates and strong absorption are validating the proposals currently in the pipeline, at a time where Tampa continues to shine as a great place to do business in the southeast. Regardless of whether or not development springs forward this year, we will continue to see increasing asking rates across the region, especially in class A product, and falling concessions as leverage remains in the hands of the Landlords. Fundamentals Forecast YTD net absorption 246,735 s.f. ▲ Under construction 416,554 s.f. ▲ Total vacancy 11.4% ▼ Average asking rent (gross) $25.28 p.s.f. ▲ Concessions Falling ▼ 0 500,000 1,000,000 2015 2016 2017 Q1 2018 Supply and demand (s.f.) Net absorption Deliveries 2018 is poised to be the year Tampa Bay’s pipeline flows rather than trickles 14.6% 13.4% 12.2% 11.4% 2015 2016 2017 Q1 2018 Total vacancy $0.00 $10.00 $20.00 $30.00 $40.00 2015 2016 2017 Q1 2018 Average asking rents ($/s.f.) Class A Class B For more information, contact: Kyle Koller | kyle.koller@am.jll.com • The market continues to tighten as vacancy rates remain on the decline – at a faster pace in class B product, but with class A vacancy currently nearly half that of class B – at 8.3%. • The groundbreaking of Westshore’s newest office building has broken the $40.00 gross asking rate ceiling for the region. • As developers continue to advance their proposals for downtown and the suburbs, 2018 could see the start of multiple new office projects.
  • 2. © 2018 Jones Lang LaSalle IP, Inc. All rights reserved. All information contained herein is from sources deemed reliable; however, no representation or warranty is made to the accuracy thereof. Q1 2018 Tampa Bay Office Statistics For more information, contact: Kyle Koller | kyle.koller@am.jll.com Class Inventory (s.f.) YTD total net absorption (s.f.) YTD total net absorption (% of stock) Direct vacancy (%) Total vacancy (%) Average asking rent ($ p.s.f.) YTD Completions (s.f.) Under Development (s.f.) Gateway/Bayside Totals 3,653,043 187,199 5.1% 12.1% 12.3% $22.30 0 0 I-75/I-4 Corridor Totals 6,332,171 -65,659 -1.0% 12.6% 12.7% $20.50 0 0 Northwest Totals 2,663,377 9,273 0.3% 9.6% 9.7% $20.94 0 148,800 Pinellas Outlying Totals 2,234,021 -28,856 -1.3% 26.9% 26.9% $18.44 0 0 St. Pete CBD Totals 2,168,064 3,483 0.2% 7.6% 7.7% $27.68 0 0 Tampa CBD Totals 6,024,782 56,002 0.9% 10.2% 10.5% $28.19 0 0 Westshore Totals 11,818,161 115,392 1.0% 8.2% 9.0% $30.37 0 267,754 Tampa Bay Totals 34,893,619 276,834 0.8% 11.0% 11.4% $25.28 0 416,554 Gateway/Bayside A 2,469,633 70,972 2.9% 5.5% 5.8% $23.87 0 0 I-75/I-4 Corridor A 3,280,175 -64,600 -2.0% 9.2% 9.3% $25.69 0 0 Northwest A 1,012,125 -2,243 -0.2% 2.1% 2.1% $26.85 0 148,800 Pinellas Outlying A 1,037,202 -7,010 -0.7% 20.3% 20.3% $21.06 0 0 St. Pete CBD A 1,633,077 -380 0.0% 6.8% 7.0% $28.82 0 0 Tampa CBD A 4,572,871 52,189 1.1% 10.7% 10.9% $29.50 0 0 Westshore A 7,409,363 75,169 1.0% 6.1% 6.7% $34.16 0 267,754 Tampa Bay A 21,414,446 124,097 0.6% 8.0% 8.3% $29.34 0 416,554 Gateway/Bayside B 1,183,410 116,227 9.8% 25.8% 25.8% $20.05 0 0 I-75/I-4 Corridor B 3,051,996 -1,059 0.0% 16.4% 16.4% $18.44 0 0 Northwest B 1,651,252 11,516 0.7% 14.2% 14.4% $20.34 0 0 Pinellas Outlying B 1,196,819 -21,846 -1.8% 32.7% 32.7% $16.96 0 0 St. Pete CBD B 534,987 3,863 0.7% 9.8% 9.8% $22.85 0 0 Tampa CBD B 1,451,911 3,813 0.3% 8.9% 9.1% $22.80 0 0 Westshore B 4,408,798 40,223 0.9% 11.7% 13.0% $25.54 0 0 Tampa Bay B 13,479,173 152,737 1.1% 15.8% 16.3% $20.99 0 0