Cushman & Wakefield Montreal Americas Marketbeat Office Q12019 #CRE #RealEstate
•
1 like•330 views

This document summarizes real estate market conditions in Montreal, Quebec in the first quarter of 2019. It finds that the unemployment rate remained unchanged at 5.9% and vacancy rates declined to 10.9% as positive absorption of 795,000 square feet continued across major markets. Rental rates increased slightly by 2% annually as large blocks of available space disappeared and demand increased in a tightening market. The outlook is for the positive momentum to continue through 2019, with further tightening of vacancy rates and small increases in average rental rates.

Recommended
Recommended
More Related Content
What's hot
What's hot (20)
Similar to Cushman & Wakefield Montreal Americas Marketbeat Office Q12019 #CRE #RealEstate
Similar to Cushman & Wakefield Montreal Americas Marketbeat Office Q12019 #CRE #RealEstate (20)
More from Guy Masse
More from Guy Masse (20)
Recently uploaded
Recently uploaded (20)
Cushman & Wakefield Montreal Americas Marketbeat Office Q12019 #CRE #RealEstate
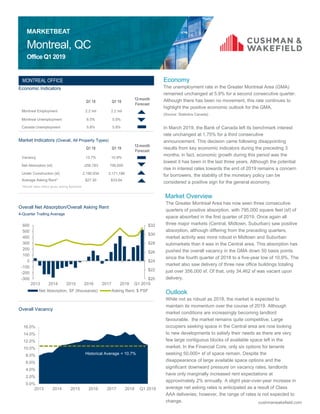
- 1. Montreal, QC Office Q4 2017 MARKETBEATMARKETBEAT Montreal, QC Office Q1 2019 Economic Indicators Market Indicators (Overall, All Property Types) Overall Net Absorption/Overall Asking Rent 4-Quarter Trailing Average Overall Vacancy 0.0% 2.0% 4.0% 6.0% 8.0% 10.0% 12.0% 14.0% 16.0% 2013 2014 2015 2016 2017 2018 Q1 2019 Q1 18 Q1 19 12-month Forecast Montreal Employment 2.2 mil 2.2 mil Montreal Unemployment 6.5% 5.9% Canada Unemployment 5.8% 5.8% Q1 18 Q1 19 12-month Forecast Vacancy 13.7% 10.9% Net Absorption (sf) -256,783 795,650 Under Construction (sf) 2,190,934 3,171,188 Average Asking Rent* $27.30 $33.64 *Rental rates reflect gross asking $psf/year MONTREAL OFFICE Historical Average = 10.7% $20 $22 $24 $26 $28 $30 $32 -300 -200 -100 0 100 200 300 400 500 600 2013 2014 2015 2016 2017 2018 Q1 2019 Net Absorption, SF (thousands) Asking Rent, $ PSF cushmanwakefield.com Economy The unemployment rate in the Greater Montreal Area (GMA) remained unchanged at 5.9% for a second consecutive quarter. Although there has been no movement, this rate continues to highlight the positive economic outlook for the GMA. (Source: Statistics Canada) In March 2019, the Bank of Canada left its benchmark interest rate unchanged at 1.75% for a third consecutive announcement. This decision came following disappointing results from key economic indicators during the preceding 3 months; in fact, economic growth during this period was the lowest it has been in the last three years. Although the potential rise in interest rates towards the end of 2019 remains a concern for borrowers, the stability of the monetary policy can be considered a positive sign for the general economy. Market Overview The Greater Montreal Area has now seen three consecutive quarters of positive absorption, with 795,000 square feet (sf) of space absorbed in the first quarter of 2019. Once again all three major markets (Central, Midtown, Suburban) saw positive absorption, although differing from the preceding quarters, market activity was more robust in Midtown and Suburban submarkets than it was in the Central area. This absorption has pushed the overall vacancy in the GMA down 50 basis points since the fourth quarter of 2018 to a five-year low of 10.9%. The market also saw delivery of three new office buildings totaling just over 356,000 sf. Of that, only 34,462 sf was vacant upon delivery. Outlook While not as robust as 2018, the market is expected to maintain its momentum over the course of 2019. Although market conditions are increasingly becoming landlord favourable, the market remains quite competitive. Large occupiers seeking space in the Central area are now looking to new developments to satisfy their needs as there are very few large contiguous blocks of available space left in the market. In the Financial Core, only six options for tenants seeking 50,000+ sf of space remain. Despite the disappearance of large available space options and the significant downward pressure on vacancy rates, landlords have only marginally increased rent expectations at approximately 2% annually. A slight year-over-year increase in average net asking rates is anticipated as a result of Class AAA deliveries; however, the range of rates is not expected to change.
- 2. Montreal, QC Office Q4 2017 MARKETBEATMARKETBEAT Montreal, QC Office Q1 2019 Economic Indicators Market Indicators (Overall, All Property Types) Overall Net Absorption/Overall Asking Rent 4-Quarter Trailing Average Overall Vacancy Building Class INVENTORY (SF) SUBLET VACANT (SF) DIRECT VACANT (SF) OVERALL VACANCY RATE CURRENT NET OVERALL ABSORPTION (SF) YTD NET OVERALL ABSORPTION (SF) UNDER CONSTR (SF) OVERALL AVERAGE ASKING RENT (ALL MARKETS)* Class A 40,830,395 589,595 3,192,278 9.3% 316,725 316,725 2,731,609 $40.29 Class B 44,103,658 379,574 5,111,113 12.4% 540,602 540,602 439,579 $30.95 Class C 13,211,727 26,896 1,419,700 10.9% -61,677 -61,677 0 $23.73 *Rental rates represent $ per square foot per year cushmanwakefield.com SUBMARKET INVENTORY (SF) SUBLET VACANT (SF) DIRECT VACANT (SF) OVERALL VACANCY RATE CURRENT NET ABSORPTION (SF) YTD OVERALL ABSORPTION (SF) UNDER CONSTRUCTION (SF) OVERALL AVERAGE ASKING RENT (ALL CLASSES)* OVERALL AVERAGE ASKING RENT (CLASS A)* Financial Core 21,882,859 51,031 1,938,445 9.1% 139,965 139,965 0 $41.55 $44.81 Downtown West 4,038,881 1,985 236,357 5.9% 25,705 25,705 173,699 $34.95 $42.04 Downtown East 9,295,798 0 491,049 5.3% 56,479 56,479 610,976 $35.70 $49.38 Downtown South 11,914,800 272,752 650,145 7.7% -122,697 -122,697 1,000,000 $42.23 $44.69 Downtown Southwest 2,100,971 10,000 136,370 7.0% 28,121 28,121 148,618 $24.04 N/A Old Montreal 4,569,297 11,704 295,923 6.7% 45,107 45,107 150,000 $30.58 N/A Westmount 2,328,306 1,240 127,720 5.5% 18,465 18,465 0 $32.92 $36.72 Central Area 56,130,912 348,712 3,876,009 7.5% 191,145 191,145 2,083,293 $38.61 44.83$ Midtown East 2,620,068 22,036 199,662 8.5% 28,121 28,121 418,000 $25.69 N/A Midtown Central 5,016,529 43,871 256,509 6.0% 85,261 85,261 176,434 $24.52 N/A Midtown North 5,620,131 0 1,143,441 20.3% 33,709 33,709 0 $23.02 $29.25 Décarie CDN 2,550,767 14,930 464,052 18.8% 7,253 7,253 0 $28.76 $32.67 Midtown West 760,064 0 163,124 21.5% -2,912 -2,912 0 $24.34 N/A Midtown South 981,082 116,767 22,932 14.2% -3,500 -3,500 0 $25.10 N/A Île-des-Sœurs 1,735,401 8,600 249,942 14.9% 1,794 1,794 0 N/A N/A Saint-Laurent 7,091,374 314,693 1,093,266 19.9% 59,826 59,826 35,961 $28.18 $31.21 Midtown 26,375,416 520,897 3,592,928 15.6% 209,552 209,552 630,395 $25.82 $31.06 West Island 2,909,993 17,802 479,759 17.1% 24,230 24,230 0 $30.03 $31.28 East End 3,310,114 21,181 490,437 15.5% 161,824 161,824 0 $24.29 $29.13 Laval 4,350,250 31,417 623,962 15.1% 27,197 27,197 0 $32.40 $34.80 South Shore 5,069,085 56,056 659,996 14.1% 181,702 181,702 457,500 $28.53 $32.29 Suburbs 15,639,442 126,456 2,254,154 15.2% 394,953 394,953 457,500 $28.99 $32.48 GREATER MONTREAL AREA TOTALS 98,145,770 996,065 9,723,091 10.9% 795,650 795,650 3,171,188 $33.64 $40.29
- 3. About Cushman & Wakefield Cushman & Wakefield (NYSE: CWK) is a leading global real estate services firm that delivers exceptional value for real estate occupiers and owners. Cushman & Wakefield is among the largest real estate services firms with approximately 51,000 employees in 400 offices and 70 countries. In 2018, the firm had revenue of $8.2 billion across core services of property, facilities and project management, leasing, capital markets, valuation and other services. To learn more, visit www.cushmanwakefield.com or follow @CushWake on Twitter. ©2019 Cushman & Wakefield. All rights reserved. The information contained within this report is gathered from multiple sources believed to be reliable. The information may contain errors or omissions and is presented without any warranty or representations as to its accuracy. MARKETBEAT Montreal, QC Office Q1 2019 Cushman & Wakefield 999, boul. de Maisonneuve Ouest bureau 1500 Montréal, QC H3A 3L4 www.cushmanwakefield.com Twitter: @CushWakeMTL For more information, contact: George Meletakos Senior Research Analyst Tel: +1 514 841 3808 George.Meletakos@cushwake.com Key Lease Transactions Q1 2019 PROPERTY SF TENANT TRANSACTION TYPE SUBMARKET 4150 Sainte-Catherine West 34,747 CROWE BGK S.E.N.C.R.L. LLP Renewal Westmount 800 René-Levesque West 25,000 Confidential New Tenant Financial Core 2001 Robert-Bourassa 21,584 BNP PARIBAS New Tenant Financial Core 2055 Peel 20,326 Postmedia New Tenant Financial Core Key Sales Transactions Q1 2019 PROPERTY SF SELLER / BUYER PRICE / $PSF SUBMARKET 3773-3777, 3900, 3950 de la Cote-Vertu & 7355, 7405 Transcanada Highway* 371,628 Cominar REIT / Groupe Quint JV Rainbow Capital $29,950,000 / $81 Saint-Laurent 5101 & 5151 Buchan Street* 167,020 Cominar REIT / Groupe Quint JV Groupe Mach $11,300,000 / $68 Décarie CDN 950 & 970 Beaumont 120,305 Groupe Montoni / Montez Corporation $18,750,000 / $312 Midtown Central 1620 Notre-Dame Street West & 415 Richmond Street 110,363 The Governing Council of The Salvation Army in Canada / MTRPL (11298771 Canada inc.) $12,100,000 / $110 Downtown Southwest 14 Place du Commerce 87,718 Canderel / GCA Immobilier (9374-2773 Québec inc.) $16,000,000 / $182 Nun’s Island Midtown Suburbs Suburbs Suburbs Central Suburbs * Part of the Cominar REIT - Groupe Quint GMA Office Portfolio 2019