SlideShare a Scribd company logo
1 of 2
Download to read offline
Beaver county land sales per acre (2014 to present)
Source: JLL Research
Net absorption vs average asking rent
Source: JLL Research
Blue collar labor force in metropolitan Pittsburgh
Source: JLL Research
Increased demand in Beaver County causing slight rise in price per acre
Beaver County has been the center of attention ever since Shell announced
plans to build a multi-billion cracker facility. The perceived increased demand is
causing an increase in price. From 2007 until 2013, the average price per acre
for land in Beaver County was on a decline. It wasn’t until 2013, when the sale
of retail land in Beaver Falls marked a new highest price per acre since the
recession, at $399,000 per acre. The former PGT Trucking HQ, located on 24.4
acres, sold in 2016 for $12.5 million and helped the average towards a positive
trend. The activity and limited supply in Beaver continues to drive the asking
prices higher across all property types.
Rising natural gas production and pipeline activity
The production of natural gas in Pennsylvania reached more than 4.8 million
cubic feet (m.c.f.) in 2015, 4.2 m.c.f. more than 2014. The increase in production
was aided by the addition of 1,000 producing gas wells in the state. In the fourth
quarter 2016, Range Resources announced an expected 10.0 percent organic
increase in production growth of their own in 2017. Also in the fourth quarter, the
EQT Midstream Pipeline began service, carrying as much as 850 m.c.f. of
natural gas, while Shell announced the construction of a 92.3-mile Falcon
Pipeline that will carry ethane to their cracker facility. The increasing production
and pipeline activity will help drive oil and gas tenant demand in the region.
Shell cracker plant watch: construction documents are submitted
In the fourth quarter 2016, Shell submitted details to Potter Township and the
county for approval before construction begins. The application included
preliminary schematics for multiple structures, including a central control
building, a two-story administrative building, three guard houses, a storage
building, a maintenance and warehouse building and a firehouse and medical
facility. The documents indicated that nearly 7,000 construction workers will be
needed, with 20 to 30 trucks entering and exiting the site daily once operational.
The cracker plant is expected to create real estate demand from downstream
industries due to the proximity to the materials and the improved manufacturing
infrastructure. However, rapid job creation will present challenges.
Industrial Insight
Pittsburgh | Q4 2016
13,332,334
Total availability (s.f.)
3,209,629
YTD total net absorption (s.f.)
$4.74
Average asking rent (p.s.f.)
137,500
Total under construction (s.f.)
9.6%
Total availability
2.3%
YTD net absorption (as a % of stock)
$6.25
New build asking rents (p.s.f.)
1,498,000
YTD construction completions (s.f.)
©2016 Jones Lang LaSalle IP, Inc. All rights reserved.For more information, contact: Tobiah Bilski | tobiah.bilski@am.jll.com
770,000
191,000
260,000
Natural gas is fueling industrial demand in Pittsburgh
-$20,000
$50,000
$120,000
$190,000
$260,000
1/1/2014 12/31/2016
Sale date Linear (Sale date)
0
20,000
40,000
60,000
80,000
Construction Maintenance Production Transportation
$2
$4
$6
-500,000
1,000,000
2,500,000
4,000,000
2013 2014 2015 2016
Net Absorption (s.f.) Average asking rent (p.s.f.)
$0
Industrial Statistics
Pittsburgh | Q4 2016
©2016 Jones Lang LaSalle IP, Inc. All rights reserved.For more information, contact: Tobiah Bilski | tobiah.bilski@am.jll.com
Inventory
(s.f.)
Quarterly
absorption
(s.f.)
YTD absorption
(s.f.)
YTD
absorption
(% of stock)
Total
availability
(s.f.)
Total
availability
(%)
Average
asking rent
($ p.s.f.)
YTD
completions
(s.f.)
Under
construction
(s.f.)
Warehouse & Distribution 82,851,096 509,286 2,127,012 2.6% 9,172,756 11.1% $5.19 1,442,000 137,500
Manufacturing 55,820,524 -81,247 1,082,617 1.9% 4,159,578 7.5% $3.76 56,000 0
Total 138,671,620 428,039 3,209,629 2.3% 13,332,334 9.6% $4.74 1,498,000 137,500
Flex / R&D 20,818,654 94,479 499,006 2.4% 2,706,800 13.0% $9.90 122,000 0
Warehouse & Distribution 4,495,997 84,573 379,805 8.4% 604,543 13.4% $5.39 0 0
Manufacturing 4,517,893 0 38,000 0.8% 157,200 3.5% $2.65 0 0
Total 9,013,890 84,573 417,805 4.6% 761,743 8.5% $4.82 0 0
Flex / R&D 579,085 16,736 26,475 4.6% 90,860 15.7% $10.00 0 0
Warehouse & Distribution 3,684,353 -240,200 -270,825 -7.4% 528,837 14.4% $4.23 135,000 0
Manufacturing 3,561,575 -55,400 16,100 0.5% 474,689 13.3% $1.20 56,000 0
Total 7,245,928 -295,600 -254,725 -3.5% 1,003,526 13.8% $2.80 191,000 0
Flex / R&D 386,900 0 0 0.0% 11,000 2.8% $10.00 0 0
Warehouse & Distribution 18,147,571 50,150 58,509 0.3% 1,346,986 7.4% $5.61 0 0
Manufacturing 4,823,443 5,700 268,796 5.6% 114,877 2.4% $7.15 0 0
Total 22,971,014 55,850 327,305 1.4% 1,461,863 6.4% $5.73 0 0
Flex / R&D 3,048,264 -28,073 27,109 0.9% 409,202 13.4% $8.10 0 0
Warehouse & Distribution 6,575,278 51,445 66,124 1.0% 590,260 9.0% $5.14 0 0
Manufacturing 4,570,489 0 9,981 0.2% 362,990 7.9% $3.67 0 0
Total 11,145,767 51,445 76,105 0.7% 953,250 8.6% $4.56 0 0
Flex / R&D 2,839,112 56,900 252,731 8.9% 582,672 20.5% $10.50 0 0
Warehouse & Distribution 6,216,992 -24,500 53,792 0.9% 345,011 5.5% $5.15 0 0
Manufacturing 6,408,774 -300 157,010 2.4% 123,836 1.9% $5.75 0 0
Total 12,625,766 -24,800 210,802 1.7% 468,847 3.7% $5.31 0 0
Flex / R&D 3,131,818 -33,362 38,587 1.2% 317,300 10.1% $10.75 0 0
Warehouse & Distribution 10,193,185 225,965 577,266 5.7% 867,138 8.5% $6.10 0 0
Manufacturing 3,479,451 0 58,300 1.7% 40,040 1.2% $4.00 0 0
Total 13,672,636 225,965 635,566 4.6% 907,178 6.6% $6.05 0 0
Flex / R&D 2,109,466 -4,651 14,367 0.7% 178,851 8.5% $12.37 0 0
Warehouse & Distribution 5,385,363 33,618 -62,741 -1.2% 507,982 9.4% $3.64 0 0
Manufacturing 8,033,856 0 -81,114 -1.0% 177,782 2.2% $6.75 0 0
Total 13,419,219 33,618 -143,855 -1.1% 685,764 5.1% $4.48 0 0
Flex / R&D 1,634,737 22,676 51,186 3.1% 85,888 5.3% $12.37 0 0
Warehouse & Distribution 5,424,228 120,675 404,905 7.5% 1,791,541 33.0% $5.04 0 0
Manufacturing 4,716,380 -114,650 32,375 0.7% 345,000 7.3% $4.95 0 0
Total 10,140,608 6,025 437,280 4.3% 2,136,541 21.1% $5.03 0 0
Flex / R&D 1,407,932 -15,078 -120,939 -8.6% 318,787 22.6% $9.00 0 0
Warehouse & Distribution 10,561,216 253,207 778,297 7.4% 1,072,964 10.2% $6.42 80,000 100,000
Manufacturing 2,749,553 0 4,172 0.2% 159,916 5.8% $5.00 0 0
Total 13,310,769 253,207 782,469 5.9% 1,232,880 9.3% $6.24 80,000 100,000
Flex / R&D 3,257,885 89,331 145,062 4.5% 443,991 13.6% $12.59 122,000 0
Warehouse & Distribution 12,166,913 -45,647 141,880 1.2% 1,517,494 12.5% $4.39 1,227,000 37,500
Manufacturing 12,959,110 83,403 578,997 4.5% 2,203,248 17.0% $3.60 0 0
Total 25,126,023 37,756 720,877 2.9% 3,720,742 14.8% $3.92 1,227,000 37,500
Flex / R&D 2,423,455 -10,000 64,428 2.7% 268,249 11.1% $4.77 0 0
Market Totals
Beaver County
Butler County
Downtown
East
Northeast
Northwest
South
Washington County
West
Westmoreland County

More Related Content

What's hot

JLL Pittsburgh Industrial Insight & Statistics - Q3 2021
JLL Pittsburgh Industrial Insight & Statistics - Q3 2021JLL Pittsburgh Industrial Insight & Statistics - Q3 2021
JLL Pittsburgh Industrial Insight & Statistics - Q3 2021Tobiah Bilski
 
JLL Cleveland Industrial Outlook: Q4 2018
JLL Cleveland Industrial Outlook: Q4 2018JLL Cleveland Industrial Outlook: Q4 2018
JLL Cleveland Industrial Outlook: Q4 2018Andrew Batson
 
JLL Cleveland Industrial Outlook: Q4 2018
JLL Cleveland Industrial Outlook: Q4 2018JLL Cleveland Industrial Outlook: Q4 2018
JLL Cleveland Industrial Outlook: Q4 2018Andrew Batson
 
JLL Pittsburgh Industrial Insight & Statistics - Q4 2021
JLL Pittsburgh Industrial Insight & Statistics - Q4 2021JLL Pittsburgh Industrial Insight & Statistics - Q4 2021
JLL Pittsburgh Industrial Insight & Statistics - Q4 2021Tobiah Bilski
 
JLL Pittsburgh Industrial Insight & Statistics - Q4 2019
JLL Pittsburgh Industrial Insight & Statistics - Q4 2019JLL Pittsburgh Industrial Insight & Statistics - Q4 2019
JLL Pittsburgh Industrial Insight & Statistics - Q4 2019Tobiah Bilski
 
JLL Pittsburgh Industrial Insight & Statistics - Q3 2020
JLL Pittsburgh Industrial Insight & Statistics - Q3 2020JLL Pittsburgh Industrial Insight & Statistics - Q3 2020
JLL Pittsburgh Industrial Insight & Statistics - Q3 2020Tobiah Bilski
 
JLL West Michigan Industrial Insight & Statistics - Q1 2019
JLL West Michigan Industrial Insight & Statistics - Q1 2019JLL West Michigan Industrial Insight & Statistics - Q1 2019
JLL West Michigan Industrial Insight & Statistics - Q1 2019Harrison West
 
JLL Detroit Industrial Insight & Statistics - Q4 2017
JLL Detroit Industrial Insight & Statistics - Q4 2017JLL Detroit Industrial Insight & Statistics - Q4 2017
JLL Detroit Industrial Insight & Statistics - Q4 2017Harrison West
 
JLL Detroit Industrial Insight & Statistics - Q2 2017
JLL Detroit Industrial Insight & Statistics - Q2 2017JLL Detroit Industrial Insight & Statistics - Q2 2017
JLL Detroit Industrial Insight & Statistics - Q2 2017Harrison West
 
JLL Detroit Industrial Insight & Statistics - Q1 2019
JLL Detroit Industrial Insight & Statistics - Q1 2019JLL Detroit Industrial Insight & Statistics - Q1 2019
JLL Detroit Industrial Insight & Statistics - Q1 2019Harrison West
 
JLL Pittsburgh Industrial Insight & Statistics - Q1 2018
JLL Pittsburgh Industrial Insight & Statistics - Q1 2018JLL Pittsburgh Industrial Insight & Statistics - Q1 2018
JLL Pittsburgh Industrial Insight & Statistics - Q1 2018Tobiah Bilski
 
JLL Detroit Industrial Insight & Statistics - Q4 2018
JLL Detroit Industrial Insight & Statistics - Q4 2018JLL Detroit Industrial Insight & Statistics - Q4 2018
JLL Detroit Industrial Insight & Statistics - Q4 2018Harrison West
 
JLL Cleveland Industrial Outlook: Q1 2019
JLL Cleveland Industrial Outlook: Q1 2019JLL Cleveland Industrial Outlook: Q1 2019
JLL Cleveland Industrial Outlook: Q1 2019Andrew Batson
 
JLL Cleveland Industrial Outlook: Q3 2018
JLL Cleveland Industrial Outlook: Q3 2018JLL Cleveland Industrial Outlook: Q3 2018
JLL Cleveland Industrial Outlook: Q3 2018Andrew Batson
 
JLL West Michigan Industrial Insight & Statistics - Q4 2019
JLL West Michigan Industrial Insight & Statistics - Q4 2019JLL West Michigan Industrial Insight & Statistics - Q4 2019
JLL West Michigan Industrial Insight & Statistics - Q4 2019Harrison West
 
JLL Cleveland Industrial Outlook Q4 2019
JLL Cleveland Industrial Outlook Q4 2019JLL Cleveland Industrial Outlook Q4 2019
JLL Cleveland Industrial Outlook Q4 2019Johnathan Miller
 
JLL Detroit Industrial Insight & Statistics - Q4 2018
JLL Detroit Industrial Insight & Statistics - Q4 2018JLL Detroit Industrial Insight & Statistics - Q4 2018
JLL Detroit Industrial Insight & Statistics - Q4 2018Harrison West
 
JLL Detroit Industrial Insight & Statistics - Q3 2017
JLL Detroit Industrial Insight & Statistics - Q3 2017JLL Detroit Industrial Insight & Statistics - Q3 2017
JLL Detroit Industrial Insight & Statistics - Q3 2017Harrison West
 
JLL Pittsburgh Industrial Insight & Statistics - Q1 2020
JLL Pittsburgh Industrial Insight & Statistics - Q1 2020JLL Pittsburgh Industrial Insight & Statistics - Q1 2020
JLL Pittsburgh Industrial Insight & Statistics - Q1 2020Tobiah Bilski
 
JLL Pittsburgh Office Insight & Statistics - Q3 2021
JLL Pittsburgh Office Insight & Statistics - Q3 2021JLL Pittsburgh Office Insight & Statistics - Q3 2021
JLL Pittsburgh Office Insight & Statistics - Q3 2021Tobiah Bilski
 

What's hot (20)

JLL Pittsburgh Industrial Insight & Statistics - Q3 2021
JLL Pittsburgh Industrial Insight & Statistics - Q3 2021JLL Pittsburgh Industrial Insight & Statistics - Q3 2021
JLL Pittsburgh Industrial Insight & Statistics - Q3 2021
 
JLL Cleveland Industrial Outlook: Q4 2018
JLL Cleveland Industrial Outlook: Q4 2018JLL Cleveland Industrial Outlook: Q4 2018
JLL Cleveland Industrial Outlook: Q4 2018
 
JLL Cleveland Industrial Outlook: Q4 2018
JLL Cleveland Industrial Outlook: Q4 2018JLL Cleveland Industrial Outlook: Q4 2018
JLL Cleveland Industrial Outlook: Q4 2018
 
JLL Pittsburgh Industrial Insight & Statistics - Q4 2021
JLL Pittsburgh Industrial Insight & Statistics - Q4 2021JLL Pittsburgh Industrial Insight & Statistics - Q4 2021
JLL Pittsburgh Industrial Insight & Statistics - Q4 2021
 
JLL Pittsburgh Industrial Insight & Statistics - Q4 2019
JLL Pittsburgh Industrial Insight & Statistics - Q4 2019JLL Pittsburgh Industrial Insight & Statistics - Q4 2019
JLL Pittsburgh Industrial Insight & Statistics - Q4 2019
 
JLL Pittsburgh Industrial Insight & Statistics - Q3 2020
JLL Pittsburgh Industrial Insight & Statistics - Q3 2020JLL Pittsburgh Industrial Insight & Statistics - Q3 2020
JLL Pittsburgh Industrial Insight & Statistics - Q3 2020
 
JLL West Michigan Industrial Insight & Statistics - Q1 2019
JLL West Michigan Industrial Insight & Statistics - Q1 2019JLL West Michigan Industrial Insight & Statistics - Q1 2019
JLL West Michigan Industrial Insight & Statistics - Q1 2019
 
JLL Detroit Industrial Insight & Statistics - Q4 2017
JLL Detroit Industrial Insight & Statistics - Q4 2017JLL Detroit Industrial Insight & Statistics - Q4 2017
JLL Detroit Industrial Insight & Statistics - Q4 2017
 
JLL Detroit Industrial Insight & Statistics - Q2 2017
JLL Detroit Industrial Insight & Statistics - Q2 2017JLL Detroit Industrial Insight & Statistics - Q2 2017
JLL Detroit Industrial Insight & Statistics - Q2 2017
 
JLL Detroit Industrial Insight & Statistics - Q1 2019
JLL Detroit Industrial Insight & Statistics - Q1 2019JLL Detroit Industrial Insight & Statistics - Q1 2019
JLL Detroit Industrial Insight & Statistics - Q1 2019
 
JLL Pittsburgh Industrial Insight & Statistics - Q1 2018
JLL Pittsburgh Industrial Insight & Statistics - Q1 2018JLL Pittsburgh Industrial Insight & Statistics - Q1 2018
JLL Pittsburgh Industrial Insight & Statistics - Q1 2018
 
JLL Detroit Industrial Insight & Statistics - Q4 2018
JLL Detroit Industrial Insight & Statistics - Q4 2018JLL Detroit Industrial Insight & Statistics - Q4 2018
JLL Detroit Industrial Insight & Statistics - Q4 2018
 
JLL Cleveland Industrial Outlook: Q1 2019
JLL Cleveland Industrial Outlook: Q1 2019JLL Cleveland Industrial Outlook: Q1 2019
JLL Cleveland Industrial Outlook: Q1 2019
 
JLL Cleveland Industrial Outlook: Q3 2018
JLL Cleveland Industrial Outlook: Q3 2018JLL Cleveland Industrial Outlook: Q3 2018
JLL Cleveland Industrial Outlook: Q3 2018
 
JLL West Michigan Industrial Insight & Statistics - Q4 2019
JLL West Michigan Industrial Insight & Statistics - Q4 2019JLL West Michigan Industrial Insight & Statistics - Q4 2019
JLL West Michigan Industrial Insight & Statistics - Q4 2019
 
JLL Cleveland Industrial Outlook Q4 2019
JLL Cleveland Industrial Outlook Q4 2019JLL Cleveland Industrial Outlook Q4 2019
JLL Cleveland Industrial Outlook Q4 2019
 
JLL Detroit Industrial Insight & Statistics - Q4 2018
JLL Detroit Industrial Insight & Statistics - Q4 2018JLL Detroit Industrial Insight & Statistics - Q4 2018
JLL Detroit Industrial Insight & Statistics - Q4 2018
 
JLL Detroit Industrial Insight & Statistics - Q3 2017
JLL Detroit Industrial Insight & Statistics - Q3 2017JLL Detroit Industrial Insight & Statistics - Q3 2017
JLL Detroit Industrial Insight & Statistics - Q3 2017
 
JLL Pittsburgh Industrial Insight & Statistics - Q1 2020
JLL Pittsburgh Industrial Insight & Statistics - Q1 2020JLL Pittsburgh Industrial Insight & Statistics - Q1 2020
JLL Pittsburgh Industrial Insight & Statistics - Q1 2020
 
JLL Pittsburgh Office Insight & Statistics - Q3 2021
JLL Pittsburgh Office Insight & Statistics - Q3 2021JLL Pittsburgh Office Insight & Statistics - Q3 2021
JLL Pittsburgh Office Insight & Statistics - Q3 2021
 

Similar to JLL Pittsburgh Industrial Insight & Statistics - Q4 2016

JLL Pittsburgh Industrial Insight & Statistics - Q3 2017
JLL Pittsburgh Industrial Insight & Statistics - Q3 2017JLL Pittsburgh Industrial Insight & Statistics - Q3 2017
JLL Pittsburgh Industrial Insight & Statistics - Q3 2017Tobiah Bilski
 
JLL Cleveland Industrial Outlook Q3 2019
JLL Cleveland Industrial Outlook   Q3 2019JLL Cleveland Industrial Outlook   Q3 2019
JLL Cleveland Industrial Outlook Q3 2019Johnathan Miller
 
JLL Cleveland Industrial Outlook: Q3 2019
JLL Cleveland Industrial Outlook: Q3 2019JLL Cleveland Industrial Outlook: Q3 2019
JLL Cleveland Industrial Outlook: Q3 2019Johnathan Miller
 
JLL Pittsburgh Industrial Insight & Statistics - Q4 2018
JLL Pittsburgh Industrial Insight & Statistics - Q4 2018JLL Pittsburgh Industrial Insight & Statistics - Q4 2018
JLL Pittsburgh Industrial Insight & Statistics - Q4 2018Tobiah Bilski
 
JLL Cincinnati Industrial Outlook - Q3 2016
JLL Cincinnati Industrial Outlook - Q3 2016JLL Cincinnati Industrial Outlook - Q3 2016
JLL Cincinnati Industrial Outlook - Q3 2016Ross Bratcher
 
JLL Pittsburgh Industrial Insight & Statistics - Q3 2018
JLL Pittsburgh Industrial Insight & Statistics - Q3 2018JLL Pittsburgh Industrial Insight & Statistics - Q3 2018
JLL Pittsburgh Industrial Insight & Statistics - Q3 2018Tobiah Bilski
 
JLL Pittsburgh Industrial Insight & Statistics - Q2 2018
JLL Pittsburgh Industrial Insight & Statistics - Q2 2018JLL Pittsburgh Industrial Insight & Statistics - Q2 2018
JLL Pittsburgh Industrial Insight & Statistics - Q2 2018Tobiah Bilski
 
JLL Cincinnati Industrial Outlook Q4 2017
JLL Cincinnati Industrial Outlook Q4 2017JLL Cincinnati Industrial Outlook Q4 2017
JLL Cincinnati Industrial Outlook Q4 2017Abby Armbruster
 
JLL Cincinnati Industrial Outlook Q3 2017
JLL Cincinnati Industrial Outlook  Q3 2017JLL Cincinnati Industrial Outlook  Q3 2017
JLL Cincinnati Industrial Outlook Q3 2017Abby Armbruster
 
JLL Detroit Industrial Insight & Statistics - Q2 2016
JLL Detroit Industrial Insight & Statistics - Q2 2016JLL Detroit Industrial Insight & Statistics - Q2 2016
JLL Detroit Industrial Insight & Statistics - Q2 2016Aaron Moore
 
JLL Cincinnati Industrial Outlook Q1 2021
JLL Cincinnati Industrial Outlook Q1 2021JLL Cincinnati Industrial Outlook Q1 2021
JLL Cincinnati Industrial Outlook Q1 2021Abby Armbruster
 
Jll cincinnati industrial outlook q1 2017
Jll cincinnati industrial outlook   q1 2017Jll cincinnati industrial outlook   q1 2017
Jll cincinnati industrial outlook q1 2017Abby Armbruster
 
JLL Cleveland Industrial Outlook: Q1 2017
JLL Cleveland Industrial Outlook: Q1 2017JLL Cleveland Industrial Outlook: Q1 2017
JLL Cleveland Industrial Outlook: Q1 2017Andrew Batson
 
JLL - Tampa Bay 2018 Q2 Industrial Outlook
JLL - Tampa Bay 2018 Q2 Industrial OutlookJLL - Tampa Bay 2018 Q2 Industrial Outlook
JLL - Tampa Bay 2018 Q2 Industrial OutlookKyle Koller
 
Q3 2014 industrial market report
Q3 2014 industrial market reportQ3 2014 industrial market report
Q3 2014 industrial market reportdevengriffin
 
JLL Detroit Industrial Insight & Statistics - Q3 2016
JLL Detroit Industrial Insight & Statistics - Q3 2016JLL Detroit Industrial Insight & Statistics - Q3 2016
JLL Detroit Industrial Insight & Statistics - Q3 2016Harrison West
 
JLL Pittsburgh Industrial Insight & Statistics - Q4 2020
JLL Pittsburgh Industrial Insight & Statistics - Q4 2020JLL Pittsburgh Industrial Insight & Statistics - Q4 2020
JLL Pittsburgh Industrial Insight & Statistics - Q4 2020Tobiah Bilski
 

Similar to JLL Pittsburgh Industrial Insight & Statistics - Q4 2016 (17)

JLL Pittsburgh Industrial Insight & Statistics - Q3 2017
JLL Pittsburgh Industrial Insight & Statistics - Q3 2017JLL Pittsburgh Industrial Insight & Statistics - Q3 2017
JLL Pittsburgh Industrial Insight & Statistics - Q3 2017
 
JLL Cleveland Industrial Outlook Q3 2019
JLL Cleveland Industrial Outlook   Q3 2019JLL Cleveland Industrial Outlook   Q3 2019
JLL Cleveland Industrial Outlook Q3 2019
 
JLL Cleveland Industrial Outlook: Q3 2019
JLL Cleveland Industrial Outlook: Q3 2019JLL Cleveland Industrial Outlook: Q3 2019
JLL Cleveland Industrial Outlook: Q3 2019
 
JLL Pittsburgh Industrial Insight & Statistics - Q4 2018
JLL Pittsburgh Industrial Insight & Statistics - Q4 2018JLL Pittsburgh Industrial Insight & Statistics - Q4 2018
JLL Pittsburgh Industrial Insight & Statistics - Q4 2018
 
JLL Cincinnati Industrial Outlook - Q3 2016
JLL Cincinnati Industrial Outlook - Q3 2016JLL Cincinnati Industrial Outlook - Q3 2016
JLL Cincinnati Industrial Outlook - Q3 2016
 
JLL Pittsburgh Industrial Insight & Statistics - Q3 2018
JLL Pittsburgh Industrial Insight & Statistics - Q3 2018JLL Pittsburgh Industrial Insight & Statistics - Q3 2018
JLL Pittsburgh Industrial Insight & Statistics - Q3 2018
 
JLL Pittsburgh Industrial Insight & Statistics - Q2 2018
JLL Pittsburgh Industrial Insight & Statistics - Q2 2018JLL Pittsburgh Industrial Insight & Statistics - Q2 2018
JLL Pittsburgh Industrial Insight & Statistics - Q2 2018
 
JLL Cincinnati Industrial Outlook Q4 2017
JLL Cincinnati Industrial Outlook Q4 2017JLL Cincinnati Industrial Outlook Q4 2017
JLL Cincinnati Industrial Outlook Q4 2017
 
JLL Cincinnati Industrial Outlook Q3 2017
JLL Cincinnati Industrial Outlook  Q3 2017JLL Cincinnati Industrial Outlook  Q3 2017
JLL Cincinnati Industrial Outlook Q3 2017
 
JLL Detroit Industrial Insight & Statistics - Q2 2016
JLL Detroit Industrial Insight & Statistics - Q2 2016JLL Detroit Industrial Insight & Statistics - Q2 2016
JLL Detroit Industrial Insight & Statistics - Q2 2016
 
JLL Cincinnati Industrial Outlook Q1 2021
JLL Cincinnati Industrial Outlook Q1 2021JLL Cincinnati Industrial Outlook Q1 2021
JLL Cincinnati Industrial Outlook Q1 2021
 
Jll cincinnati industrial outlook q1 2017
Jll cincinnati industrial outlook   q1 2017Jll cincinnati industrial outlook   q1 2017
Jll cincinnati industrial outlook q1 2017
 
JLL Cleveland Industrial Outlook: Q1 2017
JLL Cleveland Industrial Outlook: Q1 2017JLL Cleveland Industrial Outlook: Q1 2017
JLL Cleveland Industrial Outlook: Q1 2017
 
JLL - Tampa Bay 2018 Q2 Industrial Outlook
JLL - Tampa Bay 2018 Q2 Industrial OutlookJLL - Tampa Bay 2018 Q2 Industrial Outlook
JLL - Tampa Bay 2018 Q2 Industrial Outlook
 
Q3 2014 industrial market report
Q3 2014 industrial market reportQ3 2014 industrial market report
Q3 2014 industrial market report
 
JLL Detroit Industrial Insight & Statistics - Q3 2016
JLL Detroit Industrial Insight & Statistics - Q3 2016JLL Detroit Industrial Insight & Statistics - Q3 2016
JLL Detroit Industrial Insight & Statistics - Q3 2016
 
JLL Pittsburgh Industrial Insight & Statistics - Q4 2020
JLL Pittsburgh Industrial Insight & Statistics - Q4 2020JLL Pittsburgh Industrial Insight & Statistics - Q4 2020
JLL Pittsburgh Industrial Insight & Statistics - Q4 2020
 

More from Tobiah Bilski

Pittsburgh Office Insight & Stats Q1 2022
Pittsburgh Office Insight & Stats Q1 2022Pittsburgh Office Insight & Stats Q1 2022
Pittsburgh Office Insight & Stats Q1 2022Tobiah Bilski
 
Pittsburgh Office Insight & Stats Q4 2021
Pittsburgh Office Insight & Stats Q4 2021Pittsburgh Office Insight & Stats Q4 2021
Pittsburgh Office Insight & Stats Q4 2021Tobiah Bilski
 
JLL Pittsburgh Office Insight & Statistics - Q2 2021
JLL Pittsburgh Office Insight & Statistics - Q2 2021JLL Pittsburgh Office Insight & Statistics - Q2 2021
JLL Pittsburgh Office Insight & Statistics - Q2 2021Tobiah Bilski
 
JLL Pittsburgh Office Insight & Statistics - Q1 2021
JLL Pittsburgh Office Insight & Statistics - Q1 2021JLL Pittsburgh Office Insight & Statistics - Q1 2021
JLL Pittsburgh Office Insight & Statistics - Q1 2021Tobiah Bilski
 
JLL Pittsburgh Industrial Insight & Statistics - Q2 2020
JLL Pittsburgh Industrial Insight & Statistics - Q2 2020JLL Pittsburgh Industrial Insight & Statistics - Q2 2020
JLL Pittsburgh Industrial Insight & Statistics - Q2 2020Tobiah Bilski
 
JLL Pittsburgh Office Insight & Statistics - Q2 2020
JLL Pittsburgh Office Insight & Statistics - Q2 2020JLL Pittsburgh Office Insight & Statistics - Q2 2020
JLL Pittsburgh Office Insight & Statistics - Q2 2020Tobiah Bilski
 
JLL Pittsburgh Office Insight & Statistics - Q1 2020
JLL Pittsburgh Office Insight & Statistics - Q1 2020JLL Pittsburgh Office Insight & Statistics - Q1 2020
JLL Pittsburgh Office Insight & Statistics - Q1 2020Tobiah Bilski
 
JLL Pittsburgh Office Insight & Statistics - Q4 2019
JLL Pittsburgh Office Insight & Statistics - Q4 2019JLL Pittsburgh Office Insight & Statistics - Q4 2019
JLL Pittsburgh Office Insight & Statistics - Q4 2019Tobiah Bilski
 
JLL Pittsburgh Office Insight & Statistics - Q3 2019
 JLL Pittsburgh Office Insight & Statistics - Q3 2019 JLL Pittsburgh Office Insight & Statistics - Q3 2019
JLL Pittsburgh Office Insight & Statistics - Q3 2019Tobiah Bilski
 
JLL Pittsburgh Industrial Insight & Statistics - Q2 2019
JLL Pittsburgh Industrial Insight & Statistics - Q2 2019JLL Pittsburgh Industrial Insight & Statistics - Q2 2019
JLL Pittsburgh Industrial Insight & Statistics - Q2 2019Tobiah Bilski
 
JLL Pittsburgh Office Insight & Statistics - Q2 2019
JLL Pittsburgh Office Insight & Statistics - Q2 2019JLL Pittsburgh Office Insight & Statistics - Q2 2019
JLL Pittsburgh Office Insight & Statistics - Q2 2019Tobiah Bilski
 
JLL Pittsburgh Office Insight & Statistics - Q1 2019
JLL Pittsburgh Office Insight & Statistics - Q1 2019JLL Pittsburgh Office Insight & Statistics - Q1 2019
JLL Pittsburgh Office Insight & Statistics - Q1 2019Tobiah Bilski
 
JLL Pittsburgh Office Insight & Statistics - Q4 2018
JLL Pittsburgh Office Insight & Statistics - Q4 2018JLL Pittsburgh Office Insight & Statistics - Q4 2018
JLL Pittsburgh Office Insight & Statistics - Q4 2018Tobiah Bilski
 
JLL Pittsburgh Office Insight & Statistics - Q3 2018
JLL Pittsburgh Office Insight & Statistics - Q3 2018JLL Pittsburgh Office Insight & Statistics - Q3 2018
JLL Pittsburgh Office Insight & Statistics - Q3 2018Tobiah Bilski
 
JLL Pittsburgh Office Insight & Statistics - Q2 2018
JLL Pittsburgh Office Insight & Statistics - Q2 2018 JLL Pittsburgh Office Insight & Statistics - Q2 2018
JLL Pittsburgh Office Insight & Statistics - Q2 2018 Tobiah Bilski
 

More from Tobiah Bilski (15)

Pittsburgh Office Insight & Stats Q1 2022
Pittsburgh Office Insight & Stats Q1 2022Pittsburgh Office Insight & Stats Q1 2022
Pittsburgh Office Insight & Stats Q1 2022
 
Pittsburgh Office Insight & Stats Q4 2021
Pittsburgh Office Insight & Stats Q4 2021Pittsburgh Office Insight & Stats Q4 2021
Pittsburgh Office Insight & Stats Q4 2021
 
JLL Pittsburgh Office Insight & Statistics - Q2 2021
JLL Pittsburgh Office Insight & Statistics - Q2 2021JLL Pittsburgh Office Insight & Statistics - Q2 2021
JLL Pittsburgh Office Insight & Statistics - Q2 2021
 
JLL Pittsburgh Office Insight & Statistics - Q1 2021
JLL Pittsburgh Office Insight & Statistics - Q1 2021JLL Pittsburgh Office Insight & Statistics - Q1 2021
JLL Pittsburgh Office Insight & Statistics - Q1 2021
 
JLL Pittsburgh Industrial Insight & Statistics - Q2 2020
JLL Pittsburgh Industrial Insight & Statistics - Q2 2020JLL Pittsburgh Industrial Insight & Statistics - Q2 2020
JLL Pittsburgh Industrial Insight & Statistics - Q2 2020
 
JLL Pittsburgh Office Insight & Statistics - Q2 2020
JLL Pittsburgh Office Insight & Statistics - Q2 2020JLL Pittsburgh Office Insight & Statistics - Q2 2020
JLL Pittsburgh Office Insight & Statistics - Q2 2020
 
JLL Pittsburgh Office Insight & Statistics - Q1 2020
JLL Pittsburgh Office Insight & Statistics - Q1 2020JLL Pittsburgh Office Insight & Statistics - Q1 2020
JLL Pittsburgh Office Insight & Statistics - Q1 2020
 
JLL Pittsburgh Office Insight & Statistics - Q4 2019
JLL Pittsburgh Office Insight & Statistics - Q4 2019JLL Pittsburgh Office Insight & Statistics - Q4 2019
JLL Pittsburgh Office Insight & Statistics - Q4 2019
 
JLL Pittsburgh Office Insight & Statistics - Q3 2019
 JLL Pittsburgh Office Insight & Statistics - Q3 2019 JLL Pittsburgh Office Insight & Statistics - Q3 2019
JLL Pittsburgh Office Insight & Statistics - Q3 2019
 
JLL Pittsburgh Industrial Insight & Statistics - Q2 2019
JLL Pittsburgh Industrial Insight & Statistics - Q2 2019JLL Pittsburgh Industrial Insight & Statistics - Q2 2019
JLL Pittsburgh Industrial Insight & Statistics - Q2 2019
 
JLL Pittsburgh Office Insight & Statistics - Q2 2019
JLL Pittsburgh Office Insight & Statistics - Q2 2019JLL Pittsburgh Office Insight & Statistics - Q2 2019
JLL Pittsburgh Office Insight & Statistics - Q2 2019
 
JLL Pittsburgh Office Insight & Statistics - Q1 2019
JLL Pittsburgh Office Insight & Statistics - Q1 2019JLL Pittsburgh Office Insight & Statistics - Q1 2019
JLL Pittsburgh Office Insight & Statistics - Q1 2019
 
JLL Pittsburgh Office Insight & Statistics - Q4 2018
JLL Pittsburgh Office Insight & Statistics - Q4 2018JLL Pittsburgh Office Insight & Statistics - Q4 2018
JLL Pittsburgh Office Insight & Statistics - Q4 2018
 
JLL Pittsburgh Office Insight & Statistics - Q3 2018
JLL Pittsburgh Office Insight & Statistics - Q3 2018JLL Pittsburgh Office Insight & Statistics - Q3 2018
JLL Pittsburgh Office Insight & Statistics - Q3 2018
 
JLL Pittsburgh Office Insight & Statistics - Q2 2018
JLL Pittsburgh Office Insight & Statistics - Q2 2018 JLL Pittsburgh Office Insight & Statistics - Q2 2018
JLL Pittsburgh Office Insight & Statistics - Q2 2018
 

Recently uploaded

Purva Soukhyam in Guduvancheri Chennai.pdf
Purva Soukhyam in Guduvancheri Chennai.pdfPurva Soukhyam in Guduvancheri Chennai.pdf
Purva Soukhyam in Guduvancheri Chennai.pdfpritika141199
 
Shapoorji Pallonji Joyville Vista Pune | Spend Your Family Time Together
Shapoorji Pallonji Joyville Vista Pune | Spend Your Family Time TogetherShapoorji Pallonji Joyville Vista Pune | Spend Your Family Time Together
Shapoorji Pallonji Joyville Vista Pune | Spend Your Family Time Togetheraidasheikh47
 
2k Shots ≽ 9205541914 ≼ Call Girls In Sainik Farm (Delhi)
2k Shots ≽ 9205541914 ≼ Call Girls In Sainik Farm (Delhi)2k Shots ≽ 9205541914 ≼ Call Girls In Sainik Farm (Delhi)
2k Shots ≽ 9205541914 ≼ Call Girls In Sainik Farm (Delhi)Delhi Call girls
 
Magarpatta Nova Elegance Mundhwa Pune E-Brochure.pdf
Magarpatta Nova Elegance Mundhwa Pune  E-Brochure.pdfMagarpatta Nova Elegance Mundhwa Pune  E-Brochure.pdf
Magarpatta Nova Elegance Mundhwa Pune E-Brochure.pdfManishSaxena95
 
9990771857 Call Girls Dwarka Sector 9 Delhi (Call Girls ) Delhi
9990771857 Call Girls Dwarka Sector 9 Delhi (Call Girls ) Delhi9990771857 Call Girls Dwarka Sector 9 Delhi (Call Girls ) Delhi
9990771857 Call Girls Dwarka Sector 9 Delhi (Call Girls ) Delhidelhimodel235
 
Best Deal Virtual Space in Satya The Hive Tata Zudio 750 Sqft 1.89 Cr All inc...
Best Deal Virtual Space in Satya The Hive Tata Zudio 750 Sqft 1.89 Cr All inc...Best Deal Virtual Space in Satya The Hive Tata Zudio 750 Sqft 1.89 Cr All inc...
Best Deal Virtual Space in Satya The Hive Tata Zudio 750 Sqft 1.89 Cr All inc...ApartmentWala1
 
Kolte Patil Kharadi Pune E Brochure.pdf
Kolte Patil Kharadi Pune E  Brochure.pdfKolte Patil Kharadi Pune E  Brochure.pdf
Kolte Patil Kharadi Pune E Brochure.pdfabbu831446
 
Call Girls In Laxmi Nagar Delhi +91-8447779280! !Best Woman Seeking Man Escor...
Call Girls In Laxmi Nagar Delhi +91-8447779280! !Best Woman Seeking Man Escor...Call Girls In Laxmi Nagar Delhi +91-8447779280! !Best Woman Seeking Man Escor...
Call Girls In Laxmi Nagar Delhi +91-8447779280! !Best Woman Seeking Man Escor...asmaqueen5
 
Greater Vancouver Realtors Statistics Package April 2024
Greater Vancouver Realtors Statistics Package April 2024Greater Vancouver Realtors Statistics Package April 2024
Greater Vancouver Realtors Statistics Package April 2024VickyAulakh1
 
call girls in ganesh nagar Delhi 8264348440 ✅ call girls ❤️
call girls in ganesh nagar Delhi 8264348440 ✅ call girls ❤️call girls in ganesh nagar Delhi 8264348440 ✅ call girls ❤️
call girls in ganesh nagar Delhi 8264348440 ✅ call girls ❤️soniya singh
 
9990771857 Call Girls in Dwarka Sector 6 Delhi (Call Girls) Delhi
9990771857 Call Girls in Dwarka Sector 6 Delhi (Call Girls) Delhi9990771857 Call Girls in Dwarka Sector 6 Delhi (Call Girls) Delhi
9990771857 Call Girls in Dwarka Sector 6 Delhi (Call Girls) Delhidelhimodel235
 
Properties for Sale in Istanbul with Schools and Parks | Antalya Development
Properties for Sale in Istanbul with Schools and Parks | Antalya DevelopmentProperties for Sale in Istanbul with Schools and Parks | Antalya Development
Properties for Sale in Istanbul with Schools and Parks | Antalya DevelopmentAntalya Development
 
Call Girls In Mayur Vihar Delhi ☆↫8447779280 ❤Escorts Service In Delhi
Call Girls In Mayur Vihar Delhi ☆↫8447779280 ❤Escorts Service In DelhiCall Girls In Mayur Vihar Delhi ☆↫8447779280 ❤Escorts Service In Delhi
Call Girls In Mayur Vihar Delhi ☆↫8447779280 ❤Escorts Service In Delhiasmaqueen5
 
SVN Live 5.6.24 Weekly Property Broadcast
SVN Live 5.6.24 Weekly Property BroadcastSVN Live 5.6.24 Weekly Property Broadcast
SVN Live 5.6.24 Weekly Property BroadcastSVN International Corp.
 
Low Rate ↬Call Girls in Trilokpuri Delhi ↫8447779280}Escorts Service In Delhi
Low Rate ↬Call Girls in Trilokpuri Delhi ↫8447779280}Escorts Service In DelhiLow Rate ↬Call Girls in Trilokpuri Delhi ↫8447779280}Escorts Service In Delhi
Low Rate ↬Call Girls in Trilokpuri Delhi ↫8447779280}Escorts Service In Delhiasmaqueen5
 
Call Girls in Karkardooma Delhi +91 84487779280}Woman Seeking Man in Delhi NCR
Call Girls in Karkardooma Delhi +91 84487779280}Woman Seeking Man in Delhi NCRCall Girls in Karkardooma Delhi +91 84487779280}Woman Seeking Man in Delhi NCR
Call Girls in Karkardooma Delhi +91 84487779280}Woman Seeking Man in Delhi NCRasmaqueen5
 
3D Architectural Rendering Company by Panoram CGI
3D Architectural Rendering Company by Panoram CGI3D Architectural Rendering Company by Panoram CGI
3D Architectural Rendering Company by Panoram CGIPanoram CGI
 
M3M 129 E Brochure Noida Expressway, Sector 129, Noida
M3M 129 E Brochure Noida Expressway, Sector 129, NoidaM3M 129 E Brochure Noida Expressway, Sector 129, Noida
M3M 129 E Brochure Noida Expressway, Sector 129, Noidasarak0han45400
 
Majestique Viman Nagar Pune Brochure.pdf
Majestique Viman Nagar Pune Brochure.pdfMajestique Viman Nagar Pune Brochure.pdf
Majestique Viman Nagar Pune Brochure.pdfBabyrudram
 
Call girls in new Ashok NagarDelhi꧁ 8447779280꧂ Escort Service Women Seeking ...
Call girls in new Ashok NagarDelhi꧁ 8447779280꧂ Escort Service Women Seeking ...Call girls in new Ashok NagarDelhi꧁ 8447779280꧂ Escort Service Women Seeking ...
Call girls in new Ashok NagarDelhi꧁ 8447779280꧂ Escort Service Women Seeking ...asmaqueen5
 

Recently uploaded (20)

Purva Soukhyam in Guduvancheri Chennai.pdf
Purva Soukhyam in Guduvancheri Chennai.pdfPurva Soukhyam in Guduvancheri Chennai.pdf
Purva Soukhyam in Guduvancheri Chennai.pdf
 
Shapoorji Pallonji Joyville Vista Pune | Spend Your Family Time Together
Shapoorji Pallonji Joyville Vista Pune | Spend Your Family Time TogetherShapoorji Pallonji Joyville Vista Pune | Spend Your Family Time Together
Shapoorji Pallonji Joyville Vista Pune | Spend Your Family Time Together
 
2k Shots ≽ 9205541914 ≼ Call Girls In Sainik Farm (Delhi)
2k Shots ≽ 9205541914 ≼ Call Girls In Sainik Farm (Delhi)2k Shots ≽ 9205541914 ≼ Call Girls In Sainik Farm (Delhi)
2k Shots ≽ 9205541914 ≼ Call Girls In Sainik Farm (Delhi)
 
Magarpatta Nova Elegance Mundhwa Pune E-Brochure.pdf
Magarpatta Nova Elegance Mundhwa Pune  E-Brochure.pdfMagarpatta Nova Elegance Mundhwa Pune  E-Brochure.pdf
Magarpatta Nova Elegance Mundhwa Pune E-Brochure.pdf
 
9990771857 Call Girls Dwarka Sector 9 Delhi (Call Girls ) Delhi
9990771857 Call Girls Dwarka Sector 9 Delhi (Call Girls ) Delhi9990771857 Call Girls Dwarka Sector 9 Delhi (Call Girls ) Delhi
9990771857 Call Girls Dwarka Sector 9 Delhi (Call Girls ) Delhi
 
Best Deal Virtual Space in Satya The Hive Tata Zudio 750 Sqft 1.89 Cr All inc...
Best Deal Virtual Space in Satya The Hive Tata Zudio 750 Sqft 1.89 Cr All inc...Best Deal Virtual Space in Satya The Hive Tata Zudio 750 Sqft 1.89 Cr All inc...
Best Deal Virtual Space in Satya The Hive Tata Zudio 750 Sqft 1.89 Cr All inc...
 
Kolte Patil Kharadi Pune E Brochure.pdf
Kolte Patil Kharadi Pune E  Brochure.pdfKolte Patil Kharadi Pune E  Brochure.pdf
Kolte Patil Kharadi Pune E Brochure.pdf
 
Call Girls In Laxmi Nagar Delhi +91-8447779280! !Best Woman Seeking Man Escor...
Call Girls In Laxmi Nagar Delhi +91-8447779280! !Best Woman Seeking Man Escor...Call Girls In Laxmi Nagar Delhi +91-8447779280! !Best Woman Seeking Man Escor...
Call Girls In Laxmi Nagar Delhi +91-8447779280! !Best Woman Seeking Man Escor...
 
Greater Vancouver Realtors Statistics Package April 2024
Greater Vancouver Realtors Statistics Package April 2024Greater Vancouver Realtors Statistics Package April 2024
Greater Vancouver Realtors Statistics Package April 2024
 
call girls in ganesh nagar Delhi 8264348440 ✅ call girls ❤️
call girls in ganesh nagar Delhi 8264348440 ✅ call girls ❤️call girls in ganesh nagar Delhi 8264348440 ✅ call girls ❤️
call girls in ganesh nagar Delhi 8264348440 ✅ call girls ❤️
 
9990771857 Call Girls in Dwarka Sector 6 Delhi (Call Girls) Delhi
9990771857 Call Girls in Dwarka Sector 6 Delhi (Call Girls) Delhi9990771857 Call Girls in Dwarka Sector 6 Delhi (Call Girls) Delhi
9990771857 Call Girls in Dwarka Sector 6 Delhi (Call Girls) Delhi
 
Properties for Sale in Istanbul with Schools and Parks | Antalya Development
Properties for Sale in Istanbul with Schools and Parks | Antalya DevelopmentProperties for Sale in Istanbul with Schools and Parks | Antalya Development
Properties for Sale in Istanbul with Schools and Parks | Antalya Development
 
Call Girls In Mayur Vihar Delhi ☆↫8447779280 ❤Escorts Service In Delhi
Call Girls In Mayur Vihar Delhi ☆↫8447779280 ❤Escorts Service In DelhiCall Girls In Mayur Vihar Delhi ☆↫8447779280 ❤Escorts Service In Delhi
Call Girls In Mayur Vihar Delhi ☆↫8447779280 ❤Escorts Service In Delhi
 
SVN Live 5.6.24 Weekly Property Broadcast
SVN Live 5.6.24 Weekly Property BroadcastSVN Live 5.6.24 Weekly Property Broadcast
SVN Live 5.6.24 Weekly Property Broadcast
 
Low Rate ↬Call Girls in Trilokpuri Delhi ↫8447779280}Escorts Service In Delhi
Low Rate ↬Call Girls in Trilokpuri Delhi ↫8447779280}Escorts Service In DelhiLow Rate ↬Call Girls in Trilokpuri Delhi ↫8447779280}Escorts Service In Delhi
Low Rate ↬Call Girls in Trilokpuri Delhi ↫8447779280}Escorts Service In Delhi
 
Call Girls in Karkardooma Delhi +91 84487779280}Woman Seeking Man in Delhi NCR
Call Girls in Karkardooma Delhi +91 84487779280}Woman Seeking Man in Delhi NCRCall Girls in Karkardooma Delhi +91 84487779280}Woman Seeking Man in Delhi NCR
Call Girls in Karkardooma Delhi +91 84487779280}Woman Seeking Man in Delhi NCR
 
3D Architectural Rendering Company by Panoram CGI
3D Architectural Rendering Company by Panoram CGI3D Architectural Rendering Company by Panoram CGI
3D Architectural Rendering Company by Panoram CGI
 
M3M 129 E Brochure Noida Expressway, Sector 129, Noida
M3M 129 E Brochure Noida Expressway, Sector 129, NoidaM3M 129 E Brochure Noida Expressway, Sector 129, Noida
M3M 129 E Brochure Noida Expressway, Sector 129, Noida
 
Majestique Viman Nagar Pune Brochure.pdf
Majestique Viman Nagar Pune Brochure.pdfMajestique Viman Nagar Pune Brochure.pdf
Majestique Viman Nagar Pune Brochure.pdf
 
Call girls in new Ashok NagarDelhi꧁ 8447779280꧂ Escort Service Women Seeking ...
Call girls in new Ashok NagarDelhi꧁ 8447779280꧂ Escort Service Women Seeking ...Call girls in new Ashok NagarDelhi꧁ 8447779280꧂ Escort Service Women Seeking ...
Call girls in new Ashok NagarDelhi꧁ 8447779280꧂ Escort Service Women Seeking ...
 

JLL Pittsburgh Industrial Insight & Statistics - Q4 2016

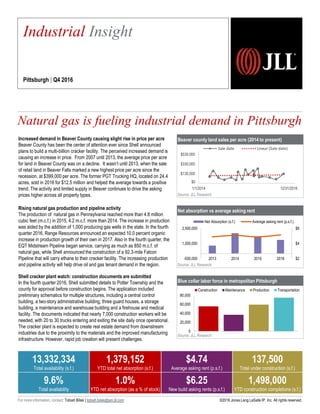
  • 1. Beaver county land sales per acre (2014 to present) Source: JLL Research Net absorption vs average asking rent Source: JLL Research Blue collar labor force in metropolitan Pittsburgh Source: JLL Research Increased demand in Beaver County causing slight rise in price per acre Beaver County has been the center of attention ever since Shell announced plans to build a multi-billion cracker facility. The perceived increased demand is causing an increase in price. From 2007 until 2013, the average price per acre for land in Beaver County was on a decline. It wasn’t until 2013, when the sale of retail land in Beaver Falls marked a new highest price per acre since the recession, at $399,000 per acre. The former PGT Trucking HQ, located on 24.4 acres, sold in 2016 for $12.5 million and helped the average towards a positive trend. The activity and limited supply in Beaver continues to drive the asking prices higher across all property types. Rising natural gas production and pipeline activity The production of natural gas in Pennsylvania reached more than 4.8 million cubic feet (m.c.f.) in 2015, 4.2 m.c.f. more than 2014. The increase in production was aided by the addition of 1,000 producing gas wells in the state. In the fourth quarter 2016, Range Resources announced an expected 10.0 percent organic increase in production growth of their own in 2017. Also in the fourth quarter, the EQT Midstream Pipeline began service, carrying as much as 850 m.c.f. of natural gas, while Shell announced the construction of a 92.3-mile Falcon Pipeline that will carry ethane to their cracker facility. The increasing production and pipeline activity will help drive oil and gas tenant demand in the region. Shell cracker plant watch: construction documents are submitted In the fourth quarter 2016, Shell submitted details to Potter Township and the county for approval before construction begins. The application included preliminary schematics for multiple structures, including a central control building, a two-story administrative building, three guard houses, a storage building, a maintenance and warehouse building and a firehouse and medical facility. The documents indicated that nearly 7,000 construction workers will be needed, with 20 to 30 trucks entering and exiting the site daily once operational. The cracker plant is expected to create real estate demand from downstream industries due to the proximity to the materials and the improved manufacturing infrastructure. However, rapid job creation will present challenges. Industrial Insight Pittsburgh | Q4 2016 13,332,334 Total availability (s.f.) 3,209,629 YTD total net absorption (s.f.) $4.74 Average asking rent (p.s.f.) 137,500 Total under construction (s.f.) 9.6% Total availability 2.3% YTD net absorption (as a % of stock) $6.25 New build asking rents (p.s.f.) 1,498,000 YTD construction completions (s.f.) ©2016 Jones Lang LaSalle IP, Inc. All rights reserved.For more information, contact: Tobiah Bilski | tobiah.bilski@am.jll.com 770,000 191,000 260,000 Natural gas is fueling industrial demand in Pittsburgh -$20,000 $50,000 $120,000 $190,000 $260,000 1/1/2014 12/31/2016 Sale date Linear (Sale date) 0 20,000 40,000 60,000 80,000 Construction Maintenance Production Transportation $2 $4 $6 -500,000 1,000,000 2,500,000 4,000,000 2013 2014 2015 2016 Net Absorption (s.f.) Average asking rent (p.s.f.) $0
  • 2. Industrial Statistics Pittsburgh | Q4 2016 ©2016 Jones Lang LaSalle IP, Inc. All rights reserved.For more information, contact: Tobiah Bilski | tobiah.bilski@am.jll.com Inventory (s.f.) Quarterly absorption (s.f.) YTD absorption (s.f.) YTD absorption (% of stock) Total availability (s.f.) Total availability (%) Average asking rent ($ p.s.f.) YTD completions (s.f.) Under construction (s.f.) Warehouse & Distribution 82,851,096 509,286 2,127,012 2.6% 9,172,756 11.1% $5.19 1,442,000 137,500 Manufacturing 55,820,524 -81,247 1,082,617 1.9% 4,159,578 7.5% $3.76 56,000 0 Total 138,671,620 428,039 3,209,629 2.3% 13,332,334 9.6% $4.74 1,498,000 137,500 Flex / R&D 20,818,654 94,479 499,006 2.4% 2,706,800 13.0% $9.90 122,000 0 Warehouse & Distribution 4,495,997 84,573 379,805 8.4% 604,543 13.4% $5.39 0 0 Manufacturing 4,517,893 0 38,000 0.8% 157,200 3.5% $2.65 0 0 Total 9,013,890 84,573 417,805 4.6% 761,743 8.5% $4.82 0 0 Flex / R&D 579,085 16,736 26,475 4.6% 90,860 15.7% $10.00 0 0 Warehouse & Distribution 3,684,353 -240,200 -270,825 -7.4% 528,837 14.4% $4.23 135,000 0 Manufacturing 3,561,575 -55,400 16,100 0.5% 474,689 13.3% $1.20 56,000 0 Total 7,245,928 -295,600 -254,725 -3.5% 1,003,526 13.8% $2.80 191,000 0 Flex / R&D 386,900 0 0 0.0% 11,000 2.8% $10.00 0 0 Warehouse & Distribution 18,147,571 50,150 58,509 0.3% 1,346,986 7.4% $5.61 0 0 Manufacturing 4,823,443 5,700 268,796 5.6% 114,877 2.4% $7.15 0 0 Total 22,971,014 55,850 327,305 1.4% 1,461,863 6.4% $5.73 0 0 Flex / R&D 3,048,264 -28,073 27,109 0.9% 409,202 13.4% $8.10 0 0 Warehouse & Distribution 6,575,278 51,445 66,124 1.0% 590,260 9.0% $5.14 0 0 Manufacturing 4,570,489 0 9,981 0.2% 362,990 7.9% $3.67 0 0 Total 11,145,767 51,445 76,105 0.7% 953,250 8.6% $4.56 0 0 Flex / R&D 2,839,112 56,900 252,731 8.9% 582,672 20.5% $10.50 0 0 Warehouse & Distribution 6,216,992 -24,500 53,792 0.9% 345,011 5.5% $5.15 0 0 Manufacturing 6,408,774 -300 157,010 2.4% 123,836 1.9% $5.75 0 0 Total 12,625,766 -24,800 210,802 1.7% 468,847 3.7% $5.31 0 0 Flex / R&D 3,131,818 -33,362 38,587 1.2% 317,300 10.1% $10.75 0 0 Warehouse & Distribution 10,193,185 225,965 577,266 5.7% 867,138 8.5% $6.10 0 0 Manufacturing 3,479,451 0 58,300 1.7% 40,040 1.2% $4.00 0 0 Total 13,672,636 225,965 635,566 4.6% 907,178 6.6% $6.05 0 0 Flex / R&D 2,109,466 -4,651 14,367 0.7% 178,851 8.5% $12.37 0 0 Warehouse & Distribution 5,385,363 33,618 -62,741 -1.2% 507,982 9.4% $3.64 0 0 Manufacturing 8,033,856 0 -81,114 -1.0% 177,782 2.2% $6.75 0 0 Total 13,419,219 33,618 -143,855 -1.1% 685,764 5.1% $4.48 0 0 Flex / R&D 1,634,737 22,676 51,186 3.1% 85,888 5.3% $12.37 0 0 Warehouse & Distribution 5,424,228 120,675 404,905 7.5% 1,791,541 33.0% $5.04 0 0 Manufacturing 4,716,380 -114,650 32,375 0.7% 345,000 7.3% $4.95 0 0 Total 10,140,608 6,025 437,280 4.3% 2,136,541 21.1% $5.03 0 0 Flex / R&D 1,407,932 -15,078 -120,939 -8.6% 318,787 22.6% $9.00 0 0 Warehouse & Distribution 10,561,216 253,207 778,297 7.4% 1,072,964 10.2% $6.42 80,000 100,000 Manufacturing 2,749,553 0 4,172 0.2% 159,916 5.8% $5.00 0 0 Total 13,310,769 253,207 782,469 5.9% 1,232,880 9.3% $6.24 80,000 100,000 Flex / R&D 3,257,885 89,331 145,062 4.5% 443,991 13.6% $12.59 122,000 0 Warehouse & Distribution 12,166,913 -45,647 141,880 1.2% 1,517,494 12.5% $4.39 1,227,000 37,500 Manufacturing 12,959,110 83,403 578,997 4.5% 2,203,248 17.0% $3.60 0 0 Total 25,126,023 37,756 720,877 2.9% 3,720,742 14.8% $3.92 1,227,000 37,500 Flex / R&D 2,423,455 -10,000 64,428 2.7% 268,249 11.1% $4.77 0 0 Market Totals Beaver County Butler County Downtown East Northeast Northwest South Washington County West Westmoreland County