SlideShare a Scribd company logo
1 of 2
Download to read offline
© 2017 Jones Lang LaSalle IP, Inc. All rights reserved. All information contained herein is from sources deemed reliable; however, no representation or warranty is made to the accuracy thereof.
Q4 2017
Industrial Insight
Another year comes to a close with positive absorption and lower vacancy. In
general, industrial real estate in the region continues to perform steadily,
however typical deal size is smaller compared to first-tier markets. A case in
point would be Imperial Business Park’s newly developed 100,000 square foot
speculative warehouse that has been absorbed by three separate tenants.
Traditionally, developers in Pittsburgh limit the speculative development to
around 100,000 square feet or lower. Examples of the smaller industrial flex /
warehouse development are still present, like Sampson Morris’s 66,000
square foot warehouse currently under construction at West Pittsburgh
Business Park and Buncher’s 83,000 square foot warehouse at Findlay
Industrial Park. However, the modern economy is now being influenced
heavily by ecommerce and thus is requiring larger buildings in the first-tier
markets. Keeping up with national trends, Pittsburgh developers are going
bigger and are competing for first-mover advantage on the new larger
buildings. Pittsburgh will be tested by the market’s ability to absorb larger
speculative developments, similar to the 265,500 square foot warehouse at
Clinton Commerce Center and the 220,000 square foot Jackson Distribution
Center. In the fourth quarter, site development for the recently announced
507,000 square foot warehouse at Starpointe Business Park commenced. This
facility has been reported to be for a single occupier and may signal that
national trends are feasible in the Pittsburgh industrial market.
Outlook
Coal and natural gas producers are both projecting increases in production
for the coming years. Specific to natural gas, increased production means
increased need for ethane energy storage, especially due to the burgeoning
petrochemical industry in Pittsburgh. By having storage available, it will allow
more companies like Shell, as well as more midstream and downstream
occupiers, to invest in the region and absorb the new development.
Fundamentals Forecast
YTD net absorption 1,700,883 s.f. â–˛
QTD net absorption -207,987 s.f. â–˛
Under construction 1,284,000 s.f. â–˛
Total vacancy 8.4% â–Ľ
Average asking rent (NNN) $5.36 p.s.f. â–˛
Tenant improvements Stable â–
-500,000
1,500,000
3,500,000
2013 2014 2015 2016 YTD
2017
Supply and demand (s.f.) Net absorption
Deliveries
Pittsburgh’s New Year’s resolution for industrial growth
is to attract larger tenants.
12.4% 12.4% 11.8%
9.6%
8.4%
2013 2014 2015 2016 YTD 2017
Total vacancy
For more information, contact: Tobiah Bilski | tobiah.bilski@am.jll.com
• As the fourth quarter closes, vacancy rates for 2017 end at a five year low
of 8.4 percent.
• Is energy making a comeback in Pittsburgh? Activity around Washington
County is suggesting yes.
• The typical warehouse transaction remains between 20,000 and 40,000
square feet.
$0.00
$1.00
$2.00
$3.00
$4.00
$5.00
$6.00
2013 2014 2015 2016 2017
Average asking rents ($/s.f.)
W&D Manufacturing
© 2017 Jones Lang LaSalle IP, Inc. All rights reserved. All information contained herein is from sources deemed reliable; however, no representation or warranty is made to the accuracy thereof.
Q4 2017
Industrial Statistics
For more information, contact: Tobiah Bilski | tobiah.bilski@am.jll.com
Inventory
(s.f.)
Quarterly
absorption
(s.f.)
YTD absorption
(s.f.)
YTD
absorption
(% of stock)
Total
availability
(s.f.)
Total
availability
(%)
Average
asking rent
($ p.s.f.)
Quarterly
completions
(s.f.)
YTD
completions
(s.f.)
Under
construction
(s.f.)
83,196,656 93,197 1,341,934 1.6% 7,949,765 9.6% $5.19 156,864 559,864 1,289,000
Manufacturing 55,600,717 -301,184 358,949 0.6% 3,770,029 6.8% $5.71 0 0 0
Total 138,797,373 -207,987 1,700,883 1.2% 11,719,794 8.4% $5.36 156,864 559,864 1,289,000
Flex / R&D 21,959,091 226,727 335,121 1.5% 2,694,343 12.3% $9.99 0 0 0
Beaver County
4,525,107 63,018 -55,286 -1.2% 631,948 14.0% $5.58 0 0 416,000
Manufacturing 4,748,578 -315,900 -245,000 -5.2% 402,200 8.5% $6.00 0 0 0
Total 9,273,685 -252,882 -300,286 -3.2% 1,034,148 11.2% $5.74 0 0 416,000
Flex / R&D 600,520 -17,735 -32,295 -5.4% 126,655 21.1% $10.00 0 0 0
Butler County
3,864,110 -13,640 -113,023 -2.9% 651,160 16.9% $3.55 0 0 220,000
Manufacturing 3,586,191 34,825 68,809 1.9% 410,180 11.4% $2.14 0 0 0
Total 7,450,301 21,185 -44,214 -0.6% 1,061,340 14.2% $3.01 0 0 220,000
Flex / R&D 386,900 -4,644 -4,644 -1.2% 15,644 4.0% $10.00 0 0 0
Downtown
17,850,155 113,967 225,268 1.3% 1,174,938 6.6% $5.44 0 0 0
Manufacturing 4,195,484 -7,284 51,893 1.2% 44,384 1.1% $7.18 0 0 0
Total 22,045,639 106,683 277,161 1.3% 1,219,322 5.5% $5.50 0 0 0
Flex / R&D 3,216,725 6,997 29,907 0.9% 412,010 12.8% $8.69 0 0 0
East
6,543,686 10,924 99,742 1.5% 489,929 7.5% $8.82 0 0 0
Manufacturing 4,588,748 0 -105,800 -2.3% 442,190 9.6% $3.25 0 0 0
Total 11,132,434 10,924 -6,058 -0.1% 932,119 8.4% $6.18 0 0 0
Flex / R&D 3,112,912 11,700 150,252 4.8% 485,502 15.6% $10.49 0 0 0
Northeast
5,870,737 -19,280 82,515 1.4% 211,564 3.6% $5.50 0 0 0
Manufacturing 6,408,774 200 -81,054 -1.3% 204,890 3.2% $5.75 0 0 0
Total 12,279,511 -19,080 1,461 0.0% 416,454 3.4% $5.62 0 0 0
Flex / R&D 3,261,718 29,656 61,080 1.9% 235,434 7.2% $10.75 0 0 0
Northwest
10,325,348 109,330 379,851 3.7% 597,753 5.8% $6.08 0 0 0
Manufacturing 3,478,558 0 -62,000 -1.8% 102,040 2.9% $9.95 0 0 0
Total 13,803,906 109,330 317,851 2.3% 699,793 5.1% $6.65 0 0 0
Flex / R&D 2,239,369 46,691 79,454 3.5% 153,356 6.8% $16.50 0 0 0
South
5,740,769 12,592 -23,780 -0.4% 509,948 8.9% $3.73 0 0 0
Manufacturing 8,033,579 0 -79,831 -1.0% 257,613 3.2% $5.73 0 0 0
Total 13,774,348 12,592 -103,611 -0.8% 767,561 5.6% $4.43 0 0 0
Flex / R&D 1,731,137 -7,278 27,006 1.6% 130,882 7.6% $12.37 0 0 0
Washington County
5,563,429 21,109 354,630 6.4% 1,315,077 23.6% $4.91 0 0 0
Manufacturing 4,715,323 -65,525 -114,475 -2.4% 530,575 11.3% $6.31 0 0 0
Total 10,278,752 -44,416 240,155 2.3% 1,845,652 18.0% $5.31 0 0 0
Flex / R&D 1,485,473 73,462 96,304 6.5% 236,994 16.0% $9.00 0 0 0
West
10,654,588 -48,975 263,210 2.5% 1,020,781 9.6% $5.76 156,864 522,364 573,000
Manufacturing 2,847,633 0 26,416 0.9% 146,000 5.1% $6.33 0 0 0
Total 13,502,221 -48,975 289,626 2.1% 1,166,781 8.6% $5.83 156,864 522,364 573,000
Flex / R&D 3,612,743 98,808 -99,692 -2.8% 657,366 18.2% $10.59 0 0 0
Westmoreland County
12,258,727 -155,848 128,807 1.1% 1,346,667 11.0% $4.09 0 37,500 80,000
Manufacturing 12,997,849 52,500 899,991 6.9% 1,229,957 9.5% $6.95 0 0 0
Total 25,256,576 -103,348 1,028,798 4.1% 2,576,624 10.2% $5.52 0 37,500 80,000
Flex / R&D 2,311,594 -10,930 27,749 1.2% 240,500 10.4% $5.38 0 0 0
Warehouse & Distribution
Pittsburgh Totals
Warehouse & Distribution

More Related Content

What's hot

JLL Pittsburgh Industrial Insight & Statistics - Q3 2017
JLL Pittsburgh Industrial Insight & Statistics - Q3 2017JLL Pittsburgh Industrial Insight & Statistics - Q3 2017
JLL Pittsburgh Industrial Insight & Statistics - Q3 2017Tobiah Bilski
 
JLL Pittsburgh Industrial Insight & Statistics - Q4 2016
JLL Pittsburgh Industrial Insight & Statistics - Q4 2016JLL Pittsburgh Industrial Insight & Statistics - Q4 2016
JLL Pittsburgh Industrial Insight & Statistics - Q4 2016Tobiah Bilski
 
JLL Pittsburgh Industrial Insight & Statistics - Q3 2020
JLL Pittsburgh Industrial Insight & Statistics - Q3 2020JLL Pittsburgh Industrial Insight & Statistics - Q3 2020
JLL Pittsburgh Industrial Insight & Statistics - Q3 2020Tobiah Bilski
 
JLL Pittsburgh Industrial Insight & Statistics - Q2 2018
JLL Pittsburgh Industrial Insight & Statistics - Q2 2018JLL Pittsburgh Industrial Insight & Statistics - Q2 2018
JLL Pittsburgh Industrial Insight & Statistics - Q2 2018Tobiah Bilski
 
JLL Pittsburgh Industrial Insight & Statistics - Q3 2016
JLL Pittsburgh Industrial Insight & Statistics - Q3 2016JLL Pittsburgh Industrial Insight & Statistics - Q3 2016
JLL Pittsburgh Industrial Insight & Statistics - Q3 2016Tobiah Bilski
 
JLL Pittsburgh Industrial Insight & Statistics - Q2 2020
JLL Pittsburgh Industrial Insight & Statistics - Q2 2020JLL Pittsburgh Industrial Insight & Statistics - Q2 2020
JLL Pittsburgh Industrial Insight & Statistics - Q2 2020Tobiah Bilski
 
JLL Pittsburgh Industrial Insight & Statistics - Q4 2018
JLL Pittsburgh Industrial Insight & Statistics - Q4 2018JLL Pittsburgh Industrial Insight & Statistics - Q4 2018
JLL Pittsburgh Industrial Insight & Statistics - Q4 2018Tobiah Bilski
 
JLL Pittsburgh Industrial Insight & Statistics - Q3 2018
JLL Pittsburgh Industrial Insight & Statistics - Q3 2018JLL Pittsburgh Industrial Insight & Statistics - Q3 2018
JLL Pittsburgh Industrial Insight & Statistics - Q3 2018Tobiah Bilski
 
JLL Pittsburgh Industrial Insight & Statistics - Q1 2018
JLL Pittsburgh Industrial Insight & Statistics - Q1 2018JLL Pittsburgh Industrial Insight & Statistics - Q1 2018
JLL Pittsburgh Industrial Insight & Statistics - Q1 2018Tobiah Bilski
 
JLL Cleveland Industrial Outlook: Q4 2018
JLL Cleveland Industrial Outlook: Q4 2018JLL Cleveland Industrial Outlook: Q4 2018
JLL Cleveland Industrial Outlook: Q4 2018Andrew Batson
 
JLL Cleveland Industrial Outlook: Q4 2018
JLL Cleveland Industrial Outlook: Q4 2018JLL Cleveland Industrial Outlook: Q4 2018
JLL Cleveland Industrial Outlook: Q4 2018Andrew Batson
 
JLL Pittsburgh Office Outlook - Q4 2015
JLL Pittsburgh Office Outlook - Q4 2015JLL Pittsburgh Office Outlook - Q4 2015
JLL Pittsburgh Office Outlook - Q4 2015Andrew Batson
 
JLL Pittsburgh Industrial Insight & Statistics - Q1 2019
JLL Pittsburgh Industrial Insight & Statistics - Q1 2019JLL Pittsburgh Industrial Insight & Statistics - Q1 2019
JLL Pittsburgh Industrial Insight & Statistics - Q1 2019Tobiah Bilski
 
JLL Cleveland Industrial Outlook: Q1 2019
JLL Cleveland Industrial Outlook: Q1 2019JLL Cleveland Industrial Outlook: Q1 2019
JLL Cleveland Industrial Outlook: Q1 2019Andrew Batson
 
JLL West Michigan Industrial Insight & Statistics - Q2 2019
JLL West Michigan Industrial Insight & Statistics - Q2 2019JLL West Michigan Industrial Insight & Statistics - Q2 2019
JLL West Michigan Industrial Insight & Statistics - Q2 2019Harrison West
 
JLL West Michigan Industrial Insight & Statistics - Q1 2020
JLL West Michigan Industrial Insight & Statistics - Q1 2020JLL West Michigan Industrial Insight & Statistics - Q1 2020
JLL West Michigan Industrial Insight & Statistics - Q1 2020Harrison West
 
JLL Detroit Industrial Insight & Statistics - Q2 2017
JLL Detroit Industrial Insight & Statistics - Q2 2017JLL Detroit Industrial Insight & Statistics - Q2 2017
JLL Detroit Industrial Insight & Statistics - Q2 2017Harrison West
 
JLL Detroit Industrial Insight & Statistics - Q3 2017
JLL Detroit Industrial Insight & Statistics - Q3 2017JLL Detroit Industrial Insight & Statistics - Q3 2017
JLL Detroit Industrial Insight & Statistics - Q3 2017Harrison West
 
JLL West Michigan Industrial Insight & Statistics - Q1 2019
JLL West Michigan Industrial Insight & Statistics - Q1 2019JLL West Michigan Industrial Insight & Statistics - Q1 2019
JLL West Michigan Industrial Insight & Statistics - Q1 2019Harrison West
 
JLL Pittsburgh Industrial Insight & Statistics - Q1 2020
JLL Pittsburgh Industrial Insight & Statistics - Q1 2020JLL Pittsburgh Industrial Insight & Statistics - Q1 2020
JLL Pittsburgh Industrial Insight & Statistics - Q1 2020Tobiah Bilski
 

What's hot (20)

JLL Pittsburgh Industrial Insight & Statistics - Q3 2017
JLL Pittsburgh Industrial Insight & Statistics - Q3 2017JLL Pittsburgh Industrial Insight & Statistics - Q3 2017
JLL Pittsburgh Industrial Insight & Statistics - Q3 2017
 
JLL Pittsburgh Industrial Insight & Statistics - Q4 2016
JLL Pittsburgh Industrial Insight & Statistics - Q4 2016JLL Pittsburgh Industrial Insight & Statistics - Q4 2016
JLL Pittsburgh Industrial Insight & Statistics - Q4 2016
 
JLL Pittsburgh Industrial Insight & Statistics - Q3 2020
JLL Pittsburgh Industrial Insight & Statistics - Q3 2020JLL Pittsburgh Industrial Insight & Statistics - Q3 2020
JLL Pittsburgh Industrial Insight & Statistics - Q3 2020
 
JLL Pittsburgh Industrial Insight & Statistics - Q2 2018
JLL Pittsburgh Industrial Insight & Statistics - Q2 2018JLL Pittsburgh Industrial Insight & Statistics - Q2 2018
JLL Pittsburgh Industrial Insight & Statistics - Q2 2018
 
JLL Pittsburgh Industrial Insight & Statistics - Q3 2016
JLL Pittsburgh Industrial Insight & Statistics - Q3 2016JLL Pittsburgh Industrial Insight & Statistics - Q3 2016
JLL Pittsburgh Industrial Insight & Statistics - Q3 2016
 
JLL Pittsburgh Industrial Insight & Statistics - Q2 2020
JLL Pittsburgh Industrial Insight & Statistics - Q2 2020JLL Pittsburgh Industrial Insight & Statistics - Q2 2020
JLL Pittsburgh Industrial Insight & Statistics - Q2 2020
 
JLL Pittsburgh Industrial Insight & Statistics - Q4 2018
JLL Pittsburgh Industrial Insight & Statistics - Q4 2018JLL Pittsburgh Industrial Insight & Statistics - Q4 2018
JLL Pittsburgh Industrial Insight & Statistics - Q4 2018
 
JLL Pittsburgh Industrial Insight & Statistics - Q3 2018
JLL Pittsburgh Industrial Insight & Statistics - Q3 2018JLL Pittsburgh Industrial Insight & Statistics - Q3 2018
JLL Pittsburgh Industrial Insight & Statistics - Q3 2018
 
JLL Pittsburgh Industrial Insight & Statistics - Q1 2018
JLL Pittsburgh Industrial Insight & Statistics - Q1 2018JLL Pittsburgh Industrial Insight & Statistics - Q1 2018
JLL Pittsburgh Industrial Insight & Statistics - Q1 2018
 
JLL Cleveland Industrial Outlook: Q4 2018
JLL Cleveland Industrial Outlook: Q4 2018JLL Cleveland Industrial Outlook: Q4 2018
JLL Cleveland Industrial Outlook: Q4 2018
 
JLL Cleveland Industrial Outlook: Q4 2018
JLL Cleveland Industrial Outlook: Q4 2018JLL Cleveland Industrial Outlook: Q4 2018
JLL Cleveland Industrial Outlook: Q4 2018
 
JLL Pittsburgh Office Outlook - Q4 2015
JLL Pittsburgh Office Outlook - Q4 2015JLL Pittsburgh Office Outlook - Q4 2015
JLL Pittsburgh Office Outlook - Q4 2015
 
JLL Pittsburgh Industrial Insight & Statistics - Q1 2019
JLL Pittsburgh Industrial Insight & Statistics - Q1 2019JLL Pittsburgh Industrial Insight & Statistics - Q1 2019
JLL Pittsburgh Industrial Insight & Statistics - Q1 2019
 
JLL Cleveland Industrial Outlook: Q1 2019
JLL Cleveland Industrial Outlook: Q1 2019JLL Cleveland Industrial Outlook: Q1 2019
JLL Cleveland Industrial Outlook: Q1 2019
 
JLL West Michigan Industrial Insight & Statistics - Q2 2019
JLL West Michigan Industrial Insight & Statistics - Q2 2019JLL West Michigan Industrial Insight & Statistics - Q2 2019
JLL West Michigan Industrial Insight & Statistics - Q2 2019
 
JLL West Michigan Industrial Insight & Statistics - Q1 2020
JLL West Michigan Industrial Insight & Statistics - Q1 2020JLL West Michigan Industrial Insight & Statistics - Q1 2020
JLL West Michigan Industrial Insight & Statistics - Q1 2020
 
JLL Detroit Industrial Insight & Statistics - Q2 2017
JLL Detroit Industrial Insight & Statistics - Q2 2017JLL Detroit Industrial Insight & Statistics - Q2 2017
JLL Detroit Industrial Insight & Statistics - Q2 2017
 
JLL Detroit Industrial Insight & Statistics - Q3 2017
JLL Detroit Industrial Insight & Statistics - Q3 2017JLL Detroit Industrial Insight & Statistics - Q3 2017
JLL Detroit Industrial Insight & Statistics - Q3 2017
 
JLL West Michigan Industrial Insight & Statistics - Q1 2019
JLL West Michigan Industrial Insight & Statistics - Q1 2019JLL West Michigan Industrial Insight & Statistics - Q1 2019
JLL West Michigan Industrial Insight & Statistics - Q1 2019
 
JLL Pittsburgh Industrial Insight & Statistics - Q1 2020
JLL Pittsburgh Industrial Insight & Statistics - Q1 2020JLL Pittsburgh Industrial Insight & Statistics - Q1 2020
JLL Pittsburgh Industrial Insight & Statistics - Q1 2020
 

Similar to JLL Pittsburgh Industrial Insight & Statistics - Q4 201itt

JLL Cleveland Industrial Outlook: Q1 2017
JLL Cleveland Industrial Outlook: Q1 2017JLL Cleveland Industrial Outlook: Q1 2017
JLL Cleveland Industrial Outlook: Q1 2017Andrew Batson
 
Jll cincinnati industrial outlook q1 2017
Jll cincinnati industrial outlook   q1 2017Jll cincinnati industrial outlook   q1 2017
Jll cincinnati industrial outlook q1 2017Abby Armbruster
 
JLL Cincinnati Industrial Outlook Q3 2017
JLL Cincinnati Industrial Outlook  Q3 2017JLL Cincinnati Industrial Outlook  Q3 2017
JLL Cincinnati Industrial Outlook Q3 2017Abby Armbruster
 
JLL Cincinnati Industrial Outlook Q4 2017
JLL Cincinnati Industrial Outlook Q4 2017JLL Cincinnati Industrial Outlook Q4 2017
JLL Cincinnati Industrial Outlook Q4 2017Abby Armbruster
 
JLL Cleveland Industrial Outlook: Q3 2018
JLL Cleveland Industrial Outlook: Q3 2018JLL Cleveland Industrial Outlook: Q3 2018
JLL Cleveland Industrial Outlook: Q3 2018Andrew Batson
 
JLL Columbus Industrial Outlook: Q1 2017
JLL Columbus Industrial Outlook: Q1 2017JLL Columbus Industrial Outlook: Q1 2017
JLL Columbus Industrial Outlook: Q1 2017Andrew Batson
 
JLL Cincinnati Industrial Outlook - Q3 2016
JLL Cincinnati Industrial Outlook - Q3 2016JLL Cincinnati Industrial Outlook - Q3 2016
JLL Cincinnati Industrial Outlook - Q3 2016Ross Bratcher
 
JLL Detroit Industrial Insight & Statistics - Q2 2016
JLL Detroit Industrial Insight & Statistics - Q2 2016JLL Detroit Industrial Insight & Statistics - Q2 2016
JLL Detroit Industrial Insight & Statistics - Q2 2016Aaron Moore
 
JLL Pittsburgh Industrial Insight & Statistics - Q3 2021
JLL Pittsburgh Industrial Insight & Statistics - Q3 2021JLL Pittsburgh Industrial Insight & Statistics - Q3 2021
JLL Pittsburgh Industrial Insight & Statistics - Q3 2021Tobiah Bilski
 
JLL Pittsburgh Industrial Insight & Statistics - Q4 2020
JLL Pittsburgh Industrial Insight & Statistics - Q4 2020JLL Pittsburgh Industrial Insight & Statistics - Q4 2020
JLL Pittsburgh Industrial Insight & Statistics - Q4 2020Tobiah Bilski
 
JLL Pittsburgh Industrial Insight & Statistics - Q4 2021
JLL Pittsburgh Industrial Insight & Statistics - Q4 2021JLL Pittsburgh Industrial Insight & Statistics - Q4 2021
JLL Pittsburgh Industrial Insight & Statistics - Q4 2021Tobiah Bilski
 
JLL Pittsburgh Office Insight & Statistics - Q3 2017
JLL Pittsburgh Office Insight & Statistics - Q3 2017JLL Pittsburgh Office Insight & Statistics - Q3 2017
JLL Pittsburgh Office Insight & Statistics - Q3 2017Tobiah Bilski
 
JLL Cleveland Industrial Outlook Q3 2019
JLL Cleveland Industrial Outlook   Q3 2019JLL Cleveland Industrial Outlook   Q3 2019
JLL Cleveland Industrial Outlook Q3 2019Johnathan Miller
 
JLL Cleveland Industrial Outlook: Q3 2019
JLL Cleveland Industrial Outlook: Q3 2019JLL Cleveland Industrial Outlook: Q3 2019
JLL Cleveland Industrial Outlook: Q3 2019Johnathan Miller
 
JLL Cincinnati Industrial Outlook Q3 2020
JLL Cincinnati Industrial Outlook Q3 2020JLL Cincinnati Industrial Outlook Q3 2020
JLL Cincinnati Industrial Outlook Q3 2020Abby Armbruster
 
JLL Detroit Industrial Insight & Statistics - Q1 2017
JLL Detroit Industrial Insight & Statistics - Q1 2017JLL Detroit Industrial Insight & Statistics - Q1 2017
JLL Detroit Industrial Insight & Statistics - Q1 2017Harrison West
 
JLL Cleveland Industrial Outlook: Q4 2017
JLL Cleveland Industrial Outlook: Q4 2017JLL Cleveland Industrial Outlook: Q4 2017
JLL Cleveland Industrial Outlook: Q4 2017Andrew Batson
 

Similar to JLL Pittsburgh Industrial Insight & Statistics - Q4 201itt (17)

JLL Cleveland Industrial Outlook: Q1 2017
JLL Cleveland Industrial Outlook: Q1 2017JLL Cleveland Industrial Outlook: Q1 2017
JLL Cleveland Industrial Outlook: Q1 2017
 
Jll cincinnati industrial outlook q1 2017
Jll cincinnati industrial outlook   q1 2017Jll cincinnati industrial outlook   q1 2017
Jll cincinnati industrial outlook q1 2017
 
JLL Cincinnati Industrial Outlook Q3 2017
JLL Cincinnati Industrial Outlook  Q3 2017JLL Cincinnati Industrial Outlook  Q3 2017
JLL Cincinnati Industrial Outlook Q3 2017
 
JLL Cincinnati Industrial Outlook Q4 2017
JLL Cincinnati Industrial Outlook Q4 2017JLL Cincinnati Industrial Outlook Q4 2017
JLL Cincinnati Industrial Outlook Q4 2017
 
JLL Cleveland Industrial Outlook: Q3 2018
JLL Cleveland Industrial Outlook: Q3 2018JLL Cleveland Industrial Outlook: Q3 2018
JLL Cleveland Industrial Outlook: Q3 2018
 
JLL Columbus Industrial Outlook: Q1 2017
JLL Columbus Industrial Outlook: Q1 2017JLL Columbus Industrial Outlook: Q1 2017
JLL Columbus Industrial Outlook: Q1 2017
 
JLL Cincinnati Industrial Outlook - Q3 2016
JLL Cincinnati Industrial Outlook - Q3 2016JLL Cincinnati Industrial Outlook - Q3 2016
JLL Cincinnati Industrial Outlook - Q3 2016
 
JLL Detroit Industrial Insight & Statistics - Q2 2016
JLL Detroit Industrial Insight & Statistics - Q2 2016JLL Detroit Industrial Insight & Statistics - Q2 2016
JLL Detroit Industrial Insight & Statistics - Q2 2016
 
JLL Pittsburgh Industrial Insight & Statistics - Q3 2021
JLL Pittsburgh Industrial Insight & Statistics - Q3 2021JLL Pittsburgh Industrial Insight & Statistics - Q3 2021
JLL Pittsburgh Industrial Insight & Statistics - Q3 2021
 
JLL Pittsburgh Industrial Insight & Statistics - Q4 2020
JLL Pittsburgh Industrial Insight & Statistics - Q4 2020JLL Pittsburgh Industrial Insight & Statistics - Q4 2020
JLL Pittsburgh Industrial Insight & Statistics - Q4 2020
 
JLL Pittsburgh Industrial Insight & Statistics - Q4 2021
JLL Pittsburgh Industrial Insight & Statistics - Q4 2021JLL Pittsburgh Industrial Insight & Statistics - Q4 2021
JLL Pittsburgh Industrial Insight & Statistics - Q4 2021
 
JLL Pittsburgh Office Insight & Statistics - Q3 2017
JLL Pittsburgh Office Insight & Statistics - Q3 2017JLL Pittsburgh Office Insight & Statistics - Q3 2017
JLL Pittsburgh Office Insight & Statistics - Q3 2017
 
JLL Cleveland Industrial Outlook Q3 2019
JLL Cleveland Industrial Outlook   Q3 2019JLL Cleveland Industrial Outlook   Q3 2019
JLL Cleveland Industrial Outlook Q3 2019
 
JLL Cleveland Industrial Outlook: Q3 2019
JLL Cleveland Industrial Outlook: Q3 2019JLL Cleveland Industrial Outlook: Q3 2019
JLL Cleveland Industrial Outlook: Q3 2019
 
JLL Cincinnati Industrial Outlook Q3 2020
JLL Cincinnati Industrial Outlook Q3 2020JLL Cincinnati Industrial Outlook Q3 2020
JLL Cincinnati Industrial Outlook Q3 2020
 
JLL Detroit Industrial Insight & Statistics - Q1 2017
JLL Detroit Industrial Insight & Statistics - Q1 2017JLL Detroit Industrial Insight & Statistics - Q1 2017
JLL Detroit Industrial Insight & Statistics - Q1 2017
 
JLL Cleveland Industrial Outlook: Q4 2017
JLL Cleveland Industrial Outlook: Q4 2017JLL Cleveland Industrial Outlook: Q4 2017
JLL Cleveland Industrial Outlook: Q4 2017
 

More from Tobiah Bilski

Pittsburgh Office Insight & Stats Q1 2022
Pittsburgh Office Insight & Stats Q1 2022Pittsburgh Office Insight & Stats Q1 2022
Pittsburgh Office Insight & Stats Q1 2022Tobiah Bilski
 
Pittsburgh Office Insight & Stats Q4 2021
Pittsburgh Office Insight & Stats Q4 2021Pittsburgh Office Insight & Stats Q4 2021
Pittsburgh Office Insight & Stats Q4 2021Tobiah Bilski
 
JLL Pittsburgh Office Insight & Statistics - Q2 2021
JLL Pittsburgh Office Insight & Statistics - Q2 2021JLL Pittsburgh Office Insight & Statistics - Q2 2021
JLL Pittsburgh Office Insight & Statistics - Q2 2021Tobiah Bilski
 
JLL Pittsburgh Office Insight & Statistics - Q1 2021
JLL Pittsburgh Office Insight & Statistics - Q1 2021JLL Pittsburgh Office Insight & Statistics - Q1 2021
JLL Pittsburgh Office Insight & Statistics - Q1 2021Tobiah Bilski
 
JLL Pittsburgh Office Insight & Statistics - Q2 2020
JLL Pittsburgh Office Insight & Statistics - Q2 2020JLL Pittsburgh Office Insight & Statistics - Q2 2020
JLL Pittsburgh Office Insight & Statistics - Q2 2020Tobiah Bilski
 
JLL Pittsburgh Office Insight & Statistics - Q1 2020
JLL Pittsburgh Office Insight & Statistics - Q1 2020JLL Pittsburgh Office Insight & Statistics - Q1 2020
JLL Pittsburgh Office Insight & Statistics - Q1 2020Tobiah Bilski
 
JLL Pittsburgh Office Insight & Statistics - Q4 2019
JLL Pittsburgh Office Insight & Statistics - Q4 2019JLL Pittsburgh Office Insight & Statistics - Q4 2019
JLL Pittsburgh Office Insight & Statistics - Q4 2019Tobiah Bilski
 
JLL Pittsburgh Office Insight & Statistics - Q3 2019
 JLL Pittsburgh Office Insight & Statistics - Q3 2019 JLL Pittsburgh Office Insight & Statistics - Q3 2019
JLL Pittsburgh Office Insight & Statistics - Q3 2019Tobiah Bilski
 
JLL Pittsburgh Office Insight & Statistics - Q2 2019
JLL Pittsburgh Office Insight & Statistics - Q2 2019JLL Pittsburgh Office Insight & Statistics - Q2 2019
JLL Pittsburgh Office Insight & Statistics - Q2 2019Tobiah Bilski
 
JLL Pittsburgh Office Insight & Statistics - Q1 2019
JLL Pittsburgh Office Insight & Statistics - Q1 2019JLL Pittsburgh Office Insight & Statistics - Q1 2019
JLL Pittsburgh Office Insight & Statistics - Q1 2019Tobiah Bilski
 
JLL Pittsburgh Office Insight & Statistics - Q4 2018
JLL Pittsburgh Office Insight & Statistics - Q4 2018JLL Pittsburgh Office Insight & Statistics - Q4 2018
JLL Pittsburgh Office Insight & Statistics - Q4 2018Tobiah Bilski
 
JLL Pittsburgh Office Insight & Statistics - Q3 2018
JLL Pittsburgh Office Insight & Statistics - Q3 2018JLL Pittsburgh Office Insight & Statistics - Q3 2018
JLL Pittsburgh Office Insight & Statistics - Q3 2018Tobiah Bilski
 
JLL Pittsburgh Office Insight & Statistics - Q2 2018
JLL Pittsburgh Office Insight & Statistics - Q2 2018 JLL Pittsburgh Office Insight & Statistics - Q2 2018
JLL Pittsburgh Office Insight & Statistics - Q2 2018 Tobiah Bilski
 

More from Tobiah Bilski (13)

Pittsburgh Office Insight & Stats Q1 2022
Pittsburgh Office Insight & Stats Q1 2022Pittsburgh Office Insight & Stats Q1 2022
Pittsburgh Office Insight & Stats Q1 2022
 
Pittsburgh Office Insight & Stats Q4 2021
Pittsburgh Office Insight & Stats Q4 2021Pittsburgh Office Insight & Stats Q4 2021
Pittsburgh Office Insight & Stats Q4 2021
 
JLL Pittsburgh Office Insight & Statistics - Q2 2021
JLL Pittsburgh Office Insight & Statistics - Q2 2021JLL Pittsburgh Office Insight & Statistics - Q2 2021
JLL Pittsburgh Office Insight & Statistics - Q2 2021
 
JLL Pittsburgh Office Insight & Statistics - Q1 2021
JLL Pittsburgh Office Insight & Statistics - Q1 2021JLL Pittsburgh Office Insight & Statistics - Q1 2021
JLL Pittsburgh Office Insight & Statistics - Q1 2021
 
JLL Pittsburgh Office Insight & Statistics - Q2 2020
JLL Pittsburgh Office Insight & Statistics - Q2 2020JLL Pittsburgh Office Insight & Statistics - Q2 2020
JLL Pittsburgh Office Insight & Statistics - Q2 2020
 
JLL Pittsburgh Office Insight & Statistics - Q1 2020
JLL Pittsburgh Office Insight & Statistics - Q1 2020JLL Pittsburgh Office Insight & Statistics - Q1 2020
JLL Pittsburgh Office Insight & Statistics - Q1 2020
 
JLL Pittsburgh Office Insight & Statistics - Q4 2019
JLL Pittsburgh Office Insight & Statistics - Q4 2019JLL Pittsburgh Office Insight & Statistics - Q4 2019
JLL Pittsburgh Office Insight & Statistics - Q4 2019
 
JLL Pittsburgh Office Insight & Statistics - Q3 2019
 JLL Pittsburgh Office Insight & Statistics - Q3 2019 JLL Pittsburgh Office Insight & Statistics - Q3 2019
JLL Pittsburgh Office Insight & Statistics - Q3 2019
 
JLL Pittsburgh Office Insight & Statistics - Q2 2019
JLL Pittsburgh Office Insight & Statistics - Q2 2019JLL Pittsburgh Office Insight & Statistics - Q2 2019
JLL Pittsburgh Office Insight & Statistics - Q2 2019
 
JLL Pittsburgh Office Insight & Statistics - Q1 2019
JLL Pittsburgh Office Insight & Statistics - Q1 2019JLL Pittsburgh Office Insight & Statistics - Q1 2019
JLL Pittsburgh Office Insight & Statistics - Q1 2019
 
JLL Pittsburgh Office Insight & Statistics - Q4 2018
JLL Pittsburgh Office Insight & Statistics - Q4 2018JLL Pittsburgh Office Insight & Statistics - Q4 2018
JLL Pittsburgh Office Insight & Statistics - Q4 2018
 
JLL Pittsburgh Office Insight & Statistics - Q3 2018
JLL Pittsburgh Office Insight & Statistics - Q3 2018JLL Pittsburgh Office Insight & Statistics - Q3 2018
JLL Pittsburgh Office Insight & Statistics - Q3 2018
 
JLL Pittsburgh Office Insight & Statistics - Q2 2018
JLL Pittsburgh Office Insight & Statistics - Q2 2018 JLL Pittsburgh Office Insight & Statistics - Q2 2018
JLL Pittsburgh Office Insight & Statistics - Q2 2018
 

Recently uploaded

Call Girls in Model Town Delhi 💯Call Us 🔝8264348440🔝
Call Girls in Model Town Delhi 💯Call Us 🔝8264348440🔝Call Girls in Model Town Delhi 💯Call Us 🔝8264348440🔝
Call Girls in Model Town Delhi 💯Call Us 🔝8264348440🔝soniya singh
 
Call Girls in Sarai Kale Khan Delhi 💯Call Us 🔝8264348440🔝
Call Girls in Sarai Kale Khan Delhi 💯Call Us 🔝8264348440🔝Call Girls in Sarai Kale Khan Delhi 💯Call Us 🔝8264348440🔝
Call Girls in Sarai Kale Khan Delhi 💯Call Us 🔝8264348440🔝soniya singh
 
Call Girls in Pitampura Delhi 💯Call Us 🔝8264348440🔝
Call Girls in Pitampura Delhi 💯Call Us 🔝8264348440🔝Call Girls in Pitampura Delhi 💯Call Us 🔝8264348440🔝
Call Girls in Pitampura Delhi 💯Call Us 🔝8264348440🔝soniya singh
 
Call Girls in shastri nagar Delhi 8264348440 ✅ call girls ❤️
Call Girls in shastri nagar Delhi 8264348440 ✅ call girls ❤️Call Girls in shastri nagar Delhi 8264348440 ✅ call girls ❤️
Call Girls in shastri nagar Delhi 8264348440 ✅ call girls ❤️soniya singh
 
call girls in Shahdara (DELHI) 🔝 >༒9953330565🔝 genuine Escort Service 🔝✔️✔️
call girls in Shahdara (DELHI) 🔝 >༒9953330565🔝 genuine Escort Service 🔝✔️✔️call girls in Shahdara (DELHI) 🔝 >༒9953330565🔝 genuine Escort Service 🔝✔️✔️
call girls in Shahdara (DELHI) 🔝 >༒9953330565🔝 genuine Escort Service 🔝✔️✔️9953056974 Low Rate Call Girls In Saket, Delhi NCR
 
Shapoorji Pallonji Parkwest Sequoia Tower Bangalore.pdf
Shapoorji Pallonji Parkwest Sequoia Tower Bangalore.pdfShapoorji Pallonji Parkwest Sequoia Tower Bangalore.pdf
Shapoorji Pallonji Parkwest Sequoia Tower Bangalore.pdfashiyadav24
 
9990771857 Call Girls in Noida Sector 03 Noida (Call Girls) Delhi
9990771857 Call Girls in Noida Sector 03 Noida (Call Girls) Delhi9990771857 Call Girls in Noida Sector 03 Noida (Call Girls) Delhi
9990771857 Call Girls in Noida Sector 03 Noida (Call Girls) Delhidelhimodel235
 
Low Rate Call Girls in Triveni Complex Delhi Call 9990771857
Low Rate Call Girls in Triveni Complex Delhi Call 9990771857Low Rate Call Girls in Triveni Complex Delhi Call 9990771857
Low Rate Call Girls in Triveni Complex Delhi Call 9990771857delhimodel235
 
Call Girls in Noida Sector 12 Noida 💯Call Us 🔝 9582086666 🔝 South Delhi Escor...
Call Girls in Noida Sector 12 Noida 💯Call Us 🔝 9582086666 🔝 South Delhi Escor...Call Girls in Noida Sector 12 Noida 💯Call Us 🔝 9582086666 🔝 South Delhi Escor...
Call Girls in Noida Sector 12 Noida 💯Call Us 🔝 9582086666 🔝 South Delhi Escor...delhimodel235
 
Building Dreams: Newman Leech's Visionary Approach to Real Estate Investment
Building Dreams: Newman Leech's Visionary Approach to Real Estate InvestmentBuilding Dreams: Newman Leech's Visionary Approach to Real Estate Investment
Building Dreams: Newman Leech's Visionary Approach to Real Estate InvestmentNewman George Leech
 
Purva Palm Hills Devanahalli, Bangalore E- Brochure.pdf
Purva Palm Hills Devanahalli, Bangalore E- Brochure.pdfPurva Palm Hills Devanahalli, Bangalore E- Brochure.pdf
Purva Palm Hills Devanahalli, Bangalore E- Brochure.pdffaheemali990101
 
9990771857 Call Girls in Noida Sector 1 Noida (Call Girls) Delhi
9990771857 Call Girls in Noida Sector 1 Noida (Call Girls) Delhi9990771857 Call Girls in Noida Sector 1 Noida (Call Girls) Delhi
9990771857 Call Girls in Noida Sector 1 Noida (Call Girls) Delhidelhimodel235
 
FULL ENJOY 🔝 8264348440 🔝 Call Girls in DLF phase 3 | Gurgaon
FULL ENJOY 🔝 8264348440 🔝 Call Girls in DLF phase 3 | GurgaonFULL ENJOY 🔝 8264348440 🔝 Call Girls in DLF phase 3 | Gurgaon
FULL ENJOY 🔝 8264348440 🔝 Call Girls in DLF phase 3 | Gurgaonsoniya singh
 
How to Build Multifamily and Laneway Suites in Toronto!! (feat. Expert Archi...
How to Build Multifamily and Laneway Suites  in Toronto!! (feat. Expert Archi...How to Build Multifamily and Laneway Suites  in Toronto!! (feat. Expert Archi...
How to Build Multifamily and Laneway Suites in Toronto!! (feat. Expert Archi...Volition Properties
 
Omaxe Dwarka In Delhi E Brochure Pdf
Omaxe Dwarka In Delhi E Brochure     PdfOmaxe Dwarka In Delhi E Brochure     Pdf
Omaxe Dwarka In Delhi E Brochure Pdfashiyadav24
 
Puravankara Mundhwa Pune E-Brochure.pdf
Puravankara Mundhwa Pune  E-Brochure.pdfPuravankara Mundhwa Pune  E-Brochure.pdf
Puravankara Mundhwa Pune E-Brochure.pdfManishSaxena95
 
9990771857 Call Girls in Noida Sector 34 Noida (Call Girls) Delhi
9990771857 Call Girls in Noida Sector 34 Noida (Call Girls) Delhi9990771857 Call Girls in Noida Sector 34 Noida (Call Girls) Delhi
9990771857 Call Girls in Noida Sector 34 Noida (Call Girls) Delhidelhimodel235
 
Low Rate Call Girls in Trilokpuri Delhi Call 9990771857
Low Rate Call Girls in Trilokpuri Delhi Call 9990771857Low Rate Call Girls in Trilokpuri Delhi Call 9990771857
Low Rate Call Girls in Trilokpuri Delhi Call 9990771857delhimodel235
 
Low Rate Call Girls in Tughlakabad Delhi Call 9990771857
Low Rate Call Girls in Tughlakabad Delhi Call 9990771857Low Rate Call Girls in Tughlakabad Delhi Call 9990771857
Low Rate Call Girls in Tughlakabad Delhi Call 9990771857delhimodel235
 
Sankla East World Hadapsar Pune E-Brochure.pdf
Sankla East World Hadapsar Pune  E-Brochure.pdfSankla East World Hadapsar Pune  E-Brochure.pdf
Sankla East World Hadapsar Pune E-Brochure.pdfManishSaxena95
 

Recently uploaded (20)

Call Girls in Model Town Delhi 💯Call Us 🔝8264348440🔝
Call Girls in Model Town Delhi 💯Call Us 🔝8264348440🔝Call Girls in Model Town Delhi 💯Call Us 🔝8264348440🔝
Call Girls in Model Town Delhi 💯Call Us 🔝8264348440🔝
 
Call Girls in Sarai Kale Khan Delhi 💯Call Us 🔝8264348440🔝
Call Girls in Sarai Kale Khan Delhi 💯Call Us 🔝8264348440🔝Call Girls in Sarai Kale Khan Delhi 💯Call Us 🔝8264348440🔝
Call Girls in Sarai Kale Khan Delhi 💯Call Us 🔝8264348440🔝
 
Call Girls in Pitampura Delhi 💯Call Us 🔝8264348440🔝
Call Girls in Pitampura Delhi 💯Call Us 🔝8264348440🔝Call Girls in Pitampura Delhi 💯Call Us 🔝8264348440🔝
Call Girls in Pitampura Delhi 💯Call Us 🔝8264348440🔝
 
Call Girls in shastri nagar Delhi 8264348440 ✅ call girls ❤️
Call Girls in shastri nagar Delhi 8264348440 ✅ call girls ❤️Call Girls in shastri nagar Delhi 8264348440 ✅ call girls ❤️
Call Girls in shastri nagar Delhi 8264348440 ✅ call girls ❤️
 
call girls in Shahdara (DELHI) 🔝 >༒9953330565🔝 genuine Escort Service 🔝✔️✔️
call girls in Shahdara (DELHI) 🔝 >༒9953330565🔝 genuine Escort Service 🔝✔️✔️call girls in Shahdara (DELHI) 🔝 >༒9953330565🔝 genuine Escort Service 🔝✔️✔️
call girls in Shahdara (DELHI) 🔝 >༒9953330565🔝 genuine Escort Service 🔝✔️✔️
 
Shapoorji Pallonji Parkwest Sequoia Tower Bangalore.pdf
Shapoorji Pallonji Parkwest Sequoia Tower Bangalore.pdfShapoorji Pallonji Parkwest Sequoia Tower Bangalore.pdf
Shapoorji Pallonji Parkwest Sequoia Tower Bangalore.pdf
 
9990771857 Call Girls in Noida Sector 03 Noida (Call Girls) Delhi
9990771857 Call Girls in Noida Sector 03 Noida (Call Girls) Delhi9990771857 Call Girls in Noida Sector 03 Noida (Call Girls) Delhi
9990771857 Call Girls in Noida Sector 03 Noida (Call Girls) Delhi
 
Low Rate Call Girls in Triveni Complex Delhi Call 9990771857
Low Rate Call Girls in Triveni Complex Delhi Call 9990771857Low Rate Call Girls in Triveni Complex Delhi Call 9990771857
Low Rate Call Girls in Triveni Complex Delhi Call 9990771857
 
Call Girls in Noida Sector 12 Noida 💯Call Us 🔝 9582086666 🔝 South Delhi Escor...
Call Girls in Noida Sector 12 Noida 💯Call Us 🔝 9582086666 🔝 South Delhi Escor...Call Girls in Noida Sector 12 Noida 💯Call Us 🔝 9582086666 🔝 South Delhi Escor...
Call Girls in Noida Sector 12 Noida 💯Call Us 🔝 9582086666 🔝 South Delhi Escor...
 
Building Dreams: Newman Leech's Visionary Approach to Real Estate Investment
Building Dreams: Newman Leech's Visionary Approach to Real Estate InvestmentBuilding Dreams: Newman Leech's Visionary Approach to Real Estate Investment
Building Dreams: Newman Leech's Visionary Approach to Real Estate Investment
 
Purva Palm Hills Devanahalli, Bangalore E- Brochure.pdf
Purva Palm Hills Devanahalli, Bangalore E- Brochure.pdfPurva Palm Hills Devanahalli, Bangalore E- Brochure.pdf
Purva Palm Hills Devanahalli, Bangalore E- Brochure.pdf
 
9990771857 Call Girls in Noida Sector 1 Noida (Call Girls) Delhi
9990771857 Call Girls in Noida Sector 1 Noida (Call Girls) Delhi9990771857 Call Girls in Noida Sector 1 Noida (Call Girls) Delhi
9990771857 Call Girls in Noida Sector 1 Noida (Call Girls) Delhi
 
FULL ENJOY 🔝 8264348440 🔝 Call Girls in DLF phase 3 | Gurgaon
FULL ENJOY 🔝 8264348440 🔝 Call Girls in DLF phase 3 | GurgaonFULL ENJOY 🔝 8264348440 🔝 Call Girls in DLF phase 3 | Gurgaon
FULL ENJOY 🔝 8264348440 🔝 Call Girls in DLF phase 3 | Gurgaon
 
How to Build Multifamily and Laneway Suites in Toronto!! (feat. Expert Archi...
How to Build Multifamily and Laneway Suites  in Toronto!! (feat. Expert Archi...How to Build Multifamily and Laneway Suites  in Toronto!! (feat. Expert Archi...
How to Build Multifamily and Laneway Suites in Toronto!! (feat. Expert Archi...
 
Omaxe Dwarka In Delhi E Brochure Pdf
Omaxe Dwarka In Delhi E Brochure     PdfOmaxe Dwarka In Delhi E Brochure     Pdf
Omaxe Dwarka In Delhi E Brochure Pdf
 
Puravankara Mundhwa Pune E-Brochure.pdf
Puravankara Mundhwa Pune  E-Brochure.pdfPuravankara Mundhwa Pune  E-Brochure.pdf
Puravankara Mundhwa Pune E-Brochure.pdf
 
9990771857 Call Girls in Noida Sector 34 Noida (Call Girls) Delhi
9990771857 Call Girls in Noida Sector 34 Noida (Call Girls) Delhi9990771857 Call Girls in Noida Sector 34 Noida (Call Girls) Delhi
9990771857 Call Girls in Noida Sector 34 Noida (Call Girls) Delhi
 
Low Rate Call Girls in Trilokpuri Delhi Call 9990771857
Low Rate Call Girls in Trilokpuri Delhi Call 9990771857Low Rate Call Girls in Trilokpuri Delhi Call 9990771857
Low Rate Call Girls in Trilokpuri Delhi Call 9990771857
 
Low Rate Call Girls in Tughlakabad Delhi Call 9990771857
Low Rate Call Girls in Tughlakabad Delhi Call 9990771857Low Rate Call Girls in Tughlakabad Delhi Call 9990771857
Low Rate Call Girls in Tughlakabad Delhi Call 9990771857
 
Sankla East World Hadapsar Pune E-Brochure.pdf
Sankla East World Hadapsar Pune  E-Brochure.pdfSankla East World Hadapsar Pune  E-Brochure.pdf
Sankla East World Hadapsar Pune E-Brochure.pdf
 

JLL Pittsburgh Industrial Insight & Statistics - Q4 201itt

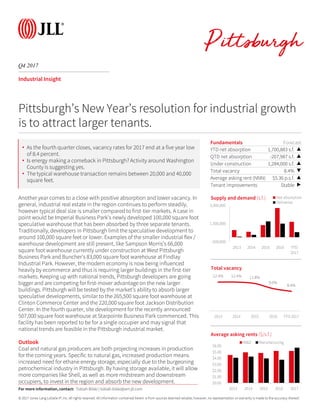
  • 1. © 2017 Jones Lang LaSalle IP, Inc. All rights reserved. All information contained herein is from sources deemed reliable; however, no representation or warranty is made to the accuracy thereof. Q4 2017 Industrial Insight Another year comes to a close with positive absorption and lower vacancy. In general, industrial real estate in the region continues to perform steadily, however typical deal size is smaller compared to first-tier markets. A case in point would be Imperial Business Park’s newly developed 100,000 square foot speculative warehouse that has been absorbed by three separate tenants. Traditionally, developers in Pittsburgh limit the speculative development to around 100,000 square feet or lower. Examples of the smaller industrial flex / warehouse development are still present, like Sampson Morris’s 66,000 square foot warehouse currently under construction at West Pittsburgh Business Park and Buncher’s 83,000 square foot warehouse at Findlay Industrial Park. However, the modern economy is now being influenced heavily by ecommerce and thus is requiring larger buildings in the first-tier markets. Keeping up with national trends, Pittsburgh developers are going bigger and are competing for first-mover advantage on the new larger buildings. Pittsburgh will be tested by the market’s ability to absorb larger speculative developments, similar to the 265,500 square foot warehouse at Clinton Commerce Center and the 220,000 square foot Jackson Distribution Center. In the fourth quarter, site development for the recently announced 507,000 square foot warehouse at Starpointe Business Park commenced. This facility has been reported to be for a single occupier and may signal that national trends are feasible in the Pittsburgh industrial market. Outlook Coal and natural gas producers are both projecting increases in production for the coming years. Specific to natural gas, increased production means increased need for ethane energy storage, especially due to the burgeoning petrochemical industry in Pittsburgh. By having storage available, it will allow more companies like Shell, as well as more midstream and downstream occupiers, to invest in the region and absorb the new development. Fundamentals Forecast YTD net absorption 1,700,883 s.f. â–˛ QTD net absorption -207,987 s.f. â–˛ Under construction 1,284,000 s.f. â–˛ Total vacancy 8.4% â–Ľ Average asking rent (NNN) $5.36 p.s.f. â–˛ Tenant improvements Stable â–¶ -500,000 1,500,000 3,500,000 2013 2014 2015 2016 YTD 2017 Supply and demand (s.f.) Net absorption Deliveries Pittsburgh’s New Year’s resolution for industrial growth is to attract larger tenants. 12.4% 12.4% 11.8% 9.6% 8.4% 2013 2014 2015 2016 YTD 2017 Total vacancy For more information, contact: Tobiah Bilski | tobiah.bilski@am.jll.com • As the fourth quarter closes, vacancy rates for 2017 end at a five year low of 8.4 percent. • Is energy making a comeback in Pittsburgh? Activity around Washington County is suggesting yes. • The typical warehouse transaction remains between 20,000 and 40,000 square feet. $0.00 $1.00 $2.00 $3.00 $4.00 $5.00 $6.00 2013 2014 2015 2016 2017 Average asking rents ($/s.f.) W&D Manufacturing
  • 2. © 2017 Jones Lang LaSalle IP, Inc. All rights reserved. All information contained herein is from sources deemed reliable; however, no representation or warranty is made to the accuracy thereof. Q4 2017 Industrial Statistics For more information, contact: Tobiah Bilski | tobiah.bilski@am.jll.com Inventory (s.f.) Quarterly absorption (s.f.) YTD absorption (s.f.) YTD absorption (% of stock) Total availability (s.f.) Total availability (%) Average asking rent ($ p.s.f.) Quarterly completions (s.f.) YTD completions (s.f.) Under construction (s.f.) 83,196,656 93,197 1,341,934 1.6% 7,949,765 9.6% $5.19 156,864 559,864 1,289,000 Manufacturing 55,600,717 -301,184 358,949 0.6% 3,770,029 6.8% $5.71 0 0 0 Total 138,797,373 -207,987 1,700,883 1.2% 11,719,794 8.4% $5.36 156,864 559,864 1,289,000 Flex / R&D 21,959,091 226,727 335,121 1.5% 2,694,343 12.3% $9.99 0 0 0 Beaver County 4,525,107 63,018 -55,286 -1.2% 631,948 14.0% $5.58 0 0 416,000 Manufacturing 4,748,578 -315,900 -245,000 -5.2% 402,200 8.5% $6.00 0 0 0 Total 9,273,685 -252,882 -300,286 -3.2% 1,034,148 11.2% $5.74 0 0 416,000 Flex / R&D 600,520 -17,735 -32,295 -5.4% 126,655 21.1% $10.00 0 0 0 Butler County 3,864,110 -13,640 -113,023 -2.9% 651,160 16.9% $3.55 0 0 220,000 Manufacturing 3,586,191 34,825 68,809 1.9% 410,180 11.4% $2.14 0 0 0 Total 7,450,301 21,185 -44,214 -0.6% 1,061,340 14.2% $3.01 0 0 220,000 Flex / R&D 386,900 -4,644 -4,644 -1.2% 15,644 4.0% $10.00 0 0 0 Downtown 17,850,155 113,967 225,268 1.3% 1,174,938 6.6% $5.44 0 0 0 Manufacturing 4,195,484 -7,284 51,893 1.2% 44,384 1.1% $7.18 0 0 0 Total 22,045,639 106,683 277,161 1.3% 1,219,322 5.5% $5.50 0 0 0 Flex / R&D 3,216,725 6,997 29,907 0.9% 412,010 12.8% $8.69 0 0 0 East 6,543,686 10,924 99,742 1.5% 489,929 7.5% $8.82 0 0 0 Manufacturing 4,588,748 0 -105,800 -2.3% 442,190 9.6% $3.25 0 0 0 Total 11,132,434 10,924 -6,058 -0.1% 932,119 8.4% $6.18 0 0 0 Flex / R&D 3,112,912 11,700 150,252 4.8% 485,502 15.6% $10.49 0 0 0 Northeast 5,870,737 -19,280 82,515 1.4% 211,564 3.6% $5.50 0 0 0 Manufacturing 6,408,774 200 -81,054 -1.3% 204,890 3.2% $5.75 0 0 0 Total 12,279,511 -19,080 1,461 0.0% 416,454 3.4% $5.62 0 0 0 Flex / R&D 3,261,718 29,656 61,080 1.9% 235,434 7.2% $10.75 0 0 0 Northwest 10,325,348 109,330 379,851 3.7% 597,753 5.8% $6.08 0 0 0 Manufacturing 3,478,558 0 -62,000 -1.8% 102,040 2.9% $9.95 0 0 0 Total 13,803,906 109,330 317,851 2.3% 699,793 5.1% $6.65 0 0 0 Flex / R&D 2,239,369 46,691 79,454 3.5% 153,356 6.8% $16.50 0 0 0 South 5,740,769 12,592 -23,780 -0.4% 509,948 8.9% $3.73 0 0 0 Manufacturing 8,033,579 0 -79,831 -1.0% 257,613 3.2% $5.73 0 0 0 Total 13,774,348 12,592 -103,611 -0.8% 767,561 5.6% $4.43 0 0 0 Flex / R&D 1,731,137 -7,278 27,006 1.6% 130,882 7.6% $12.37 0 0 0 Washington County 5,563,429 21,109 354,630 6.4% 1,315,077 23.6% $4.91 0 0 0 Manufacturing 4,715,323 -65,525 -114,475 -2.4% 530,575 11.3% $6.31 0 0 0 Total 10,278,752 -44,416 240,155 2.3% 1,845,652 18.0% $5.31 0 0 0 Flex / R&D 1,485,473 73,462 96,304 6.5% 236,994 16.0% $9.00 0 0 0 West 10,654,588 -48,975 263,210 2.5% 1,020,781 9.6% $5.76 156,864 522,364 573,000 Manufacturing 2,847,633 0 26,416 0.9% 146,000 5.1% $6.33 0 0 0 Total 13,502,221 -48,975 289,626 2.1% 1,166,781 8.6% $5.83 156,864 522,364 573,000 Flex / R&D 3,612,743 98,808 -99,692 -2.8% 657,366 18.2% $10.59 0 0 0 Westmoreland County 12,258,727 -155,848 128,807 1.1% 1,346,667 11.0% $4.09 0 37,500 80,000 Manufacturing 12,997,849 52,500 899,991 6.9% 1,229,957 9.5% $6.95 0 0 0 Total 25,256,576 -103,348 1,028,798 4.1% 2,576,624 10.2% $5.52 0 37,500 80,000 Flex / R&D 2,311,594 -10,930 27,749 1.2% 240,500 10.4% $5.38 0 0 0 Warehouse & Distribution Pittsburgh Totals Warehouse & Distribution Warehouse & Distribution Warehouse & Distribution Warehouse & Distribution Warehouse & Distribution Warehouse & Distribution Warehouse & Distribution Warehouse & Distribution Warehouse & Distribution Warehouse & Distribution