SlideShare a Scribd company logo
1 of 2
Download to read offline
© 2018 Jones Lang LaSalle IP, Inc. All rights reserved. All information contained herein is from sources deemed reliable; however, no representation or warranty is made to the accuracy thereof.
Q2 2018
Tampa Bay
Industrial Insight
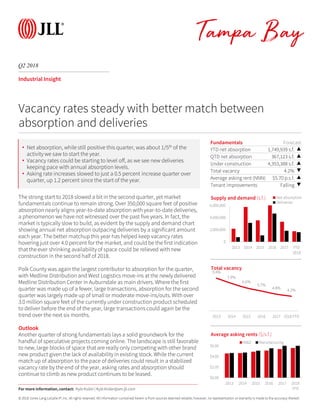
The strong start to 2018 slowed a bit in the second quarter, yet market
fundamentals continue to remain strong. Over 350,000 square feet of positive
absorption nearly aligns year-to-date absorption with year-to-date deliveries,
a phenomenon we have not witnessed over the past five years. In fact, the
market is typically slow to build, as evident by the supply and demand chart
showing annual net absorption outpacing deliveries by a significant amount
each year. The better matchup this year has helped keep vacancy rates
hovering just over 4.0 percent for the market, and could be the first indication
that the ever shrinking availability of space could be relieved with new
construction in the second half of 2018.
Polk County was again the largest contributor to absorption for the quarter,
with Medline Distribution and West Logistics move-ins at the newly delivered
Medline Distribution Center in Auburndale as main drivers. Where the first
quarter was made up of a fewer, large transactions, absorption for the second
quarter was largely made up of small or moderate move-ins/outs. With over
3.0 million square feet of the currently under construction product scheduled
to deliver before the end of the year, large transactions could again be the
trend over the next six months.
Outlook
Another quarter of strong fundamentals lays a solid groundwork for the
handful of speculative projects coming online. The landscape is still favorable
to new, large blocks of space that are really only competing with other brand
new product given the lack of availability in existing stock. While the current
match up of absorption to the pace of deliveries could result in a stabilized
vacancy rate by the end of the year, asking rates and absorption should
continue to climb as new product continues to be leased.
Fundamentals Forecast
YTD net absorption 1,749,939 s.f. ▲
QTD net absorption 367,123 s.f. ▲
Under construction 4,353,388 s.f. ▲
Total vacancy 4.2% ▼
Average asking rent (NNN) $5.70 p.s.f. ▲
Tenant improvements Falling ▼
0
2,000,000
4,000,000
6,000,000
2013 2014 2015 2016 2017 YTD
2018
Supply and demand (s.f.) Net absorption
Deliveries
Vacancy rates steady with better match between
absorption and deliveries
9.4%
7.9%
6.6%
5.7%
4.8% 4.2%
2013 2014 2015 2016 2017 2018 YTD
Total vacancy
For more information, contact: Kyle Koller | Kyle.Koller@am.jll.com
• Net absorption, while still positive this quarter, was about 1/5th of the
activity we saw to start the year.
• Vacancy rates could be starting to level off, as we see new deliveries
keeping pace with annual absorption levels.
• Asking rate increases slowed to just a 0.5 percent increase quarter over
quarter, up 1.2 percent since the start of the year.
$0.00
$2.00
$4.00
$6.00
2013 2014 2015 2016 2017 2018
YTD
Average asking rents ($/s.f.)
W&D Manufacturing
Tampa Bay
Q2 2018
Industrial Statistics
Inventory
(s.f.)
Quarterly
total net
absorption
(s.f.)
YTD
total net
absorption
(s.f.)
YTD
total net
absorption
(% of stock)
Total
vacancy
(%)
Total
availability
(%)
Average
total asking
rent
($ p.s.f.)
Quarterly
completions
(s.f.)
YTD
completions
(s.f.)
Under
construction
(s.f.)
Tampa Bay Totals
Warehouse & Distribution 151,659,310 624,685 2,115,116 1.4% 4.3% 10.0% $5.61 526,061 1,548,302 4,353,388
Manufacturing 53,810,073 -257,562 -365,177 -0.7% 4.2% 5.1% $6.18 30,200 30,200 0
Totals 205,469,383 367,123 1,749,939 0.9% 4.2% 8.7% $5.70 556,261 1,578,502 4,353,388
Submarkets
North Pinellas
Warehouse & Distribution 4,582,189 -40,060 -42,903 -0.9% 2.7% 4.0% $6.75 0 0 0
Manufacturing 2,018,122 -25,575 -25,575 -1.3% 2.4% 2.6% $5.75 0 0 0
Totals 6,600,311 -65,635 -68,478 -1.0% 2.7% 3.6% $6.53 0 0 0
Mid Pinellas
Warehouse & Distribution 7,410,276 46,492 63,979 0.9% 1.8% 5.7% $6.36 126,000 158,000 10,450
Manufacturing 7,928,235 5,108 4,608 0.1% 5.6% 7.3% $6.37 0 0 0
Totals 15,338,511 51,600 68,587 0.4% 3.8% 6.5% $6.37 126,000 158,000 10,450
Gateway
Warehouse & Distribution 9,917,207 113,856 -12,145 -0.1% 4.3% 8.7% $6.77 0 0 65,000
Manufacturing 7,977,817 -149,242 -216,765 -2.7% 7.6% 7.3% $6.08 0 0 0
Totals 17,895,024 -35,386 -228,910 -1.3% 5.7% 8.1% $6.48 0 0 65,000
South Pinellas
Warehouse & Distribution 7,016,165 -174,418 -164,460 -2.3% 3.8% 6.7% $5.10 0 0 0
Manufacturing 3,046,789 -35,327 -32,296 -1.1% 3.8% 6.6% $6.12 0 0 0
Totals 10,062,954 -209,745 -196,756 -2.0% 3.8% 6.7% $5.41 0 0 0
Westshore/Airport
Warehouse & Distribution 9,718,778 -50,445 -44,497 -0.5% 3.8% 6.3% $6.65 0 0 21,000
Manufacturing 2,824,723 7,394 41,724 1.5% 1.6% 3.0% $6.15 0 0 0
Totals 12,543,501 -43,051 -2,773 0.0% 3.3% 5.5% $6.59 0 0 21,000
East Side
Warehouse & Distribution 49,768,236 -157,286 93,181 0.2% 6.3% 13.2% $5.54 340,061 472,102 1,892,704
Manufacturing 10,444,871 143,402 160,613 1.5% 1.9% 4.4% $5.26 0 0 0
Totals 60,213,107 -13,884 253,794 0.4% 5.5% 11.7% $5.52 340,061 472,102 1,892,704
Manatee/Sarasota County
Warehouse & Distribution 22,991,507 38,858 104,676 0.5% 3.1% 5.6% $7.19 60,000 88,200 406,000
Manufacturing 8,486,933 -88,169 -153,997 -1.8% 4.0% 4.8% $7.80 0 0 0
Totals 31,478,440 -49,311 -49,321 -0.2% 3.3% 5.4% $7.34 60,000 88,200 406,000
East Polk
Warehouse & Distribution 15,647,713 669,391 1,206,925 7.7% 5.0% 14.8% $4.71 0 830,000 207,676
Manufacturing 3,808,800 -173,633 -173,633 -4.6% 5.7% 3.7% $2.47 0 0 0
Totals 19,456,513 495,758 1,033,292 5.3% 5.1% 12.7% $4.58 0 830,000 207,676
West Polk
Warehouse & Distribution 24,607,239 178,297 910,360 3.7% 2.2% 10.0% $5.04 0 0 1,750,558
Manufacturing 7,273,783 58,480 30,144 0.4% 3.1% 3.5% $6.99 30,200 30,200 0
Totals 31,881,022 236,777 940,504 3.0% 2.4% 8.5% $5.22 30,200 30,200 1,750,558
Kyle Koller | Senior Research Analyst
401 East Jackson, Suite 1500, Tampa Bay, FL 33602 | tel +1 813 387 1323 | kyle.koller@am.jll.com
2018 Jones Lang LaSalle IP, Inc. All rights reserved.

More Related Content

What's hot

JLL Pittsburgh Industrial Insight & Statistics - Q3 2019
JLL Pittsburgh Industrial Insight & Statistics - Q3 2019JLL Pittsburgh Industrial Insight & Statistics - Q3 2019
JLL Pittsburgh Industrial Insight & Statistics - Q3 2019Tobiah Bilski
 
JLL West Michigan Industrial Insight & Statistics - Q1 2019
JLL West Michigan Industrial Insight & Statistics - Q1 2019JLL West Michigan Industrial Insight & Statistics - Q1 2019
JLL West Michigan Industrial Insight & Statistics - Q1 2019Harrison West
 
JLL Cleveland Industrial Outlook: Q3 2018
JLL Cleveland Industrial Outlook: Q3 2018JLL Cleveland Industrial Outlook: Q3 2018
JLL Cleveland Industrial Outlook: Q3 2018Andrew Batson
 
JLL Pittsburgh Industrial Insight & Statistics - Q2 2019
JLL Pittsburgh Industrial Insight & Statistics - Q2 2019JLL Pittsburgh Industrial Insight & Statistics - Q2 2019
JLL Pittsburgh Industrial Insight & Statistics - Q2 2019Tobiah Bilski
 
JLL West Michigan Industrial Insight & Statistics - Q3 2018
JLL West Michigan Industrial Insight & Statistics - Q3 2018JLL West Michigan Industrial Insight & Statistics - Q3 2018
JLL West Michigan Industrial Insight & Statistics - Q3 2018Harrison West
 
JLL Pittsburgh Industrial Insight & Statistics - Q4 2019
JLL Pittsburgh Industrial Insight & Statistics - Q4 2019JLL Pittsburgh Industrial Insight & Statistics - Q4 2019
JLL Pittsburgh Industrial Insight & Statistics - Q4 2019Tobiah Bilski
 
JLL Pittsburgh Industrial Insight & Statistics - Q2 2020
JLL Pittsburgh Industrial Insight & Statistics - Q2 2020JLL Pittsburgh Industrial Insight & Statistics - Q2 2020
JLL Pittsburgh Industrial Insight & Statistics - Q2 2020Tobiah Bilski
 
JLL Detroit Industrial Insight & Statistics - Q4 2019
JLL Detroit Industrial Insight & Statistics - Q4 2019JLL Detroit Industrial Insight & Statistics - Q4 2019
JLL Detroit Industrial Insight & Statistics - Q4 2019Harrison West
 
JLL Cleveland Industrial Outlook: Q4 2016
JLL Cleveland Industrial Outlook: Q4 2016JLL Cleveland Industrial Outlook: Q4 2016
JLL Cleveland Industrial Outlook: Q4 2016Andrew Batson
 
JLL Pittsburgh Industrial Insight & Statistics - Q1 2017
JLL Pittsburgh Industrial Insight & Statistics - Q1 2017JLL Pittsburgh Industrial Insight & Statistics - Q1 2017
JLL Pittsburgh Industrial Insight & Statistics - Q1 2017Tobiah Bilski
 
JLL West Michigan Industrial Insight & Statistics - Q2 2018
JLL West Michigan Industrial Insight & Statistics - Q2 2018JLL West Michigan Industrial Insight & Statistics - Q2 2018
JLL West Michigan Industrial Insight & Statistics - Q2 2018Harrison West
 
JLL West Michigan Industrial Insight & Statistics - Q4 2019
JLL West Michigan Industrial Insight & Statistics - Q4 2019JLL West Michigan Industrial Insight & Statistics - Q4 2019
JLL West Michigan Industrial Insight & Statistics - Q4 2019Harrison West
 
JLL Pittsburgh Industrial Insight & Statistics - Q3 2018
JLL Pittsburgh Industrial Insight & Statistics - Q3 2018JLL Pittsburgh Industrial Insight & Statistics - Q3 2018
JLL Pittsburgh Industrial Insight & Statistics - Q3 2018Tobiah Bilski
 
JLL Pittsburgh Office Outlook - Q4 2015
JLL Pittsburgh Office Outlook - Q4 2015JLL Pittsburgh Office Outlook - Q4 2015
JLL Pittsburgh Office Outlook - Q4 2015Andrew Batson
 
JLL West Michigan Industrial Insight & Statistics - Q3 2017
JLL West Michigan Industrial Insight & Statistics - Q3 2017JLL West Michigan Industrial Insight & Statistics - Q3 2017
JLL West Michigan Industrial Insight & Statistics - Q3 2017Harrison West
 
Industrial Insight and Statistics: Dallas-Fort Worth (2019-Q2)
Industrial Insight and Statistics: Dallas-Fort Worth (2019-Q2)Industrial Insight and Statistics: Dallas-Fort Worth (2019-Q2)
Industrial Insight and Statistics: Dallas-Fort Worth (2019-Q2)Nick Thomas
 
JLL Pittsburgh Office Insight & Statistics - Q2 2021
JLL Pittsburgh Office Insight & Statistics - Q2 2021JLL Pittsburgh Office Insight & Statistics - Q2 2021
JLL Pittsburgh Office Insight & Statistics - Q2 2021Tobiah Bilski
 
JLL Cincinnati Industrial Outlook Q3 2017
JLL Cincinnati Industrial Outlook  Q3 2017JLL Cincinnati Industrial Outlook  Q3 2017
JLL Cincinnati Industrial Outlook Q3 2017Abby Armbruster
 
JLL Cincinnati Industrial Outlook Q4 2020
JLL Cincinnati Industrial Outlook Q4 2020JLL Cincinnati Industrial Outlook Q4 2020
JLL Cincinnati Industrial Outlook Q4 2020Abby Armbruster
 
JLL Detroit Industrial Insight & Statistics - Q4 2018
JLL Detroit Industrial Insight & Statistics - Q4 2018JLL Detroit Industrial Insight & Statistics - Q4 2018
JLL Detroit Industrial Insight & Statistics - Q4 2018Harrison West
 

What's hot (20)

JLL Pittsburgh Industrial Insight & Statistics - Q3 2019
JLL Pittsburgh Industrial Insight & Statistics - Q3 2019JLL Pittsburgh Industrial Insight & Statistics - Q3 2019
JLL Pittsburgh Industrial Insight & Statistics - Q3 2019
 
JLL West Michigan Industrial Insight & Statistics - Q1 2019
JLL West Michigan Industrial Insight & Statistics - Q1 2019JLL West Michigan Industrial Insight & Statistics - Q1 2019
JLL West Michigan Industrial Insight & Statistics - Q1 2019
 
JLL Cleveland Industrial Outlook: Q3 2018
JLL Cleveland Industrial Outlook: Q3 2018JLL Cleveland Industrial Outlook: Q3 2018
JLL Cleveland Industrial Outlook: Q3 2018
 
JLL Pittsburgh Industrial Insight & Statistics - Q2 2019
JLL Pittsburgh Industrial Insight & Statistics - Q2 2019JLL Pittsburgh Industrial Insight & Statistics - Q2 2019
JLL Pittsburgh Industrial Insight & Statistics - Q2 2019
 
JLL West Michigan Industrial Insight & Statistics - Q3 2018
JLL West Michigan Industrial Insight & Statistics - Q3 2018JLL West Michigan Industrial Insight & Statistics - Q3 2018
JLL West Michigan Industrial Insight & Statistics - Q3 2018
 
JLL Pittsburgh Industrial Insight & Statistics - Q4 2019
JLL Pittsburgh Industrial Insight & Statistics - Q4 2019JLL Pittsburgh Industrial Insight & Statistics - Q4 2019
JLL Pittsburgh Industrial Insight & Statistics - Q4 2019
 
JLL Pittsburgh Industrial Insight & Statistics - Q2 2020
JLL Pittsburgh Industrial Insight & Statistics - Q2 2020JLL Pittsburgh Industrial Insight & Statistics - Q2 2020
JLL Pittsburgh Industrial Insight & Statistics - Q2 2020
 
JLL Detroit Industrial Insight & Statistics - Q4 2019
JLL Detroit Industrial Insight & Statistics - Q4 2019JLL Detroit Industrial Insight & Statistics - Q4 2019
JLL Detroit Industrial Insight & Statistics - Q4 2019
 
JLL Cleveland Industrial Outlook: Q4 2016
JLL Cleveland Industrial Outlook: Q4 2016JLL Cleveland Industrial Outlook: Q4 2016
JLL Cleveland Industrial Outlook: Q4 2016
 
JLL Pittsburgh Industrial Insight & Statistics - Q1 2017
JLL Pittsburgh Industrial Insight & Statistics - Q1 2017JLL Pittsburgh Industrial Insight & Statistics - Q1 2017
JLL Pittsburgh Industrial Insight & Statistics - Q1 2017
 
JLL West Michigan Industrial Insight & Statistics - Q2 2018
JLL West Michigan Industrial Insight & Statistics - Q2 2018JLL West Michigan Industrial Insight & Statistics - Q2 2018
JLL West Michigan Industrial Insight & Statistics - Q2 2018
 
JLL West Michigan Industrial Insight & Statistics - Q4 2019
JLL West Michigan Industrial Insight & Statistics - Q4 2019JLL West Michigan Industrial Insight & Statistics - Q4 2019
JLL West Michigan Industrial Insight & Statistics - Q4 2019
 
JLL Pittsburgh Industrial Insight & Statistics - Q3 2018
JLL Pittsburgh Industrial Insight & Statistics - Q3 2018JLL Pittsburgh Industrial Insight & Statistics - Q3 2018
JLL Pittsburgh Industrial Insight & Statistics - Q3 2018
 
JLL Pittsburgh Office Outlook - Q4 2015
JLL Pittsburgh Office Outlook - Q4 2015JLL Pittsburgh Office Outlook - Q4 2015
JLL Pittsburgh Office Outlook - Q4 2015
 
JLL West Michigan Industrial Insight & Statistics - Q3 2017
JLL West Michigan Industrial Insight & Statistics - Q3 2017JLL West Michigan Industrial Insight & Statistics - Q3 2017
JLL West Michigan Industrial Insight & Statistics - Q3 2017
 
Industrial Insight and Statistics: Dallas-Fort Worth (2019-Q2)
Industrial Insight and Statistics: Dallas-Fort Worth (2019-Q2)Industrial Insight and Statistics: Dallas-Fort Worth (2019-Q2)
Industrial Insight and Statistics: Dallas-Fort Worth (2019-Q2)
 
JLL Pittsburgh Office Insight & Statistics - Q2 2021
JLL Pittsburgh Office Insight & Statistics - Q2 2021JLL Pittsburgh Office Insight & Statistics - Q2 2021
JLL Pittsburgh Office Insight & Statistics - Q2 2021
 
JLL Cincinnati Industrial Outlook Q3 2017
JLL Cincinnati Industrial Outlook  Q3 2017JLL Cincinnati Industrial Outlook  Q3 2017
JLL Cincinnati Industrial Outlook Q3 2017
 
JLL Cincinnati Industrial Outlook Q4 2020
JLL Cincinnati Industrial Outlook Q4 2020JLL Cincinnati Industrial Outlook Q4 2020
JLL Cincinnati Industrial Outlook Q4 2020
 
JLL Detroit Industrial Insight & Statistics - Q4 2018
JLL Detroit Industrial Insight & Statistics - Q4 2018JLL Detroit Industrial Insight & Statistics - Q4 2018
JLL Detroit Industrial Insight & Statistics - Q4 2018
 

Similar to JLL - Tampa Bay 2018 Q2 Industrial Outlook

JLL Cincinnati Industrial Outlook Q1 2021
JLL Cincinnati Industrial Outlook Q1 2021JLL Cincinnati Industrial Outlook Q1 2021
JLL Cincinnati Industrial Outlook Q1 2021Abby Armbruster
 
JLL Pittsburgh Industrial Insight & Statistics - Q4 2021
JLL Pittsburgh Industrial Insight & Statistics - Q4 2021JLL Pittsburgh Industrial Insight & Statistics - Q4 2021
JLL Pittsburgh Industrial Insight & Statistics - Q4 2021Tobiah Bilski
 
JLL Pittsburgh Industrial Insight & Statistics - Q1 2018
JLL Pittsburgh Industrial Insight & Statistics - Q1 2018JLL Pittsburgh Industrial Insight & Statistics - Q1 2018
JLL Pittsburgh Industrial Insight & Statistics - Q1 2018Tobiah Bilski
 
JLL Detroit Industrial Insight & Statistics - Q4 2017
JLL Detroit Industrial Insight & Statistics - Q4 2017JLL Detroit Industrial Insight & Statistics - Q4 2017
JLL Detroit Industrial Insight & Statistics - Q4 2017Harrison West
 
JLL Cleveland Industrial Outlook: Q4 2018
JLL Cleveland Industrial Outlook: Q4 2018JLL Cleveland Industrial Outlook: Q4 2018
JLL Cleveland Industrial Outlook: Q4 2018Andrew Batson
 
JLL Cleveland Industrial Outlook: Q4 2018
JLL Cleveland Industrial Outlook: Q4 2018JLL Cleveland Industrial Outlook: Q4 2018
JLL Cleveland Industrial Outlook: Q4 2018Andrew Batson
 
JLL Pittsburgh Industrial Insight & Statistics - Q4 2018
JLL Pittsburgh Industrial Insight & Statistics - Q4 2018JLL Pittsburgh Industrial Insight & Statistics - Q4 2018
JLL Pittsburgh Industrial Insight & Statistics - Q4 2018Tobiah Bilski
 
JLL Detroit Industrial Insight & Statistics - Q2 2017
JLL Detroit Industrial Insight & Statistics - Q2 2017JLL Detroit Industrial Insight & Statistics - Q2 2017
JLL Detroit Industrial Insight & Statistics - Q2 2017Harrison West
 
JLL Cincinnati Industrial Outlook Q3 2020
JLL Cincinnati Industrial Outlook Q3 2020JLL Cincinnati Industrial Outlook Q3 2020
JLL Cincinnati Industrial Outlook Q3 2020Abby Armbruster
 
JLL Pittsburgh Industrial Insight & Statistics - Q1 2019
JLL Pittsburgh Industrial Insight & Statistics - Q1 2019JLL Pittsburgh Industrial Insight & Statistics - Q1 2019
JLL Pittsburgh Industrial Insight & Statistics - Q1 2019Tobiah Bilski
 
JLL Pittsburgh Industrial Insight & Statistics - Q2 2018
JLL Pittsburgh Industrial Insight & Statistics - Q2 2018JLL Pittsburgh Industrial Insight & Statistics - Q2 2018
JLL Pittsburgh Industrial Insight & Statistics - Q2 2018Tobiah Bilski
 
JLL Detroit Industrial Insight & Statistics - Q4 2018
JLL Detroit Industrial Insight & Statistics - Q4 2018JLL Detroit Industrial Insight & Statistics - Q4 2018
JLL Detroit Industrial Insight & Statistics - Q4 2018Harrison West
 
JLL Cleveland Industrial Outlook: Q4 2017
JLL Cleveland Industrial Outlook: Q4 2017JLL Cleveland Industrial Outlook: Q4 2017
JLL Cleveland Industrial Outlook: Q4 2017Andrew Batson
 
JLL Cincinnati Industrial Outlook Q4 2017
JLL Cincinnati Industrial Outlook Q4 2017JLL Cincinnati Industrial Outlook Q4 2017
JLL Cincinnati Industrial Outlook Q4 2017Abby Armbruster
 
JLL Cleveland Industrial Outlook Q3 2019
JLL Cleveland Industrial Outlook   Q3 2019JLL Cleveland Industrial Outlook   Q3 2019
JLL Cleveland Industrial Outlook Q3 2019Johnathan Miller
 
JLL Cleveland Industrial Outlook: Q3 2019
JLL Cleveland Industrial Outlook: Q3 2019JLL Cleveland Industrial Outlook: Q3 2019
JLL Cleveland Industrial Outlook: Q3 2019Johnathan Miller
 
JLL Detroit Industrial Insight & Statistics - Q2 2016
JLL Detroit Industrial Insight & Statistics - Q2 2016JLL Detroit Industrial Insight & Statistics - Q2 2016
JLL Detroit Industrial Insight & Statistics - Q2 2016Aaron Moore
 
JLL Cleveland Industrial Outlook: Q1 2019
JLL Cleveland Industrial Outlook: Q1 2019JLL Cleveland Industrial Outlook: Q1 2019
JLL Cleveland Industrial Outlook: Q1 2019Andrew Batson
 
JLL West Michigan Industrial Insight & Statistics - Q4 2018
JLL West Michigan Industrial Insight & Statistics - Q4 2018JLL West Michigan Industrial Insight & Statistics - Q4 2018
JLL West Michigan Industrial Insight & Statistics - Q4 2018Harrison West
 

Similar to JLL - Tampa Bay 2018 Q2 Industrial Outlook (19)

JLL Cincinnati Industrial Outlook Q1 2021
JLL Cincinnati Industrial Outlook Q1 2021JLL Cincinnati Industrial Outlook Q1 2021
JLL Cincinnati Industrial Outlook Q1 2021
 
JLL Pittsburgh Industrial Insight & Statistics - Q4 2021
JLL Pittsburgh Industrial Insight & Statistics - Q4 2021JLL Pittsburgh Industrial Insight & Statistics - Q4 2021
JLL Pittsburgh Industrial Insight & Statistics - Q4 2021
 
JLL Pittsburgh Industrial Insight & Statistics - Q1 2018
JLL Pittsburgh Industrial Insight & Statistics - Q1 2018JLL Pittsburgh Industrial Insight & Statistics - Q1 2018
JLL Pittsburgh Industrial Insight & Statistics - Q1 2018
 
JLL Detroit Industrial Insight & Statistics - Q4 2017
JLL Detroit Industrial Insight & Statistics - Q4 2017JLL Detroit Industrial Insight & Statistics - Q4 2017
JLL Detroit Industrial Insight & Statistics - Q4 2017
 
JLL Cleveland Industrial Outlook: Q4 2018
JLL Cleveland Industrial Outlook: Q4 2018JLL Cleveland Industrial Outlook: Q4 2018
JLL Cleveland Industrial Outlook: Q4 2018
 
JLL Cleveland Industrial Outlook: Q4 2018
JLL Cleveland Industrial Outlook: Q4 2018JLL Cleveland Industrial Outlook: Q4 2018
JLL Cleveland Industrial Outlook: Q4 2018
 
JLL Pittsburgh Industrial Insight & Statistics - Q4 2018
JLL Pittsburgh Industrial Insight & Statistics - Q4 2018JLL Pittsburgh Industrial Insight & Statistics - Q4 2018
JLL Pittsburgh Industrial Insight & Statistics - Q4 2018
 
JLL Detroit Industrial Insight & Statistics - Q2 2017
JLL Detroit Industrial Insight & Statistics - Q2 2017JLL Detroit Industrial Insight & Statistics - Q2 2017
JLL Detroit Industrial Insight & Statistics - Q2 2017
 
JLL Cincinnati Industrial Outlook Q3 2020
JLL Cincinnati Industrial Outlook Q3 2020JLL Cincinnati Industrial Outlook Q3 2020
JLL Cincinnati Industrial Outlook Q3 2020
 
JLL Pittsburgh Industrial Insight & Statistics - Q1 2019
JLL Pittsburgh Industrial Insight & Statistics - Q1 2019JLL Pittsburgh Industrial Insight & Statistics - Q1 2019
JLL Pittsburgh Industrial Insight & Statistics - Q1 2019
 
JLL Pittsburgh Industrial Insight & Statistics - Q2 2018
JLL Pittsburgh Industrial Insight & Statistics - Q2 2018JLL Pittsburgh Industrial Insight & Statistics - Q2 2018
JLL Pittsburgh Industrial Insight & Statistics - Q2 2018
 
JLL Detroit Industrial Insight & Statistics - Q4 2018
JLL Detroit Industrial Insight & Statistics - Q4 2018JLL Detroit Industrial Insight & Statistics - Q4 2018
JLL Detroit Industrial Insight & Statistics - Q4 2018
 
JLL Cleveland Industrial Outlook: Q4 2017
JLL Cleveland Industrial Outlook: Q4 2017JLL Cleveland Industrial Outlook: Q4 2017
JLL Cleveland Industrial Outlook: Q4 2017
 
JLL Cincinnati Industrial Outlook Q4 2017
JLL Cincinnati Industrial Outlook Q4 2017JLL Cincinnati Industrial Outlook Q4 2017
JLL Cincinnati Industrial Outlook Q4 2017
 
JLL Cleveland Industrial Outlook Q3 2019
JLL Cleveland Industrial Outlook   Q3 2019JLL Cleveland Industrial Outlook   Q3 2019
JLL Cleveland Industrial Outlook Q3 2019
 
JLL Cleveland Industrial Outlook: Q3 2019
JLL Cleveland Industrial Outlook: Q3 2019JLL Cleveland Industrial Outlook: Q3 2019
JLL Cleveland Industrial Outlook: Q3 2019
 
JLL Detroit Industrial Insight & Statistics - Q2 2016
JLL Detroit Industrial Insight & Statistics - Q2 2016JLL Detroit Industrial Insight & Statistics - Q2 2016
JLL Detroit Industrial Insight & Statistics - Q2 2016
 
JLL Cleveland Industrial Outlook: Q1 2019
JLL Cleveland Industrial Outlook: Q1 2019JLL Cleveland Industrial Outlook: Q1 2019
JLL Cleveland Industrial Outlook: Q1 2019
 
JLL West Michigan Industrial Insight & Statistics - Q4 2018
JLL West Michigan Industrial Insight & Statistics - Q4 2018JLL West Michigan Industrial Insight & Statistics - Q4 2018
JLL West Michigan Industrial Insight & Statistics - Q4 2018
 

More from Kyle Koller

Tampa snapshot 11-15-2019
Tampa snapshot 11-15-2019Tampa snapshot 11-15-2019
Tampa snapshot 11-15-2019Kyle Koller
 
Tampa Bay 2018 Q1 Office Outlook
Tampa Bay 2018 Q1 Office OutlookTampa Bay 2018 Q1 Office Outlook
Tampa Bay 2018 Q1 Office OutlookKyle Koller
 
Milwaukee Snapshot - March 2017
Milwaukee Snapshot - March 2017Milwaukee Snapshot - March 2017
Milwaukee Snapshot - March 2017Kyle Koller
 
Milwaukee Chart of the Week October 24th, 2016
Milwaukee Chart of the Week October 24th, 2016Milwaukee Chart of the Week October 24th, 2016
Milwaukee Chart of the Week October 24th, 2016Kyle Koller
 
Milwaukee Chart of the Week August 29th, 2016
Milwaukee Chart of the Week August 29th, 2016Milwaukee Chart of the Week August 29th, 2016
Milwaukee Chart of the Week August 29th, 2016Kyle Koller
 
Milwaukee Chart of the Week August 15th, 2016
Milwaukee Chart of the Week August 15th, 2016Milwaukee Chart of the Week August 15th, 2016
Milwaukee Chart of the Week August 15th, 2016Kyle Koller
 
Milwaukee Chart of the Week March 7th, 2016
Milwaukee Chart of the Week March 7th, 2016Milwaukee Chart of the Week March 7th, 2016
Milwaukee Chart of the Week March 7th, 2016Kyle Koller
 

More from Kyle Koller (7)

Tampa snapshot 11-15-2019
Tampa snapshot 11-15-2019Tampa snapshot 11-15-2019
Tampa snapshot 11-15-2019
 
Tampa Bay 2018 Q1 Office Outlook
Tampa Bay 2018 Q1 Office OutlookTampa Bay 2018 Q1 Office Outlook
Tampa Bay 2018 Q1 Office Outlook
 
Milwaukee Snapshot - March 2017
Milwaukee Snapshot - March 2017Milwaukee Snapshot - March 2017
Milwaukee Snapshot - March 2017
 
Milwaukee Chart of the Week October 24th, 2016
Milwaukee Chart of the Week October 24th, 2016Milwaukee Chart of the Week October 24th, 2016
Milwaukee Chart of the Week October 24th, 2016
 
Milwaukee Chart of the Week August 29th, 2016
Milwaukee Chart of the Week August 29th, 2016Milwaukee Chart of the Week August 29th, 2016
Milwaukee Chart of the Week August 29th, 2016
 
Milwaukee Chart of the Week August 15th, 2016
Milwaukee Chart of the Week August 15th, 2016Milwaukee Chart of the Week August 15th, 2016
Milwaukee Chart of the Week August 15th, 2016
 
Milwaukee Chart of the Week March 7th, 2016
Milwaukee Chart of the Week March 7th, 2016Milwaukee Chart of the Week March 7th, 2016
Milwaukee Chart of the Week March 7th, 2016
 

Recently uploaded

Kohinoor Hinjewadi Phase 2 Pune E-Brochure.pdf
Kohinoor Hinjewadi Phase 2 Pune  E-Brochure.pdfKohinoor Hinjewadi Phase 2 Pune  E-Brochure.pdf
Kohinoor Hinjewadi Phase 2 Pune E-Brochure.pdfManishSaxena95
 
M3M The Line Brochure - Premium Investment Opportunity for Commercial Ventures
M3M The Line Brochure - Premium Investment Opportunity for Commercial VenturesM3M The Line Brochure - Premium Investment Opportunity for Commercial Ventures
M3M The Line Brochure - Premium Investment Opportunity for Commercial Venturessheltercareglobal
 
Girls in Kalyanpuri }Delhi↫8447779280↬Escort Service. In Delhi NCR
Girls in Kalyanpuri }Delhi↫8447779280↬Escort Service. In Delhi NCRGirls in Kalyanpuri }Delhi↫8447779280↬Escort Service. In Delhi NCR
Girls in Kalyanpuri }Delhi↫8447779280↬Escort Service. In Delhi NCRasmaqueen5
 
call girls in ganesh nagar Delhi 8264348440 ✅ call girls ❤️
call girls in ganesh nagar Delhi 8264348440 ✅ call girls ❤️call girls in ganesh nagar Delhi 8264348440 ✅ call girls ❤️
call girls in ganesh nagar Delhi 8264348440 ✅ call girls ❤️soniya singh
 
Call girls in new Ashok NagarDelhi꧁ 8447779280꧂ Escort Service Women Seeking ...
Call girls in new Ashok NagarDelhi꧁ 8447779280꧂ Escort Service Women Seeking ...Call girls in new Ashok NagarDelhi꧁ 8447779280꧂ Escort Service Women Seeking ...
Call girls in new Ashok NagarDelhi꧁ 8447779280꧂ Escort Service Women Seeking ...asmaqueen5
 
2k Shots ≽ 9205541914 ≼ Call Girls In Sainik Farm (Delhi)
2k Shots ≽ 9205541914 ≼ Call Girls In Sainik Farm (Delhi)2k Shots ≽ 9205541914 ≼ Call Girls In Sainik Farm (Delhi)
2k Shots ≽ 9205541914 ≼ Call Girls In Sainik Farm (Delhi)Delhi Call girls
 
9990771857 Call Girls in Dwarka Sector 137 Noida (Call Girls) Delhi
9990771857 Call Girls in Dwarka Sector 137 Noida (Call Girls) Delhi9990771857 Call Girls in Dwarka Sector 137 Noida (Call Girls) Delhi
9990771857 Call Girls in Dwarka Sector 137 Noida (Call Girls) Delhidelhimodel235
 
9990771857 Call Girls in Dwarka Sector 3 Delhi (Call Girls) Delhi
9990771857 Call Girls in Dwarka Sector 3 Delhi (Call Girls) Delhi9990771857 Call Girls in Dwarka Sector 3 Delhi (Call Girls) Delhi
9990771857 Call Girls in Dwarka Sector 3 Delhi (Call Girls) Delhidelhimodel235
 
9990771857 Call Girls in Dwarka Sector 7 Delhi (Call Girls) Delhi
9990771857 Call Girls in Dwarka Sector 7 Delhi (Call Girls) Delhi9990771857 Call Girls in Dwarka Sector 7 Delhi (Call Girls) Delhi
9990771857 Call Girls in Dwarka Sector 7 Delhi (Call Girls) Delhidelhimodel235
 
Shapoorji Pallonji Joyville Vista Pune | Spend Your Family Time Together
Shapoorji Pallonji Joyville Vista Pune | Spend Your Family Time TogetherShapoorji Pallonji Joyville Vista Pune | Spend Your Family Time Together
Shapoorji Pallonji Joyville Vista Pune | Spend Your Family Time Togetheraidasheikh47
 
2k Shot Call girls Aiims Delhi 9205541914
2k Shot Call girls Aiims Delhi 92055419142k Shot Call girls Aiims Delhi 9205541914
2k Shot Call girls Aiims Delhi 9205541914Delhi Call girls
 
Call Girls in Karkardooma Delhi +91 84487779280}Woman Seeking Man in Delhi NCR
Call Girls in Karkardooma Delhi +91 84487779280}Woman Seeking Man in Delhi NCRCall Girls in Karkardooma Delhi +91 84487779280}Woman Seeking Man in Delhi NCR
Call Girls in Karkardooma Delhi +91 84487779280}Woman Seeking Man in Delhi NCRasmaqueen5
 
Call Girls In Vasant Vihar Delhi 💯Call Us 🔝8264348440🔝
Call Girls In Vasant Vihar Delhi 💯Call Us 🔝8264348440🔝Call Girls In Vasant Vihar Delhi 💯Call Us 🔝8264348440🔝
Call Girls In Vasant Vihar Delhi 💯Call Us 🔝8264348440🔝soniya singh
 
Greater Vancouver Realtors Statistics Package April 2024
Greater Vancouver Realtors Statistics Package April 2024Greater Vancouver Realtors Statistics Package April 2024
Greater Vancouver Realtors Statistics Package April 2024VickyAulakh1
 
Premium Villa Projects in Sarjapur Road Bengaluru
Premium Villa Projects in Sarjapur Road BengaluruPremium Villa Projects in Sarjapur Road Bengaluru
Premium Villa Projects in Sarjapur Road BengaluruShivaSeo3
 
BDSM⚡Call Girls in Sector 57 Noida Escorts >༒8448380779 Escort Service
BDSM⚡Call Girls in Sector 57 Noida Escorts >༒8448380779 Escort ServiceBDSM⚡Call Girls in Sector 57 Noida Escorts >༒8448380779 Escort Service
BDSM⚡Call Girls in Sector 57 Noida Escorts >༒8448380779 Escort ServiceDelhi Call girls
 
TENANT SCREENING REPORT SERVICES​ How Tenant Screening Reports Work
TENANT SCREENING REPORT SERVICES​ How Tenant Screening Reports WorkTENANT SCREENING REPORT SERVICES​ How Tenant Screening Reports Work
TENANT SCREENING REPORT SERVICES​ How Tenant Screening Reports WorkTurbo Tenant
 
Mahindra Happinest Tathawade Pune Brochure.pdf
Mahindra Happinest Tathawade Pune Brochure.pdfMahindra Happinest Tathawade Pune Brochure.pdf
Mahindra Happinest Tathawade Pune Brochure.pdfBabyrudram
 
Magarpatta Nova Elegance Mundhwa Pune E-Brochure.pdf
Magarpatta Nova Elegance Mundhwa Pune  E-Brochure.pdfMagarpatta Nova Elegance Mundhwa Pune  E-Brochure.pdf
Magarpatta Nova Elegance Mundhwa Pune E-Brochure.pdfManishSaxena95
 
Majestique Viman Nagar Pune Brochure.pdf
Majestique Viman Nagar Pune Brochure.pdfMajestique Viman Nagar Pune Brochure.pdf
Majestique Viman Nagar Pune Brochure.pdfBabyrudram
 

Recently uploaded (20)

Kohinoor Hinjewadi Phase 2 Pune E-Brochure.pdf
Kohinoor Hinjewadi Phase 2 Pune  E-Brochure.pdfKohinoor Hinjewadi Phase 2 Pune  E-Brochure.pdf
Kohinoor Hinjewadi Phase 2 Pune E-Brochure.pdf
 
M3M The Line Brochure - Premium Investment Opportunity for Commercial Ventures
M3M The Line Brochure - Premium Investment Opportunity for Commercial VenturesM3M The Line Brochure - Premium Investment Opportunity for Commercial Ventures
M3M The Line Brochure - Premium Investment Opportunity for Commercial Ventures
 
Girls in Kalyanpuri }Delhi↫8447779280↬Escort Service. In Delhi NCR
Girls in Kalyanpuri }Delhi↫8447779280↬Escort Service. In Delhi NCRGirls in Kalyanpuri }Delhi↫8447779280↬Escort Service. In Delhi NCR
Girls in Kalyanpuri }Delhi↫8447779280↬Escort Service. In Delhi NCR
 
call girls in ganesh nagar Delhi 8264348440 ✅ call girls ❤️
call girls in ganesh nagar Delhi 8264348440 ✅ call girls ❤️call girls in ganesh nagar Delhi 8264348440 ✅ call girls ❤️
call girls in ganesh nagar Delhi 8264348440 ✅ call girls ❤️
 
Call girls in new Ashok NagarDelhi꧁ 8447779280꧂ Escort Service Women Seeking ...
Call girls in new Ashok NagarDelhi꧁ 8447779280꧂ Escort Service Women Seeking ...Call girls in new Ashok NagarDelhi꧁ 8447779280꧂ Escort Service Women Seeking ...
Call girls in new Ashok NagarDelhi꧁ 8447779280꧂ Escort Service Women Seeking ...
 
2k Shots ≽ 9205541914 ≼ Call Girls In Sainik Farm (Delhi)
2k Shots ≽ 9205541914 ≼ Call Girls In Sainik Farm (Delhi)2k Shots ≽ 9205541914 ≼ Call Girls In Sainik Farm (Delhi)
2k Shots ≽ 9205541914 ≼ Call Girls In Sainik Farm (Delhi)
 
9990771857 Call Girls in Dwarka Sector 137 Noida (Call Girls) Delhi
9990771857 Call Girls in Dwarka Sector 137 Noida (Call Girls) Delhi9990771857 Call Girls in Dwarka Sector 137 Noida (Call Girls) Delhi
9990771857 Call Girls in Dwarka Sector 137 Noida (Call Girls) Delhi
 
9990771857 Call Girls in Dwarka Sector 3 Delhi (Call Girls) Delhi
9990771857 Call Girls in Dwarka Sector 3 Delhi (Call Girls) Delhi9990771857 Call Girls in Dwarka Sector 3 Delhi (Call Girls) Delhi
9990771857 Call Girls in Dwarka Sector 3 Delhi (Call Girls) Delhi
 
9990771857 Call Girls in Dwarka Sector 7 Delhi (Call Girls) Delhi
9990771857 Call Girls in Dwarka Sector 7 Delhi (Call Girls) Delhi9990771857 Call Girls in Dwarka Sector 7 Delhi (Call Girls) Delhi
9990771857 Call Girls in Dwarka Sector 7 Delhi (Call Girls) Delhi
 
Shapoorji Pallonji Joyville Vista Pune | Spend Your Family Time Together
Shapoorji Pallonji Joyville Vista Pune | Spend Your Family Time TogetherShapoorji Pallonji Joyville Vista Pune | Spend Your Family Time Together
Shapoorji Pallonji Joyville Vista Pune | Spend Your Family Time Together
 
2k Shot Call girls Aiims Delhi 9205541914
2k Shot Call girls Aiims Delhi 92055419142k Shot Call girls Aiims Delhi 9205541914
2k Shot Call girls Aiims Delhi 9205541914
 
Call Girls in Karkardooma Delhi +91 84487779280}Woman Seeking Man in Delhi NCR
Call Girls in Karkardooma Delhi +91 84487779280}Woman Seeking Man in Delhi NCRCall Girls in Karkardooma Delhi +91 84487779280}Woman Seeking Man in Delhi NCR
Call Girls in Karkardooma Delhi +91 84487779280}Woman Seeking Man in Delhi NCR
 
Call Girls In Vasant Vihar Delhi 💯Call Us 🔝8264348440🔝
Call Girls In Vasant Vihar Delhi 💯Call Us 🔝8264348440🔝Call Girls In Vasant Vihar Delhi 💯Call Us 🔝8264348440🔝
Call Girls In Vasant Vihar Delhi 💯Call Us 🔝8264348440🔝
 
Greater Vancouver Realtors Statistics Package April 2024
Greater Vancouver Realtors Statistics Package April 2024Greater Vancouver Realtors Statistics Package April 2024
Greater Vancouver Realtors Statistics Package April 2024
 
Premium Villa Projects in Sarjapur Road Bengaluru
Premium Villa Projects in Sarjapur Road BengaluruPremium Villa Projects in Sarjapur Road Bengaluru
Premium Villa Projects in Sarjapur Road Bengaluru
 
BDSM⚡Call Girls in Sector 57 Noida Escorts >༒8448380779 Escort Service
BDSM⚡Call Girls in Sector 57 Noida Escorts >༒8448380779 Escort ServiceBDSM⚡Call Girls in Sector 57 Noida Escorts >༒8448380779 Escort Service
BDSM⚡Call Girls in Sector 57 Noida Escorts >༒8448380779 Escort Service
 
TENANT SCREENING REPORT SERVICES​ How Tenant Screening Reports Work
TENANT SCREENING REPORT SERVICES​ How Tenant Screening Reports WorkTENANT SCREENING REPORT SERVICES​ How Tenant Screening Reports Work
TENANT SCREENING REPORT SERVICES​ How Tenant Screening Reports Work
 
Mahindra Happinest Tathawade Pune Brochure.pdf
Mahindra Happinest Tathawade Pune Brochure.pdfMahindra Happinest Tathawade Pune Brochure.pdf
Mahindra Happinest Tathawade Pune Brochure.pdf
 
Magarpatta Nova Elegance Mundhwa Pune E-Brochure.pdf
Magarpatta Nova Elegance Mundhwa Pune  E-Brochure.pdfMagarpatta Nova Elegance Mundhwa Pune  E-Brochure.pdf
Magarpatta Nova Elegance Mundhwa Pune E-Brochure.pdf
 
Majestique Viman Nagar Pune Brochure.pdf
Majestique Viman Nagar Pune Brochure.pdfMajestique Viman Nagar Pune Brochure.pdf
Majestique Viman Nagar Pune Brochure.pdf
 

JLL - Tampa Bay 2018 Q2 Industrial Outlook

  • 1. © 2018 Jones Lang LaSalle IP, Inc. All rights reserved. All information contained herein is from sources deemed reliable; however, no representation or warranty is made to the accuracy thereof. Q2 2018 Tampa Bay Industrial Insight The strong start to 2018 slowed a bit in the second quarter, yet market fundamentals continue to remain strong. Over 350,000 square feet of positive absorption nearly aligns year-to-date absorption with year-to-date deliveries, a phenomenon we have not witnessed over the past five years. In fact, the market is typically slow to build, as evident by the supply and demand chart showing annual net absorption outpacing deliveries by a significant amount each year. The better matchup this year has helped keep vacancy rates hovering just over 4.0 percent for the market, and could be the first indication that the ever shrinking availability of space could be relieved with new construction in the second half of 2018. Polk County was again the largest contributor to absorption for the quarter, with Medline Distribution and West Logistics move-ins at the newly delivered Medline Distribution Center in Auburndale as main drivers. Where the first quarter was made up of a fewer, large transactions, absorption for the second quarter was largely made up of small or moderate move-ins/outs. With over 3.0 million square feet of the currently under construction product scheduled to deliver before the end of the year, large transactions could again be the trend over the next six months. Outlook Another quarter of strong fundamentals lays a solid groundwork for the handful of speculative projects coming online. The landscape is still favorable to new, large blocks of space that are really only competing with other brand new product given the lack of availability in existing stock. While the current match up of absorption to the pace of deliveries could result in a stabilized vacancy rate by the end of the year, asking rates and absorption should continue to climb as new product continues to be leased. Fundamentals Forecast YTD net absorption 1,749,939 s.f. ▲ QTD net absorption 367,123 s.f. ▲ Under construction 4,353,388 s.f. ▲ Total vacancy 4.2% ▼ Average asking rent (NNN) $5.70 p.s.f. ▲ Tenant improvements Falling ▼ 0 2,000,000 4,000,000 6,000,000 2013 2014 2015 2016 2017 YTD 2018 Supply and demand (s.f.) Net absorption Deliveries Vacancy rates steady with better match between absorption and deliveries 9.4% 7.9% 6.6% 5.7% 4.8% 4.2% 2013 2014 2015 2016 2017 2018 YTD Total vacancy For more information, contact: Kyle Koller | Kyle.Koller@am.jll.com • Net absorption, while still positive this quarter, was about 1/5th of the activity we saw to start the year. • Vacancy rates could be starting to level off, as we see new deliveries keeping pace with annual absorption levels. • Asking rate increases slowed to just a 0.5 percent increase quarter over quarter, up 1.2 percent since the start of the year. $0.00 $2.00 $4.00 $6.00 2013 2014 2015 2016 2017 2018 YTD Average asking rents ($/s.f.) W&D Manufacturing
  • 2. Tampa Bay Q2 2018 Industrial Statistics Inventory (s.f.) Quarterly total net absorption (s.f.) YTD total net absorption (s.f.) YTD total net absorption (% of stock) Total vacancy (%) Total availability (%) Average total asking rent ($ p.s.f.) Quarterly completions (s.f.) YTD completions (s.f.) Under construction (s.f.) Tampa Bay Totals Warehouse & Distribution 151,659,310 624,685 2,115,116 1.4% 4.3% 10.0% $5.61 526,061 1,548,302 4,353,388 Manufacturing 53,810,073 -257,562 -365,177 -0.7% 4.2% 5.1% $6.18 30,200 30,200 0 Totals 205,469,383 367,123 1,749,939 0.9% 4.2% 8.7% $5.70 556,261 1,578,502 4,353,388 Submarkets North Pinellas Warehouse & Distribution 4,582,189 -40,060 -42,903 -0.9% 2.7% 4.0% $6.75 0 0 0 Manufacturing 2,018,122 -25,575 -25,575 -1.3% 2.4% 2.6% $5.75 0 0 0 Totals 6,600,311 -65,635 -68,478 -1.0% 2.7% 3.6% $6.53 0 0 0 Mid Pinellas Warehouse & Distribution 7,410,276 46,492 63,979 0.9% 1.8% 5.7% $6.36 126,000 158,000 10,450 Manufacturing 7,928,235 5,108 4,608 0.1% 5.6% 7.3% $6.37 0 0 0 Totals 15,338,511 51,600 68,587 0.4% 3.8% 6.5% $6.37 126,000 158,000 10,450 Gateway Warehouse & Distribution 9,917,207 113,856 -12,145 -0.1% 4.3% 8.7% $6.77 0 0 65,000 Manufacturing 7,977,817 -149,242 -216,765 -2.7% 7.6% 7.3% $6.08 0 0 0 Totals 17,895,024 -35,386 -228,910 -1.3% 5.7% 8.1% $6.48 0 0 65,000 South Pinellas Warehouse & Distribution 7,016,165 -174,418 -164,460 -2.3% 3.8% 6.7% $5.10 0 0 0 Manufacturing 3,046,789 -35,327 -32,296 -1.1% 3.8% 6.6% $6.12 0 0 0 Totals 10,062,954 -209,745 -196,756 -2.0% 3.8% 6.7% $5.41 0 0 0 Westshore/Airport Warehouse & Distribution 9,718,778 -50,445 -44,497 -0.5% 3.8% 6.3% $6.65 0 0 21,000 Manufacturing 2,824,723 7,394 41,724 1.5% 1.6% 3.0% $6.15 0 0 0 Totals 12,543,501 -43,051 -2,773 0.0% 3.3% 5.5% $6.59 0 0 21,000 East Side Warehouse & Distribution 49,768,236 -157,286 93,181 0.2% 6.3% 13.2% $5.54 340,061 472,102 1,892,704 Manufacturing 10,444,871 143,402 160,613 1.5% 1.9% 4.4% $5.26 0 0 0 Totals 60,213,107 -13,884 253,794 0.4% 5.5% 11.7% $5.52 340,061 472,102 1,892,704 Manatee/Sarasota County Warehouse & Distribution 22,991,507 38,858 104,676 0.5% 3.1% 5.6% $7.19 60,000 88,200 406,000 Manufacturing 8,486,933 -88,169 -153,997 -1.8% 4.0% 4.8% $7.80 0 0 0 Totals 31,478,440 -49,311 -49,321 -0.2% 3.3% 5.4% $7.34 60,000 88,200 406,000 East Polk Warehouse & Distribution 15,647,713 669,391 1,206,925 7.7% 5.0% 14.8% $4.71 0 830,000 207,676 Manufacturing 3,808,800 -173,633 -173,633 -4.6% 5.7% 3.7% $2.47 0 0 0 Totals 19,456,513 495,758 1,033,292 5.3% 5.1% 12.7% $4.58 0 830,000 207,676 West Polk Warehouse & Distribution 24,607,239 178,297 910,360 3.7% 2.2% 10.0% $5.04 0 0 1,750,558 Manufacturing 7,273,783 58,480 30,144 0.4% 3.1% 3.5% $6.99 30,200 30,200 0 Totals 31,881,022 236,777 940,504 3.0% 2.4% 8.5% $5.22 30,200 30,200 1,750,558 Kyle Koller | Senior Research Analyst 401 East Jackson, Suite 1500, Tampa Bay, FL 33602 | tel +1 813 387 1323 | kyle.koller@am.jll.com 2018 Jones Lang LaSalle IP, Inc. All rights reserved.