More Related Content Similar to JLL West Michigan Industrial Insight & Statistics - Q2 2018 (20) 1. © 2018 Jones Lang LaSalle IP, Inc. All rights reserved. All information contained herein is from sources deemed reliable; however, no representation or warranty is made to the accuracy thereof.
Q2 2018
West Michigan
Industrial Insight
Conditions remain strong in the West Michigan industrial market. Vacancy
currently sits at 3.9 percent, as over 1.1 million square feet has been absorbed
so far in 2018. We continue to see positive rent growht, driven by compressed
vacancies and high demand still in the market. Spaces have been leasing fast,
and buildings that are for sale are not on the market for long. Vacancy can
only go so much lower than the current 3.9 percent, so there is certainly a
market for new construction.
Construction activity is accelerating with a handful of large scale projects
under development. The 200,000-square-foot building at 701 Ann is being
redeveloped as a new industrial site and Visser is planning a new
development in Southeast Grand Rapids, while an out of town developer is
planning on renovating the old 3.0 million square foot Keeler Brass Building.
KL Industries is working with Grooters Development on a 490,000-square-foot
facility at 2420 Remembrance Drive in Muskegon and Amazon is planning to
invest $150.0 million in a new 855,000-square-foot fulfillment center in Gaines
Township. Expansions remain common across the region, as users are
outgrowing their facilities. Some examples include HexArmor moving into a
larger space at 640 Leffingwell Ave NE and Almond Products adding a 55,000-
square-foot addition to its Spring Lake facility.
Outlook
Looking forward to the remainder of the year, we expect demand to remain at
historically high levels. Construction will continue, with more speculative
projects being added to the build-to-suit pipeline. Land sales have already
begun to pick up for future development. Rent growth will likely continue in
the quarters ahead while money coming in from outside the region will push
better pricing and cap rates as the overall outlook improves.
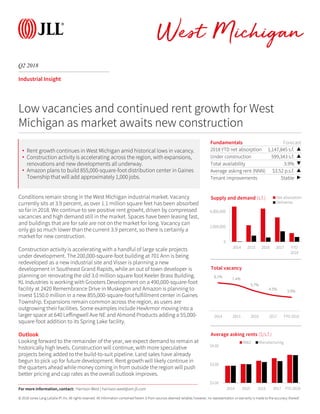
Fundamentals Forecast
2018 YTD net absorption 1,147,845 s.f. ▲
Under construction 599,343 s.f. ▲
Total availability 3.9% ▼
Average asking rent (NNN) $3.52 p.s.f. ▲
Tenant improvements Stable ▶
0
2,000,000
4,000,000
2014 2015 2016 2017 YTD
2018
Supply and demand (s.f.) Net absorption
Deliveries
Low vacancies and continued rent growth for West
Michigan as market awaits new construction
8.1%
7.4%
5.7%
4.5% 3.9%
2014 2015 2016 2017 YTD 2018
Total vacancy
For more information, contact: Harrison West | harrison.west@am.jll.com
• Rent growth continues in West Michigan amid historical lows in vacancy.
• Construction activity is accelerating across the region, with expansions,
renovations and new developments all underway.
• Amazon plans to build 855,000-square-foot distribution center in Gaines
Township that will add approximately 1,000 jobs.
$2.00
$3.00
$4.00
2014 2015 2016 2017 YTD 2018
Average asking rents ($/s.f.)
W&D Manufacturing
2. © 2018 Jones Lang LaSalle IP, Inc. All rights reserved. All information contained herein is from sources deemed reliable; however, no representation or warranty is made to the accuracy thereof.
Q2 2018
West Michigan
Industrial Statistics
For more information, contact: Harrison West | harrison.west@am.jll.com
Inventory
(s.f.)
YTD
total net
absorption
(s.f.)
YTD
total net
absorption
(% of stock)
Total
availability
(s.f.)
Total
availability
(%)
Average
total asking
rent
($ p.s.f.)
YTD
completions
(s.f.)
Under
construction
(s.f.)
Market Totals
Warehouse & Distribution 105,493,287 813,458 0.8% 5,735,905 5.4% $3.52 558,278 563,343
Manufacturing 130,590,111 334,387 0.3% 3,423,874 2.6% $3.50 81,712 36,000
Totals 236,083,398 1,147,845 0.5% 9,159,779 3.9% $3.52 639,990 599,343
Flex 10,389,445 50,536 0.5% 445,672 4.3% $7.18 0 0
Northeast Grand Rapids
Warehouse & Distribution 6,936,764 -8,374 -0.1% 142,880 2.1% $2.82 0 0
Manufacturing 7,818,787 7,191 0.1% 277,331 3.5% $3.64 0 0
Totals 14,755,551 -1,183 0.0% 420,211 2.8% $3.36 0 0
Flex 266,671 0 0.0% 0 0.0% $0.00 0 0
Northwest Grand Rapids
Warehouse & Distribution 8,838,382 123,336 1.4% 360,503 4.1% $3.11 36,250 0
Manufacturing 12,268,413 73,743 0.6% 589,001 4.8% $3.29 0 0
Totals 21,106,795 197,079 0.9% 949,504 4.5% $3.22 36,250 0
Flex 1,166,957 0 0.0% 0 0.0% $0.00 0 0
Southeast Grand Rapids
Warehouse & Distribution 32,147,753 -84,118 -0.3% 1,550,437 4.8% $3.42 441,028 0
Manufacturing 28,815,222 282,776 1.0% 538,216 1.9% $3.90 0 0
Totals 60,962,975 198,658 0.3% 2,088,653 3.4% $3.54 441,028 0
Flex 3,571,213 -16,225 -0.5% 40,631 1.1% $8.33 0 0
Southwest Grand Rapids
Warehouse & Distribution 14,418,351 133,793 0.9% 260,900 1.8% $4.42 81,000 250,000
Manufacturing 28,098,273 49,586 0.2% 279,572 1.0% $4.06 0 0
Totals 42,516,624 183,379 0.4% 540,472 1.3% $4.23 81,000 250,000
Flex 809,872 2,294 0.3% 0 0.0% $0.00 0 0
Southwest Michigan
Warehouse & Distribution 21,483,009 668,896 3.1% 2,913,962 13.6% $3.61 0 163,343
Manufacturing 24,118,216 525,043 2.2% 725,218 3.0% $3.40 0 36,000
Totals 45,601,225 1,193,939 2.6% 3,639,180 8.0% $3.57 0 199,343
Flex 2,651,262 46,429 1.8% 230,582 8.7% $7.50 0 0
West Shore
Warehouse & Distribution 21,669,028 -20,075 -0.1% 507,223 2.3% $3.38 0 150,000
Manufacturing 29,471,200 -603,952 -2.0% 1,014,536 3.4% $3.30 81,712 0
Totals 51,140,228 -624,027 -1.2% 1,521,759 3.0% $3.33 81,712 150,000
Flex 1,923,470 18,038 0.9% 174,459 9.1% $6.50 0 0