Utilizing Ground Penetrating Radar (GPR) to Investigate the Temporal and Spatial Distribution of Biogenic Gases from Peat Soils at the Loxahatchee Impoundment Landscape Assessment (LILA)

Peatlands are large terrestrial storages for carbon (C) and sources of greenhouse gases such as methane (CH4) and carbon dioxide (CO2). Although many studies over the last two decades have focused on estimating carbon fluxes from peatlands (particularly in boreal systems), the temporal and spatial distribution of biogenic gases within the peat soil is still not well understood. Furthermore, most of these previous studies were conducted in high-latitude peatlands, while recent research suggests that gas production and emission rates from low-latitude peatlands in areas such as the Everglades may be larger than what was previously thought. The research presented here investigates the spatial and temporal variability of gas dynamics in low-latitude peatlands at the field scale (1-10m). This study was conducted in the landscape scale Loxahatchee Impoundment Landscape Assessment (LILA), an 80 acre, hydrologically controlled model containing the four different environments found in the 1.7 million acre Everglades. Here we used a 2-D grid of GPR transects in conjunction with gas chambers monitored with time-lapse photography and surface deformation measurements to monitor gas accumulation and release over an approximate 100 m² area. This work has implications for better estimating carbon fluxes from peat soils in the Everglades, and highlights the spatial and temporal heterogeneity of gas dynamics.
Recommended

Recommended
More Related Content
What's hot
What's hot (20)
Viewers also liked
Viewers also liked (19)
Similar to Utilizing Ground Penetrating Radar (GPR) to Investigate the Temporal and Spatial Distribution of Biogenic Gases from Peat Soils at the Loxahatchee Impoundment Landscape Assessment (LILA)
Similar to Utilizing Ground Penetrating Radar (GPR) to Investigate the Temporal and Spatial Distribution of Biogenic Gases from Peat Soils at the Loxahatchee Impoundment Landscape Assessment (LILA) (20)
Recently uploaded
Recently uploaded (20)
Utilizing Ground Penetrating Radar (GPR) to Investigate the Temporal and Spatial Distribution of Biogenic Gases from Peat Soils at the Loxahatchee Impoundment Landscape Assessment (LILA)
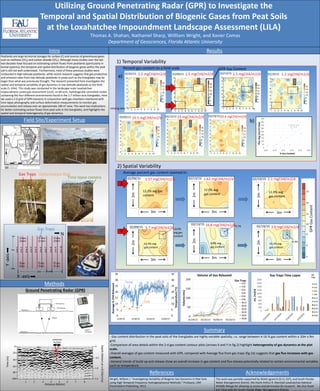
- 1. 00 Utilizing Ground Penetrating Radar (GPR) to Investigate the Temporal and Spatial Distribution of Biogenic Gases from Peat Soils at the Loxahatchee Impoundment Landscape Assessment (LILA) Thomas A. Shahan, Nathaniel Sharp, Willliam Wright, and Xavier Comas Department of Geosciences, Florida Atlantic University Peatlands are large terrestrial storages for carbon (C) and sources of greenhouse gases such as methane (CH4) and carbon dioxide (CO2). Although many studies over the last two decades have focused on estimating carbon fluxes from peatlands (particularly in boreal systems), the temporal and spatial distribution of biogenic gases within the peat soil is still not well understood. Furthermore, most of these previous studies were conducted in high-latitude peatlands, while recent research suggests that gas production and emission rates from low-latitude peatlands in areas such as the Everglades may be larger than what was previously thought. The research presented here investigates the spatial and temporal variability of gas dynamics in low-latitude peatlands at the field scale (1-10m). This study was conducted in the landscape scale Loxahatchee Impoundment Landscape Assessment (LILA), an 80 acre, hydrologically controlled model containing the four different environments found in the 1.7 million acre Everglades. Here we used a 2-D grid of GPR transects in conjunction with gas chambers monitored with time-lapse photography and surface deformation measurements to monitor gas accumulation and release over an approximate 100 m² area. This work has implications for better estimating carbon fluxes from peat soils in the Everglades, and highlights the spatial and temporal heterogeneity of gas dynamics. Intro Field Site/Experiment Setup Gas Traps Deformation Rod Methods Time lapse camera 160 MHz GPR Raft Results Line1 Line10 Line9 Line8 Line7 Line6 Line5 Line4 Line3 Line2 X -axis Y-axis Gas Traps N 1m Time(ns) Distance (Meter) Depth(Meter)atv=0.03(m/ns) 0 20 40 60 80 100 1 2 3 4 5 6 7 8 0 0.5 1.0 1.5 antennas Tx Rx Ground Penetrating Radar (GPR) References Acknowledgements Wright, William J. "Investigating Variability of Biogenic Gas Dynamics in Peat Soils using High Temporal Frequency Hydrogeophysical Methods." ProQuest, UMI Dissertations Publishing, 2013. This work was partially supported by NOAA (grant # GC11-337), and South Florida Water Management District, We thank Arthur R. Marshall Loxahatchee National Wildlife Refuge for allowing us access and permission for research. We also thank Eric Cline with the South Florida Water Management District. - Gas content distribution in the peat soils of the Everglades are highly variable spatially; i.e. range between 4-16 % gas content within a 10m x 9m grid. -Comparison of area details within the 2-d gas content contour plots (arrows X and Y in fig.2) highlight heterogeneity of gas dynamics at the plot scale. -Overall averages of gas content measured with GPR, compared with Average flux from gas traps (fig.1b) suggests that gas flux increases with gas content. -General trends of build up and release show an overall increase in gas content and flux release potentially related to certain environmental variables such as temperature. 1) Temporal Variability Summary 2) Spatial Variability 1.5 mgCH4/m2/d 2.5 mgCH4/m2/d02/13/15 Percent gas content on a field scale EA1 EB1 EA2 EB2 EA3 EB3 WA1 WB1 WA2 WB2 WA3 WB3 2.2 mgCH4/m2/d 8 02/02/15 1.2 mgCH4/m2/d02/19/15 19.5 mgCH4/m2/d03/05/15 02/09/15 Average percent gas content zoomed in: b) a) missing data 2m 3m 02/09/15 12.2% avg gas content 2m 3m 02/13/15 12.0% avg gas content 2m 3m 02/19/15 11.9% avg gas content X 2m 3m 02/09/15 Y 13.4% avg gas content 14.0% avg gas content 5.7 mgCH4/m2/d 2m 3m 02/13/15 9.7%16.8 mgCH4/m2/d 2m 3m 02/19/15 9.3% 10.2% avg gas content 3.9 mgCH4/m2/d 10m 9m 33 mgCH4/m2/d03/12/15 69.4 mgCH4/m2/d03/19/15 Y X GPR Gas Content 16 14 12 10 8 6 4 GPRGasContent 8.9% avg gas content 1.57 mgCH4/m2/d 1.63 mgCH4/m2/d 2.1 mgCH4/m2/d