More Related Content
Similar to FINAL PRINT - PXRF Soil Salinity SS
Similar to FINAL PRINT - PXRF Soil Salinity SS (20)
FINAL PRINT - PXRF Soil Salinity SS
- 1. Soil Salinity Measurement Via Portable X-ray
Fluorescence Spectrometry
Samantha Swanhart,1
David C. Weindorf,2
Somsubhra Chakraborty,3
Noura Bakr,4
Yuanda Zhu,1
Courtney Nelson,1
Kayla Shook,1
and Autumn Acree1
Abstract: Saline soils are defined as those containing appreciable salts
more soluble than gypsum (e.g., various combinations of Na+
, Mg2+
,
Ca2+
, K+
, Cl−
, SO4
2-
, HCO3
−
, and CO3
2-
). Saline soils can occur across di-
verse climates and geological settings. As such, salinity is not germane
to specific soil textures or parent materials. Traditional methods of measur-
ing soil salinity (e.g., electrical conductance), although accurate, provide
limited data and require laboratory analysis. Given the success of previous
studies using portable X-ray fluorescence (PXRF) as a tool for measuring
soil characteristics, this study evaluated its applicability for soil salinity de-
termination. Portable X-ray fluorescence offers accurate quantifiable data
that can be produced rapidly, in situ, and with minimal sample preparation.
For this study, 122 surface soil samples (0–15 cm) were collected from
salt-impacted soils of coastal Louisiana. Soil samples were subjected
to standard soil characterization, including particle size analysis, loss-
on-ignition organic matter, electrical conductivity (EC), and elemental
quantification via PXRF. Simple and multiple linear regression models
were developed to correlate elemental concentrations and auxiliary input
parameters (simple: Cl; multiple: Cl, S, K, Ca, sand, clay, and organic
matter) to EC results. In doing so, logarithmic transformation was used
to normalize the variables to obtain a normal distribution for the error
term (residual, ei). Although both models resulted in similar acceptable
r2
between soil EC and elemental data produced by PXRF (0.83 and
0.90, respectively), multiple linear regression is recommended. In sum-
mary, PXRF has the ability to predict soil EC with reasonable accuracy
from elemental data.
Key Words: Electrical conductivity, portable X-ray fluorescence, salinity
(Soil Sci 2014;179: 417–423)
Traditionally, saline soil has been defined as soil containing
salts more soluble than gypsum (e.g., various combinations
of Na+
, Mg2+
, Ca2+
, K+
, Cl−
, SO4
2-
, HCO3
−
, and CO3
2-
) that can ad-
versely affect soil fertility (US Soil Salinity Laboratory Staff,
1954). Worldwide, more than 20% of irrigated land has been neg-
atively impacted by soil salinization. Salinity effectively lowers
the osmotic potential of water, making it more difficult for plants
to absorb water into their roots.
Soil salinity can develop in many different climates and/
or geological settings. Thus, it is not limited to any specific
characteristic (e.g., textures or parent materials) (Zeng and Shannon,
2000; Caballero et al., 2001; Biggs and Jiang, 2009). For ex-
ample, saline soils develop in coastal regions, arid to semiarid
regions where evaporation exceeds precipitation, and areas of an-
thropogenic impact (e.g., oil production wells pumping brine to
surface for containment in artificial ponds; irrigation with brack-
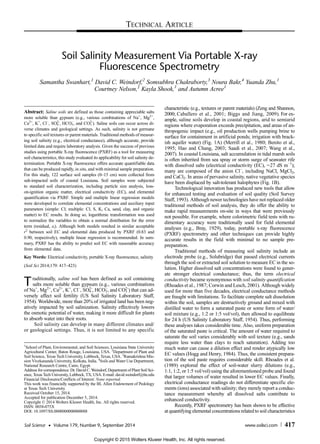
ish aquifer water) (Fig. 1A) (Merrill et al., 1980; Benito et al.,
1995; Hao and Chang, 2003; Saadi et al., 2007; Wang et al.,
2007). In coastal Louisiana, salt accumulation in tidal marsh soils
is often inherited from sea spray or storm surge of seawater rife
with dissolved salts (electrical conductivity (EC), ∼27 dS m−1
);
many are composed of the anion Cl−
, including NaCl, MgCl2,
and CaCl2. In areas of pervasive salinity, native vegetative species
have been displaced by salt-tolerant halophytes (Fig. 1B).
Technological innovation has produced new tools that allow
for enhanced testing and evaluation of soil quality (Soil Survey
Staff, 1993). Although newer technologies have not replaced older
traditional methods of soil analysis, they do offer the ability to
make rapid measurements on-site in ways that were previously
not possible. For example, where colorimetric field tests with ru-
dimentary accuracy were traditionally used for field elemental
analyses (e.g., Bray, 1929), today, portable x-ray fluorescence
(PXRF) spectrometry and other techniques can provide highly
accurate results in the field with minimal to no sample pre-
preparation.
Traditional methods of measuring soil salinity include an
electrode probe (e.g., Solubridge) that passed electrical currents
through the soil or extracted soil solution to measure EC in the so-
lution. Higher dissolved salt concentrations were found to gener-
ate stronger electrical conductance; thus, the term electrical
conductivity became synonymous with soil salinity quantification
(Rhoades et al., 1987; Corwin and Lesch, 2001). Although widely
used for more than five decades, electrical conductance methods
are fraught with limitations. To facilitate complete salt dissolution
within the soil, samples are destructively ground and mixed with
distilled water to form a saturated paste or some form of water/
soil mixture (e.g., 1:2 or 1:5 vol/vol), then allowed to equilibrate
for 24 h (US Salinity Laboratory Staff, 1954). Thus, performing
these analyses takes considerable time. Also, uniform preparation
of the saturated paste is critical. The amount of water required to
saturate the soil varies considerably with soil texture (e.g., sands
require less water than clays to reach saturation). Adding too
much water can cause a dilution effect and render atypically low
EC values (Hogg and Henry, 1984). Thus, the consistent prepara-
tion of the soil paste requires considerable skill. Rhoades et al.
(1989) explored the effect of soil-water slurry dilutions (e.g.,
1:1, 1:2, or 1:5 vol/vol) using the aforementioned probe and found
that larger volumes of water resulted in lower EC values. Finally,
electrical conductance readings do not differentiate specific ele-
ments (ions) associated with salinity; they merely report a conduc-
tance measurement whereby all dissolved salts contribute to
enhanced conductivity.
Recently, PXRF spectrometry has been shown to be effective
at quantifying elemental concentrations related to soil characteristics
1
School of Plant, Environmental, and Soil Sciences, Louisiana State University
Agricultural Center, Baton Rouge, Louisiana, USA. 2
Department of Plant and
Soil Science, Texas Tech University, Lubbock, Texas, USA. 3
Ramakrishna Mis-
sion Vivekananda University, Kolkata, India. 4
Soils and Water Use Department,
National Research Centre, Cairo, Egypt.
Address for correspondence: Dr. David C. Weindorf, Department of Plant Soil Sci-
ence, Texas Tech University, Lubbock, TX, USA. E-mail: david.weindorf@ttu.edu
Financial Disclosures/Conflicts of Interest: None reported.
This work was financially supported by the BL Allen Endowment of Pedology
at Texas Tech University.
Received October 15, 2014.
Accepted for publication December 5, 2014.
Copyright © 2014 Wolters Kluwer Health, Inc. All rights reserved.
ISSN: 0038-075X
DOI: 10.1097/SS.0000000000000088
TECHNICAL ARTICLE
Soil Science • Volume 179, Number 9, September 2014 www.soilsci.com 417
Copyright © 2015 Wolters Kluwer Health, Inc. All rights reserved.
- 2. including gypsum content (Weindorf et al., 2009, 2013), soil tex-
ture (Zhu et al., 2011), soil pH (Sharma et al., 2014a), soil cation
exchange capacity (Sharma et al., 2014b), and pedon horizonation
(Weindorf et al., 2012). A contemporary overview of PXRF and
its applications for environmental, agronomic, and soil science ap-
plications is provided by Weindorf et al. (2014). X-ray fluores-
cence is a technique using X-rays generated from a Ta/Au, Rh,
or other X-ray tube, which strike the soil. When X-rays strike mat-
ter, they cause inner shell electrons to be ejected (Jones, 1982).
Subsequently, outer shell electrons cascade down to fill the inner
electron shell void. In doing so, they must relinquish energy that is
emitted as fluorescence. The wavelength (energy) of emitted radi-
ation is specific to each element while the intensity is proportional
to elemental abundance. Although the technique has been sanc-
tioned by the US Environmental Protection Agency (2007) for
use in soils and sediments, it does have some limitations. Piorek
(1998) outlines techniques for optimizing PXRF performance
through sample homogenization, using multiple scans per sample,
and increasing X-ray beam exposure time to ensure optimal mea-
surement of fluoresced X-ray photons. For example, shorter mea-
surements of less than 60 sec are appropriate for initial screening
of specific elements, whereas longer measurements of up to
300 sec are suitable for precise and accurate measurements. A
few sources of error must also be considered with PXRF: (i) mois-
ture, (ii) sample heterogeneity, and (iii) interelemental inter-
ferences. Zhu et al. (2011) noted that excessive (>20%) soil
moisture degraded the accuracy of PXRF data. Specifically, when
only dry sample scans were considered, the correlation between
PXRF readings and laboratory measurements improved substan-
tially. Another disadvantage of in situ measurements is the degree
of uncertainty caused by sample heterogeneity (Argyraki et al.,
1997; Zhu et al., 2011). Jones (1982) noted that sample homoge-
neity is promoted when soils are dried and ground to pass a 2-mm
sieve; practices followed as part of this study. Importantly, many
salt-impacted soils occur in naturally dry environments such as
deserts or semiarid areas where soil moisture would be nominal.
Finally, with respect to salinity assessment, current PXRF equip-
ment is not able to quantify Na directly given its small stable elec-
tron cloud. Nonetheless, many Na-based salts often associate with
Cl, which can accurately be quantified by PXRF. Given the suc-
cess of previous studies using PXRF as a tool for measuring soil
characteristics, the evaluation of soil salinity with PXRF spec-
trometry seems timely. Portable X-ray fluorescence produces
accurate quantifiable data on-site and can be uniquely used in ap-
plications where nondestructive sampling is required (Weindorf
et al., 2012). The present study is an extension of work originally
undertaken by Swanhart (2013), a graduate research thesis on
PXRF applications in salt-impacted soils.
In recognition of the potential benefits PXRF affords soil sa-
linity assessment, the objectives of this research were to (i) collect
a wide variety of salt-impacted soil samples (low to high salinity),
(ii) quantify soil salinity through traditional laboratory methods
and PXRF, and (iii) determine the relationship between elemental
concentrations and associated soil EC. If PXRF proves to be a re-
liable method for quantification and differentiation of salts in
soils, elemental data from PXRF soil scans could be used to pre-
dict soil salinity (and other soil properties) in situ, requiring less
laboratory analysis and time.
MATERIALS AND METHODS
Soil Sampling
A total of 121 surface soil samples (0–15 cm) were collected
in Jefferson, Plaquemines, and Cameron parishes, Louisiana,
per Schoeneberger et al. (2002), to represent both organic and
mineral soils in 2012 and 2013. Sampling was conducted such
that approximately 57 samples collected were predominantly sand
(>80%), whereas approximately 25 samples had clay contents of
more than 20%. Other soils were largely organic and were pre-
dominantly from areas of slow drainage and mixed with fine soil
textures. Soils were collected using a small handheld shovel,
which was cleaned between samples. Soil series collected in-
cluded the Scatlake (Very-fine, smectitic, nonacid, hyperther-
mic Sodic Hydraquent), Felicity (Mixed, hyperthermic Aquic
Udipsamment), Hackberry (Sandy, mixed, hyperthermic Aeric
Endoaquept), Peveto (Mixed, thermic Typic Udipsamment), Cre-
ole (Fine, smectitic, nonacid, hyperthermic Typic Hydraquent),
Convent (Coarse-silty, mixed, superactive, nonacid, thermic
Fluvaquentic Endoaquept), and Commerce (Fine-silty, mixed,
superactive, nonacid, thermic Fluvaquentic Endoaquept) (Soil
Survey Staff, 1983, 1995, 2000, 2010). Samples were sealed in
plastic bags and returned to Louisiana State University for labora-
tory analysis.
FIG. 1. A, Salt-impacted soil at an old petroleum production site. B, Salt-affected organic marshland soils with halophytic vegetation in
Grand Isle, Louisiana.
Swanhart et al. Soil Science • Volume 179, Number 9, September 2014
418 www.soilsci.com © 2014 Wolters Kluwer Health, Inc. All rights reserved.
Copyright © 2015 Wolters Kluwer Health, Inc. All rights reserved.
- 3. Standard Laboratory Analysis
Samples were air-dried and ground to pass a 2-mm sieve be-
fore additional analysis. Standard soil characterization included
particle size analysis, loss-on-ignition (LOI) organic matter, EC,
and elemental quantification via PXRF. Soils featuring apprecia-
ble organic contents were tested first with H2O2. With a positive
reaction, they were thoroughly oxidized with H2O2 before particle
size analysis. Particle size analysis was conducted via the pipette
method per Gee and Bauder (1986) with an error of ±1% clay.
Sands were determined via wet sieving with a 53-μm sieve. Loss-
on-ignition organic matter was determined per Ben-Dor and Banin
(1989). Samples were combusted for 8 to 16 h at 400°C such that
maximum weight loss (ashing) of all organic matter occurred with
minimal dehydroxylation of clay minerals (Ben-Dor and Banin,
1989). Soil EC was determined for each samplevia saturated paste.
Deionized water was added to approximately 20 to 30 g of soil un-
til it reached complete saturation (US Salinity Laboratory Staff,
1954). Samples were allowed to equilibrate for 24 h. A model
4063CC digital salinity bridge (Traceable Calibration Control
Company, Friendswood, TX) was used to measure soil paste con-
ductance (ECp). The electrical conductance probe was inserted to
the sample and allowed to equilibrate for 60 to 90 sec before a con-
ductivity reading was made and reported in dS m−1
. Brady and
Weil (2008) further discuss how such saturated soil paste readings
(ECp) relate to saturated paste extracts (ECe).
PXRF Spectrometry
A Delta Premium PXRF spectrometer (Olympus Innov-X,
Woburn, MA) was used to facilitate total elemental characteriza-
tion. Samples were subjected to PXRF scanning both in situ and
in the laboratory; the former for initial screening to ensure saline
soil conditions and the latter for the development of regression
models for this research. The PXRF featured a Ta/Au x-ray tube
operated at 10 to 40 kVand a 2-cm aperture for sample scanning.
Before scanning, the instrument was calibrated with a “316” metal
alloy clip tightly secured to the aperture. The PXRF was operated
in a proprietary configuration known as soil mode, with the light
elements analysis program (LEAP) engaged. Optimal Cl quantifi-
cation (the element of interest for a large portion of the current
study) was enhanced by longer scanning time and averages of
multiple scans. The Delta PXRF uses three beam sequential scan-
ning for elemental analysis. For this study, each beam was set to
scan for 30 sec. Thus, one complete scan took 90 sec. The instru-
ment was then repositioned, and the sample was scanned a second
time such that an average between scans was obtained. Quality as-
surance of PXRF scan data was accomplished via scanning two
NIST-certified reference soils (2710a and 2711a). Unfortunately,
S and Cl were two elements that were not reported on in the offi-
cial NIST certificates. Nonetheless, the following elements were
compared and give an indication of PXRF instrument perfor-
mance. The NIST values are followed by PXRF-determined
values in italics, with all values in mg kg−1
: 2710a (As, 1,540,
1,468; Ca, 9,640, 7,850; Cu, 3,420, 3,258; Fe, 43,200, 45,450;
Pb, 5,520, 5,371; Mn, 2,140, 2,182; K, 21,700, 24,750; Ti,
3,110, 3,514; Zn, 4,180, 4,114; Sb, 53, 57; Sr, 255, 262) and
2711a (As, 107, 73; Ca, 24,200, 23,550; Cu, 140, 112; Fe,
28,200, 21,950; Pb, 1,400, 1,302; Mn, 675, 572; K, 25,300,
23,650; Ti, 3,170, 2,904; Zn, 414, 342; Sb, 24, 37; Sr, 242, 222).
The authors of this article in noway endorse any one PXRF instru-
ment over another; selection and use of equipment for this re-
search project were simply reflective of the resources available
to the authors at the time the study was conducted.
Statistical Analysis
Regression models were developed to correlate PXRF ele-
mental concentrations with EC results using statistical analysis
software 9.4 (SAS Institute, 2011) and XLStat version 2014
(Addinsoft, Paris, France). Both simple and multiple linear regres-
sions (SLR and MLR) were used in this study. Because the origi-
nal EC values were non-normally distributed (P > 0.05) and
highly influenced by outliers, Box-Cox transformation (Box and
Cox, 1964) was applied to both original EC and PXRF data using
λ = 0 (Log transformation) to bring the data close to a Gaussian
distribution after stabilizing the variance. Both SLR and MLR
models were developed based on Log-transformed (λ = 0) re-
sponse and predictor values. Variables included in regression anal-
ysis included results from particle size analysis, organic matter,
elemental concentration via PXRF, and EC. All statistical analyses
were conducted at a significance level of α = 0.05. Different sta-
tistical analyses were applied to quantify significant differences
and the correlation between laboratory-measured values and pre-
dicted values from the regression models for Cl and salinity.
The model generalization capacity was judged in terms of coeffi-
cient of determination (r2
) and RMSE values. Among other error
statistics, the mean absolute percentage error (MAPE) (Mayer and
Butler, 1993) was calculated per Eq.(1):
MAPE¼
1
n
∑
Actual−Forecastj j
Actualj j
Ã100 ð1Þ
where n denotes the number of observations, Actual represents ob-
served value, and Forecast indicates predicted value. Furthermore,
to evaluate the best performing algorithm, the Akaike information
criterion (AIC) was used to determine the method that most satis-
factorily compromised between model accuracy and model par-
simony (Akaike, 1973). It is a model selection criterion that
penalizes models for which adding new explanatory variables
does not supply sufficient information to the model, the informa-
tion being measured through the MSE. The aim is to minimize the
AIC criterion. The AIC was calculated by Eq.(2) (Viscarra Rossel
and Beherens, 2010):
AIC ¼ n ln RMSE þ 2p ð2Þ
where n is the number samples and p is the number of features
used in the prediction. The model with the smallest AIC is gener-
ally considered best.
We also plotted predicted EC against SLR standardized re-
siduals (Cook and Wiesberg, 1982), also known as internally
studentized residuals, which are the errors divided by their es-
timated standard errors. They are used to adjust for the fact that
different residuals have different variances. Moreover, MLR stan-
dardized coefficients were used to compare the relative weights of
the variables (Schroeder et al., 1986). Before fitting the MLR
equation, both response and predictors are standardized by
subtracting the mean and dividing by the S.D. The standardized
regression coefficients, subsequently, indicate the change in re-
sponse for a change of 1 S.D. in a predictor. The higher the abso-
lute value of a coefficient, the more important the weight of the
corresponding variable.
RESULTS
Simple Linear Regression
Elemental concentrations of Cl, S, K, and Ca were deter-
mined via PXRF and used to predict EC values. Salt-impacted
soils were split into five classes based on their respective EC
Soil Science • Volume 179, Number 9, September 2014 Soil Salinity Measurement via PXRF Spectrometry
© 2014 Wolters Kluwer Health, Inc. All rights reserved. www.soilsci.com 419
Copyright © 2015 Wolters Kluwer Health, Inc. All rights reserved.
- 4. values: Class 0, nonsaline (0–2 dS m−1
); Class 1, very slightly sa-
line (2–4 dS m−1
); Class 2, slightly saline (4–8 dS m−1
); Class 3,
moderately saline (8–16 dS m−1
); and Class 4, strongly saline
(16 dS m−1
). Table 1 describes the average EC and Cl concen-
tration from experimental analysis. As expected, average Cl con-
centration increased steadily from nonsaline to strongly saline
samples.
An SLR model was constructed considering Ln (EC) and Ln
(Cl) as response and predictor variables, respectively. Samples be-
low the Cl detection limit for PXRF (60–100 mg kg−1
) were ex-
cluded from regression analysis because their associated ECs
would not be considered saline soil (Soil Survey Staff, 1993;
Hoppin et al., 1995; Papachristodoulou et al., 2006). This resulted
in a final data set (n = 90) that was randomly distributed into cal-
ibration (n = 68, ∼75%) and validation (n = 22, ∼25%) data sets
and subsequently used in both SLR and MLR models. Notably,
among these 90 soil samples, soil salinity (EC) varied from 0
to 79.70 dS m−1
. Substantial variability was also observed for
soil S (∼114–13,328 mg kg−1
), K (∼1,240–13,410 mg kg−1
),
Ca (∼113–100,876 mg kg−1
), sand (1.90%–98.60%), clay content
(2.00%–61.50%), and organic matter (0.20%–24.50%) (Table 2).
Figure 2A shows the SLR model representing PXRF (Cl)-pre-
dicted EC versus measured EC. The calibration model exhibited
a reasonable coefficient of determination (r2
= 0.83) (Table 3).
Moreover, Fig. 2B represents the standardized residuals. Appar-
ently, the prediction deteriorates significantly with decreasing
EC, which could be caused by the scarcity of soil samples with
low EC values. Independent validation with the test set (n = 22)
produced an r2
value of 0.78, further confirming the potentiality
of PXRF (Cl) in predicting soil EC (Table 3). The MAPE, which
is a measure of how high or low the differences are between the
predictions and actual data, exhibited that, on average, the predic-
tions from the SLR model were approximately 58% higher or
lower than actual values. Notably, log transformation substantially
improved the SLR model predictability in terms of coefficient of
determination (r2
= 0.83) when compared with untransformed
variables (r2
= 0.66). Table 4 exhibits both SLR and MLR model
equations.
Multiple Linear Regression
In consideration of the possibility of more diverse types of
salt contributing to soil salinity, MLR was used to compare EC
readings with concentrations of Cl, K, S, and Ca, with sand, clay,
and organic matter as auxiliary input variables. As such, an MLR
model was created, including K, S, Ca, and Cl from PXRFas con-
stituent elements of common salt compounds.
Considering the calibration data set (n = 68), the MLR-
predicted EC versus measured ECproduced an r2
of 0.90 (Fig. 2C),
whereas the validation data set (n = 22) produced an r2
of 0.70
(Table 3). The MLR calibration model produced a lower MAPE
value (21.77) than SLR, indicating that MLR calibration was
substantially better than SLR. Moreover, MLR produced lower
RMSE (0.475 Ln dS m−1
), MAPE (21.77%), and AIC (-89.37)
values than the SLR model (MAPE, 57.73%; AIC, -69.83).
DISCUSSION
One limitation of using single-element analysis (e.g., Cl) via
PXRF is the potential for matrix interference from other elements
with higher concentrations. However, such limitations can be
managed with extended scanning time, sample homogenization,
correction via NIST standards, and consideration of multiple
scans (Anderson and Olin, 1990). We minimized the aforemen-
tioned limitation by scanning each sample in duplicate (physically
repositioning the instrument between each scan such that different
areas of soil were scanned to obtain an average), homogenizing
the soil before scanning through drying/grinding to pass a 2-mm
sieve and through substantial scanning time (90 sec) for each
individual scan.
Interestingly, the MLR-standardized coefficients exhibited
major influences of organic matter, clay, Ca, and K apart from
Cl content (Fig. 2D). Although systems that offer electrostatic at-
traction to free cations in soil solution may effectively bind them
to the exchange complex of clays or integrate them into the molec-
ular structure of complex organics, anions such as Cl would still
be freely available as like charges repel each other. However, be-
cause of binding, clays and organics may contribute only limited
cations to dissociated active soil salinity, which would be reflected
in a lower overall soil EC, whereas PXRF elemental readings are
not affected by binding versus dissociation. This is likely the ratio-
nale behind the influence of soil organic matter and clay on soil
salinity results.
Although a small difference was observed in the results, par-
ticularly in terms of validation r2
between both SLR (0.77) and
TABLE 2. Summary Statistics of Samples (n = 90) Used in Predictive Models
Statistics
EC S K Ca Sand Clay LOI
dS m−1
mg kg−1
%
Minimum 0.11 114.30 1,240.50 113.00 1.90 2.00 0.20
Maximum 79.70 13,328.30 13,410.60 100,876.30 98.60 61.50 24.50
Mean 18.63 1,827.38 8,011.44 16,104.86 60.54 14.13 3.26
Range 79.59 13,214.00 12,170.10 100,763.30 96.70 59.50 24.30
First Quartile 5.26 583.45 7,121.525 6,447.15 33.25 2.60 1.20
Median 11.20 1,203.60 8,055.85 13,338.20 66.60 9.55 2.15
Third Quartile 28.20 1,914.25 9,170.10 17,084.40 85.30 19.30 3.40
Variance 341.77 6,269,354.49 5,058,735.77 288,867,636.47 833.34 222.30 20.35
TABLE 1. Average Cl Concentrations and EC (dS m−1
) for All
Samples (n = 122) from Louisiana
Salinity
Class
EC Range,
dS m−1
Average EC,
dS m−1
Average Cl,
mg kg−1
0 0–2 0.39 36
1 2–4 3.05 804
2 4–8 6.24 1,265
3 8–16 11.08 2,362
4 16 37.52 6,676
Total 0 ≥ 16 13.92 2,564
Swanhart et al. Soil Science • Volume 179, Number 9, September 2014
420 www.soilsci.com © 2014 Wolters Kluwer Health, Inc. All rights reserved.
Copyright © 2015 Wolters Kluwer Health, Inc. All rights reserved.
- 5. MLR (0.70), the latter is recommended with deference to model
accuracy (Table 3). This is reflected in both the MAPE and AIC,
which suggest that MLR is the best EC predictive model. As evi-
dent in Fig. 2D, inclusion of influential auxiliary predictors like
organic matter and clay (when available) plays a crucial role in
substantially lowering the MAPE.
However, in-depth elucidation of the differences between
SLR and MLR dynamics would require the study of a larger
number of samples with a better control of the factors that can in-
fluence differences. Yet, it is possible to conclude that, at least in
the analysis soil EC, MLR provided satisfactory generalization
capability. Notably, for research of specific salts, the use of mul-
tivariate models may be preferable. Also, other elements may pro-
vide increased predictive power. For example, a different
configuration of the Delta Premium PXRF features an Rh X-ray
tube that is capable of measuring Mg. Clearly, this would be an
important predictor variable for salts such as MgCl2, Mg(NO3)2,
and MgSO4.
Summarily, PXRF shows considerable promise in providing
rapid EC prediction in soils with reasonable accuracy. Acquisition
of PXRF data is rapid, easy, and cost-effective, especially for
unusual circumstances where nondestructive sampling is required.
TABLE 3. Calibration (n = 68) and Validation Statistics (n = 22) of SLR Model Using PXRF ln Cl, and MLR Model Using PXRF ln Cl, S, K,
Ca, Sand, Clay, and Organic Matter for Soil Samples from Louisiana
Model Calibration r2
Validation r2
RMSE, Ln dS m−1
MAPE, % AIC
SLR 0.83 0.77 0.590 57.73 -69.83
MLR 0.90 0.70 0.475 21.77 -89.37
AIC, Akaike information criterion; LOI, loss-on-ignition organic matter; MAPE, mean absolute percentage error.
FIG. 2. Plots showing (A) SLR predicted Ln EC versus measured Ln EC (outer lines represent 95% confidence interval), (B) SLR standardized
residuals, (C) MLR predicted Ln EC versus measured Ln EC (outer lines represent 95% confidence interval), and (D) MLR standardized
regression coefficients (gray bars). The magnitude of the regression coefficient at each variable is proportional to the height of the bar.
The higher the absolute value of a coefficient, the more important the weight of the corresponding variable. LOI represents loss-on-ignition
organic matter. The EC values were measured in the laboratory using standard procedures, whereas Cl, Ca, K, and S values were obtained
via PXRF spectrometry for salt-impacted soils in Louisiana.
Soil Science • Volume 179, Number 9, September 2014 Soil Salinity Measurement via PXRF Spectrometry
© 2014 Wolters Kluwer Health, Inc. All rights reserved. www.soilsci.com 421
Copyright © 2015 Wolters Kluwer Health, Inc. All rights reserved.
- 6. Additional research should be continued to include larger geo-
graphical ranges along with other soil properties, but the future
of PXRF-based soil EC characterization seems promising. Appli-
cations of PXRF for prediction of soil EC are particularly advan-
tageous for salinity determination in situ and in instances where
proximally sensed data are already being collected for other
parameters of interest. Our study indicates that soil salinity can
be reasonably predicted using simple elemental data and predic-
tive models—results that can also be extended to soil spatial and
temporal variability analysis. Other approaches seek to combine
PXRF data with other remotely or proximally sensed data to im-
prove model predictability. Aldabaa et al. (2015) demonstrated
that utilization of PXRF data in tandem with VisNIR and remotely
sensed spectral data substantially improved the prediction of soil
salinity in playas of West Texas.
CONCLUSIONS
Previous studies successfully used PXRF to measure physi-
cal, chemical, and morphological properties in soils. Applied to
soil salinity assessment, PXRF is capable of providing data on
up to 20 elements more quickly (seconds to minutes) than tradi-
tional soil analysis. This research sought to develop a method of
using proximally sensed PXRFelemental data to directly predict soil
salinity. In doing so, the PXRF yielded information on the elemental
abundance of the various ions commonly contributing to soil salin-
ity (e.g., Ca, K, S, Cl). Furthermore, this technique has the potential
to be conducted on-site with minimal to no sample pre-preparation
and no destruction of the sample in conducting the analysis.
Salt-impacted soil samples were collected from Louisiana
coastal parishes, representing a wide variety in organic matter, par-
ticle size distribution, and salinity. Samples were subjected to tra-
ditional methods of measuring physical and chemical properties,
with subsequent elemental quantification via PXRF. Simple and
multiple linear regression models were created to relate EC to
PXRF data as a method of measuring salinity in situ. Although
both models resulted in similar acceptable calibration r2
(0.83,
and 0.90, respectively), multiple linear regression is recom-
mended given its superior predictive accuracy. Summarily, the
speed, portability, and accuracy of PXRF offer formidable advan-
tages over traditional analysis of soil salinity.
ACKNOWLEDGMENTS
The authors gratefully acknowledge the contributions of
Kelly Polander and the support from the BL Allen Endowment in
Pedology at Texas Tech University in conducting this research.
REFERENCES
Akaike H. 1973. Information theory and an extension of maximum likelihood
principle. In: Petrov B. N., and F. Csáki (eds.). Second International Sympo-
sium on Information Theory. Akadémia Kiadó, Budapest, Hungary,
pp. 267–281.
Aldabaa A. A. A., D. C. Weindorf, S. Chakraborty, A. Sharma, and B. Li. 2015.
Combination of proximal and remote sensing methods for rapid soil salinity
quantification. Geoderma 239-240:34–46.
Anderson M., and A. Olin. 1990. Determination of bromine, chlorine, sulfur,
and phosphorus in peat by X-ray fluorescence spectrometry combined with
single element and multi-element standard addition. Talanta. 37:185–190.
Argyraki A., M. H. Ramsey, and P. J. Potts. 1997. Evaluation of portable X-ray
fluorescence instrumentation for in situ measurements of lead on contami-
nated land. The Analyst. 122:743–749.
Ben-Dor E., and A. Banin. 1989. Determination of organic matter content in
arid-zone soils using a simply “loss-on-ignition” method. Comm. Soil
Sci. Plant Anal. 20:1675–1695.
Benito G., P. Perez del Campo, M. Gutierrez-Elorza, and C. Sancho. 1995. Nat-
ural and human-induced sinkholes in gypsum terrain and associated envi-
ronmental problems in NE Spain. Environ. Ecol. 25:156–164.
Biggs T. W., and B. Jiang. 2009. Soil salinity and exchangeable cations in waste-
water irrigated area, India. J. Environ. Qual. 38:887–896.
Box G. E. P., and D. R. Cox. 1964. An analysis of transformations. J. Royal Sta-
tistical Soc. B Methodol. 26:211–252.
Brady N. C., and R. R. Weil. 2008. The nature and properties of soils. (14th ed.)
Upper Saddle River, NJ, Prentice Hall.
Bray R. H. 1929. A field test for available phosphorous in soilsUniversity of Illi-
nois (Urbana-Champaign) Agricultural Experiment Station Bulletin No. 337.
Caballero R., A. Bustos, and R. Roman. 2001. Soil salinity under traditional
and improved irrigation schedules in Central Spain. Soil Sci. Soc. Am. J.
65:1210–1218.
Cook D., and S. Wiesberg. 1982. Residuals and influence in regression. New
York, NY, Chapman and Hall.
Corwin D. L., and S. M. Lesch. 2001. Application of soil electrical conductivity
to precision agriculture. Agron. J. 95:455–471.
Gee G. W., and J. W. Bauder. 1986. Methods of Soil Analysis-Part 1: Physical
and Mineralogical Methods. Soil Science Society of America. WI, Madison.
Hao X., and C. Chang. 2003. Does long-term heavy cattle manure application
increase salinity of clay loam sol in semi-arid southern Alberta? Agric.
Ecosyst. Environ. 94:89–103.
Hogg T. J., and J. L. Henry. 1984. Comparison of 1:1 and 1:2 suspensions and
extracts with the saturation extract in estimating salinity in Saskatchewan
soils. Can. J. Soil Sci. 64:699–704.
Hoppin J. A., A. C. A. Aro, P. L. Williams, H. Hu, and P. B. Ryan. 1995. Vali-
dation of K-XRF bone lead measurement in young adults. Environ. Health
Prospect. 103:78–83.
Jones A. A. 1982. Methods of Soil Analysis-Part 2: Chemical and Microbiolog-
ical Properties Soil Science Society of America, Madison, WI.
Mayer D. G., and D. G. Butler. 1993. Statistical validation. Ecol. Model. 68:21–32.
Merrill S. D., E. J. Doering, and J. F. Power. 1980. Changes in sodicity and salinity
in soils reconstructed on strip-mined land. North Dakota Farm Res. 37:13–16.
Papachristodoulou C., A. Oikonomou, K. Ioannides, and K. Gravani. 2006. A study
of ancient pottery by means of X-ray fluorescence spectroscopy, multivariate
statistics and mineralogical analysis. Anal. Chim. Acta. 573-574:347–353.
TABLE 4. Calibration Equations for SLR Model Using PXRF ln Cl, and MLR Model Using PXRF ln Cl, S, K, Ca, Sand, Clay, and Organic
Matter for Soil Samples from Louisiana
Predictors
Regression
Model Regression Equation r2
Cl Simple (SLR) Ln EC= -3.28 + 0.75*ln Cl 0.83
Cl, S, K, Ca,
sand, clay, LOI
Multiple (MLR) Ln EC = -4.34 + 0.79*ln Cl + 5.35E - 03*ln S +
0.14*ln K + 1.75E - 02*ln Ca - 9.87E - 03*
sand - 2.042E - 04*clay - 5.33E - 02*LOI
0.90
Swanhart et al. Soil Science • Volume 179, Number 9, September 2014
422 www.soilsci.com © 2014 Wolters Kluwer Health, Inc. All rights reserved.
Copyright © 2015 Wolters Kluwer Health, Inc. All rights reserved.
- 7. Piorek S. 1998. Determination of Metals in Soils by Field-Portable XRF Spec-
trometry. Current Protocols in Field Analytical Chemistry. John Wiley
Sons, New York, NY, pp. 3B.1.1–3B.1.18.
Rhoades J. D., N. A. Manteghi, P. J. Shouse, and W. J. Alves. 1987. Soil electri-
cal conductivity and soil salinity: new formulation and calibrations. Soil
Sci. Soc. Am. J.. 53(2):433–439.
Rhoades J. D., B. L. Waggoner, P. J. Shouse, and W. J. Alves. 1989. Determining
soil salinity from soil and soil-paste electrical conductivities: Sensitivity
analysis of models. Soil Sci. Soc. Am. J. 53:1368–1374.
Saadi I., Y. Laor, M. Raviv, and S. Medina. 2007. Land spreading of olive mill
wastewater: Effects on soil microbiology activity and potential phytotoxic-
ity. Chemosphere. 66:75–83.
Institute SAS. 2011. The SAS System for Windows, Release 9.3, SAS Institute,
Cary, NC.
Schoeneberger P. J., D. A. Wysocki, E. C. Benham, and W. D. Broderson (eds.).
2002. Field Book for Describing and Sampling Soils, Version 2.0. USDA-
NRCS. National Soil Survey Center, Lincoln, NE.
Schroeder L. D., D. L. Sjoquist, and P. E. Stephan. 1986. Understanding regres-
sion analysis. New York, NY, Sage Publications.
Sharma A., D. C. Weindorf, T. Man, A. Aldabaa, and S. Chakraborty. 2014a.
Characterizing soils via portable X-ray fluorescence spectrometer: 3. Soil
reaction (pH). Geoderma 232-234:141–147.
Sharma A., D. C. Weindorf, D. D. Wang, and S. Chakraborty. 2014b. Character-
izing soils via portable X-ray fluorescence spectrometer: 4. Cation ex-
change capacity (CEC). Geoderma 239–240:130–134.
Soil Survey Staff. 1993. Soil Survey Manual. United States Department of
Agriculture Handbook No. 18.USDA-NRCS. US Government Printing Of-
fice, Washington, DC.
Soil Survey Staff. 1995. Soil Survey of Cameron Parish, Louisiana. USDA-
NRCS, US Government Printing Office, Washington, DC.
Staff S. S. 1983. Soil Survey of Jefferson Parish, Louisiana. In: USDA-NRCS.
US Government Printing Office, Washington, DC.
Staff S. S. 2000. Soil Survey of Plaquemines Parish, Louisiana. In: USDA-
NRCS. US Government Printing Office, Washington, DC.
Staff S. S. 2010. Keys to Soil Taxonomy, 11th ed. In: USDA-NRCS. US Gov-
ernment Printing Office, Washington, DC.
Swanhart S. 2013. Measuring soluble salts in soils via portable X-ray fluorescence
spectrometry. MS Thesis, Louisiana State University, Baton Rouge, LA.
US Salinity Laboratory Staff. 1954. Diagnosis and Improvement of Saline and
Alkali Soils. United States Department of Agriculture Handbook No. 60.
US Government Printing Office, Washington, DC.
US Environmental Protection Agency. 2007. Method 6200: Field portable
X-ray fluorescence spectrometry for the determination of elemental concen-
trations in soil and sediment. Available at www.epa.gov (verified January
11, 2012), USEPA, Washington, DC.
Viscarra Rossel R. A., and T. Beherens. 2010. Using data mining to model and
interpret soil diffuse reflectance spectra. Geoderma. 158:46–54.
Wang H., Y. P. Hsieh, M. A. Harwell, and W. Huang. 2007. Modeling soil salin-
ity distribution along topographic gradients in tidal salt marshes in Atlantic
and Gulf coastal regions. Ecol. Model. 201:429–439.
Weindorf, D. C., Y. Zhu, R. Ferrell, N. Rolong, T. Barnett, B. Allen, J. Herrero,
and W. Hudnall. 2009. Evaluation of portable x-ray fluorescence for gyp-
sum quantification in soils. Soil Sci. 174:556–562.
Weindorf, D. C., J. Herrero, N. Bakr, and S. Swanhart. 2013. Direct soil gypsum
quantification via portable x-ray fluorescence spectrometry. Soil Sci. Soc.
Am. J.
Weindorf D. C., Y. Zhu, B. Haggard, J. Lofton, S. Chakraborty, N. Bakr, W.
Zhang, W. Weindorf, and M. Legoria. 2012. Enhanced pedon horizonation
using portable X-ray fluorescence spectrometry. Soil Sci. Soc. Am. J.
76:522–531.
Weindorf D. C, N. Bakr, and Y. Zhu. 2014. Advances in portable X-ray fluores-
cence (PXRF) for environmental, pedological, and agronomic applications.
Adv. Agron. 128:1–45.
Zeng L., and M. C. Shannon. 2000. Salinity effects on seedling growth and
yield components of rice. Crop Sci. 40:996–1003.
Zhu, Y., D. C. Weindorf, and W. Zhang. 2011. Characterizing soils using a
portable X-ray fluorescence spectrometer: 1. Soil texture. Geoderma.
167–168:167–177.
Soil Science • Volume 179, Number 9, September 2014 Soil Salinity Measurement via PXRF Spectrometry
© 2014 Wolters Kluwer Health, Inc. All rights reserved. www.soilsci.com 423
Copyright © 2015 Wolters Kluwer Health, Inc. All rights reserved.