Download as PDF, PPTX

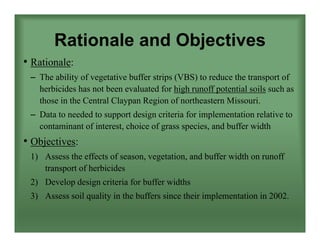
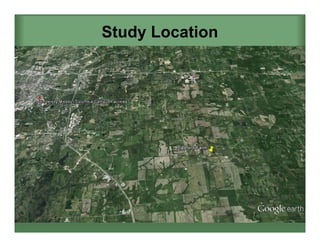
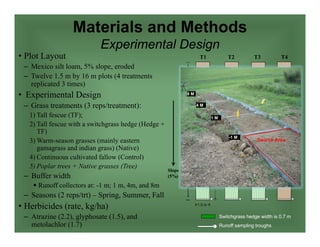
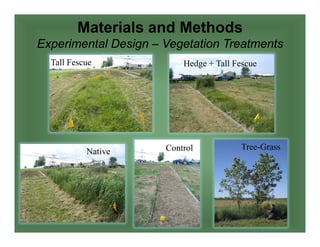


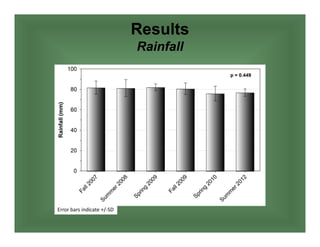
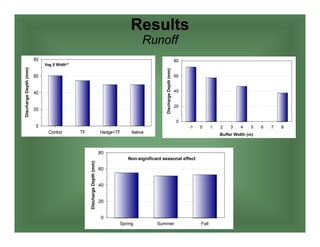
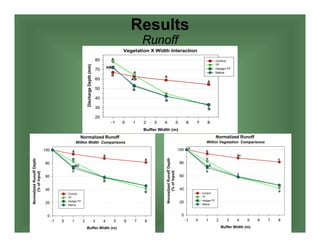
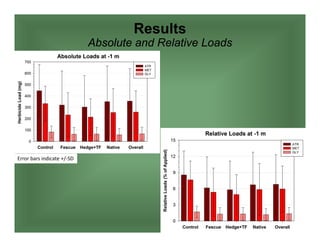
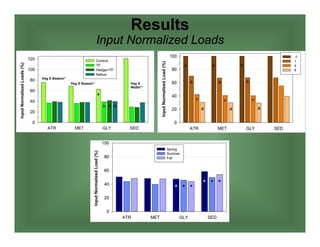
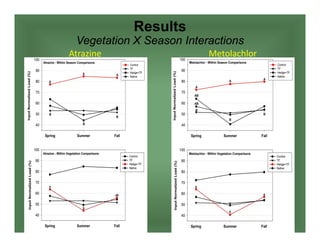
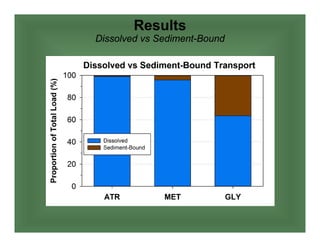
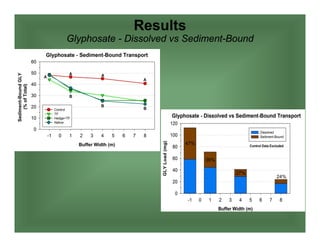
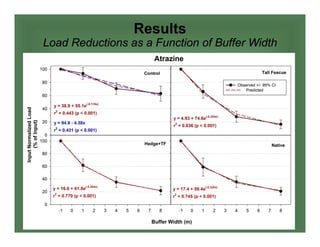
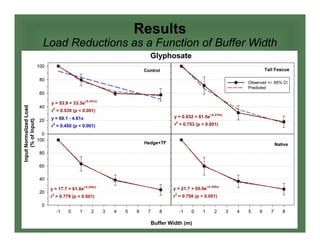
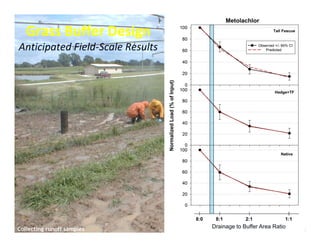
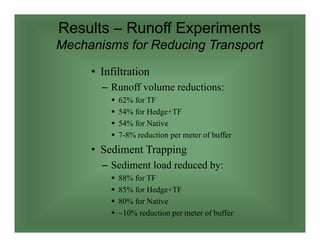
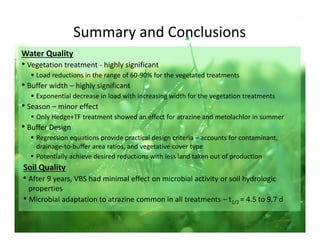

The study evaluates the effectiveness of vegetative buffer strips (VBS) in reducing herbicide transport in runoff across different seasons, vegetation types, and buffer widths in northeastern Missouri. Results indicate that VBS can significantly reduce herbicide loads (60-90%) and highlight the importance of buffer width in maximizing reductions, with minimal effects on soil quality over time. Design criteria were developed to balance land use and water quality objectives, taking into account contaminant types and vegetative cover.