Gilead Sciences Inc (GILD) Stock Analysis Report
•
0 likes•51 views

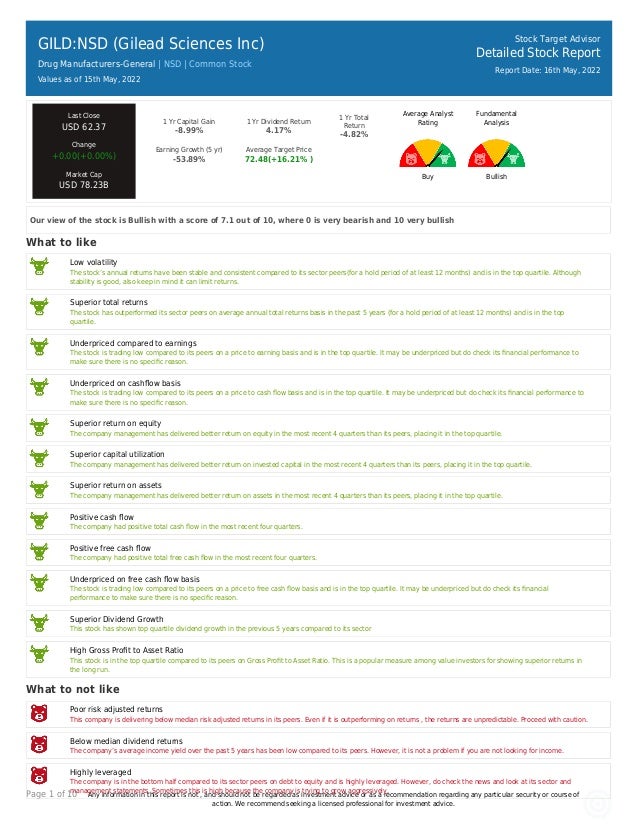
Gilead Sciences, Inc., a biopharmaceutical company, discovers, develops, and commercializes medicines in the areas of unmet medical need in the United States, Europe, and internationally. Based on the Gilead Sciences Inc stock forecasts from 14 analysts, the average analyst target price for Gilead Sciences Inc is USD 72.48 over the next 12 months. Gilead Sciences Inc’s average analyst rating is Buy . Stock Target Advisor’s own stock analysis of Gilead Sciences Inc is Bullish , which is based on 12 positive signals and 5 negative signals. At the last closing, Gilead Sciences Inc’s stock price was USD 62.37. Gilead Sciences Inc’s stock price has changed by +1.95% over the past week, +0.89% over the past month and -8.99% over the last year.

Recommended
Recommended
More Related Content
Similar to Gilead Sciences Inc (GILD) Stock Analysis Report
Similar to Gilead Sciences Inc (GILD) Stock Analysis Report (20)
More from Stock Target Advisor
More from Stock Target Advisor (20)
Recently uploaded
Recently uploaded (20)
Gilead Sciences Inc (GILD) Stock Analysis Report
- 1. Page 1 of 10 Any information in this report is not , and should not be regarded as investment advice or as a recommendation regarding any particular security or course of action. We recommend seeking a licensed professional for investment advice. GILD:NSD (Gilead Sciences Inc) Drug Manufacturers-General | NSD | Common Stock Values as of 15th May, 2022 Stock Target Advisor Detailed Stock Report Report Date: 16th May, 2022 Last Close USD 62.37 Change +0.00(+0.00%) Market Cap USD 78.23B 1 Yr Capital Gain -8.99% 1 Yr Dividend Return 4.17% 1 Yr Total Return -4.82% Earning Growth (5 yr) -53.89% Average Target Price 72.48(+16.21% ) Average Analyst Rating Buy Fundamental Analysis Bullish Our view of the stock is Bullish with a score of 7.1 out of 10, where 0 is very bearish and 10 very bullish What to like Low volatility The stock’s annual returns have been stable and consistent compared to its sector peers(for a hold period of at least 12 months) and is in the top quartile. Although stability is good, also keep in mind it can limit returns. Superior total returns The stock has outperformed its sector peers on average annual total returns basis in the past 5 years (for a hold period of at least 12 months) and is in the top quartile. Underpriced compared to earnings The stock is trading low compared to its peers on a price to earning basis and is in the top quartile. It may be underpriced but do check its financial performance to make sure there is no specific reason. Underpriced on cashflow basis The stock is trading low compared to its peers on a price to cash flow basis and is in the top quartile. It may be underpriced but do check its financial performance to make sure there is no specific reason. Superior return on equity The company management has delivered better return on equity in the most recent 4 quarters than its peers, placing it in the top quartile. Superior capital utilization The company management has delivered better return on invested capital in the most recent 4 quarters than its peers, placing it in the top quartile. Superior return on assets The company management has delivered better return on assets in the most recent 4 quarters than its peers, placing it in the top quartile. Positive cash flow The company had positive total cash flow in the most recent four quarters. Positive free cash flow The company had positive total free cash flow in the most recent four quarters. Underpriced on free cash flow basis The stock is trading low compared to its peers on a price to free cash flow basis and is in the top quartile. It may be underpriced but do check its financial performance to make sure there is no specific reason. Superior Dividend Growth This stock has shown top quartile dividend growth in the previous 5 years compared to its sector High Gross Profit to Asset Ratio This stock is in the top quartile compared to its peers on Gross Profit to Asset Ratio. This is a popular measure among value investors for showing superior returns in the long run. What to not like Poor risk adjusted returns This company is delivering below median risk adjusted returns in its peers. Even if it is outperforming on returns , the returns are unpredictable. Proceed with caution. Below median dividend returns The company’s average income yield over the past 5 years has been low compared to its peers. However, it is not a problem if you are not looking for income. Highly leveraged The company is in the bottom half compared to its sector peers on debt to equity and is highly leveraged. However, do check the news and look at its sector and management statements. Sometimes this is high because the company is trying to grow aggressively.
- 2. Page 2 of 10 Any information in this report is not , and should not be regarded as investment advice or as a recommendation regarding any particular security or course of action. We recommend seeking a licensed professional for investment advice. Overpriced on free cash flow basis The stock is trading high compared to its peers on a price to free cash flow basis. It is priced above the median for its sectors. Proceed with caution if you are considering to buy. Low Revenue Growth This stock has shown below median revenue growth in the previous 5 years compared to its sector
- 3. Page 3 of 10 Any information in this report is not , and should not be regarded as investment advice or as a recommendation regarding any particular security or course of action. We recommend seeking a licensed professional for investment advice. GILD:NSD (Gilead Sciences Inc) Drug Manufacturers-General | | Common Stock Stock Target Advisor Detailed Stock Report Report Date: 16th May, 2022 Adjusted Closing Share Volume Relative Returns Relative Performance (Total Returns) Security Capital Gain Dividend Return Total Return GILD Gilead Sciences Inc -9% +4.2% -4.8% QQQ Invesco QQQ Trust Series 1 -7.5% +0.4% -7.1% Company Overview Gilead Sciences, Inc., a biopharmaceutical company, discovers, develops, and commercializes medicines in the areas of unmet medical need in the United States, Europe, and internationally. The company provides Biktarvy, Genvoya, Descovy, Odefsey, Truvada, Complera/ Eviplera, Stribild, and Atripla products for the treatment of HIV/AIDS; Veklury, an injection for intravenous use, for the treatment of coronavirus disease 2019; and Epclusa, Harvoni, Vosevi, Vemlidy, and Viread for the treatment of liver diseases. It also offers Yescarta, Tecartus, Trodelvy, and Zydelig products for the treatment of hematology, oncology, and cell therapy patients. In addition, the company provides Letairis, an oral formulation for the treatment of pulmonary arterial hypertension; Ranexa, an oral formulation for the treatment of chronic angina; and AmBisome, a liposomal formulation for the treatment of serious invasive fungal infections. Gilead Sciences, Inc. has collaboration agreements with Arcus Biosciences, Inc.; Pionyr Immunotherapeutics Inc.; Tizona Therapeutics, Inc.; Tango Therapeutics, Inc.; Jounce Therapeutics, Inc.; Galapagos NV; Janssen Sciences Ireland Unlimited Company; Japan Tobacco, Inc.; Gadeta B.V.; Bristol-Myers Squibb Company; and Merck & Co, Inc. The company was incorporated in 1987 and is headquartered in Foster City, California.
- 4. Page 4 of 10 Any information in this report is not , and should not be regarded as investment advice or as a recommendation regarding any particular security or course of action. We recommend seeking a licensed professional for investment advice. Company Website https://www.gilead.com Address 333 Lakeside Drive, Foster City, CA, United States, 94404 Fiscal Year End December Employees 14400 Technical Indicators Value Value Beta 0.42 52 Week High 73.19 Short Ratio 2.06 52 Week Low 56.60 Shorted Shares 16,695,430 200 Day Moving Average 66.71 Shorted Shares Previous Month 15,373,547 50 Day Moving Average 60.63 Shares Held By Insiders 6.50% Short Percentage 2.00% Shares Held by Institutions 83.76 Dividend Yield 4.73%
- 5. Page 5 of 10 Any information in this report is not , and should not be regarded as investment advice or as a recommendation regarding any particular security or course of action. We recommend seeking a licensed professional for investment advice. GILD:NSD (Gilead Sciences Inc) Drug Manufacturers-General | | Common Stock Stock Target Advisor Detailed Stock Report Report Date: 16th May, 2022 Market Performance Market Performance vs. Industry / Classification (Drug Manufacturers-General) Market Performance vs. Exchange (Nasdaq Global Select) Value Sector Median Percentile Rank Grade Market Median Percentile Rank Grade YTD Capital Gain -14.10% -14.1% 56% -20.1% 58% Dividend Return 1.01% 1.0% 50% 0.8% 58% Total Return -13.10% -13.1% 56% -19.7% 59% Trailing 12 Months Capital Gain -8.99% -3.2% 43% -19.5% 64% Dividend Return 4.17% 2.6% 100% 2.3% 76% Total Return -4.82% -1.9% 43% -18.3% 67% Trailing 5 Years Capital Gain -5.10% 3.6% 43% 3.7% 43% Dividend Return 19.25% 18.0% 80% 11.0% 82% Total Return 14.15% 18.0% 43% 14.5% 50% Average Annual (5 Year Horizon) Capital Gain -2.16% 3.9% 29% 3.1% 27% Dividend Return 3.69% 3.0% 100% 1.8% 80% Total Return 1.53% 6.8% 43% 5.1% 42% Risk Return Profile Volatility (Standard Deviation) 11.47% 13.4% 86% 32.3% 82% Risk Adjusted Return 13.36% N/A 43% 21.8% 43% Market Capitalization 78.23B 29.16B 63% 11.99B 99%
- 6. Page 6 of 10 Any information in this report is not , and should not be regarded as investment advice or as a recommendation regarding any particular security or course of action. We recommend seeking a licensed professional for investment advice. Key Financial Ratios Ratios vs. Industry / Classification (Computer Hardware) Ratios vs. Exchange (Nasdaq Global Select) Value Sector Median Percentile Rank Grade Market Median Percentile Rank Grade Market Value peratio 17.4 24.1 100% 15.9 46% pbratio 3.9 3.9 57% 1.6 20% pcfratio 6.9 14.0 88% -0.1 35% pfcfratio 11.1 14.5 100% 9.9 47% Management Effectiveness retequity 23.10% 12.3% 86% 0.7% 87% retinvcap 16.11% 3.9% 89% -0.4% 85% retass 10.62% 4.8% 100% 0.4% 93% debtequityratio 119.51% 71.6% 29% 32.3% 18% Technical Ratios yield 4.73% 3.2% 80% 4.4% 53% sratio 2.06 2.06 50% 3.07 63% spercent 1.33% 1.5% 63% 2.9% 68% beta 0.42 0.44 71% 1.08 86%
- 7. Page 7 of 10 Any information in this report is not , and should not be regarded as investment advice or as a recommendation regarding any particular security or course of action. We recommend seeking a licensed professional for investment advice. GILD:NSD (Gilead Sciences Inc) Drug Manufacturers-General | | Common Stock Stock Target Advisor Detailed Stock Report Report Date: 16th May, 2022 Recent Analyst Ratings Price Action Rating Action Analyst Rating Price date Target Raised by Piper Sandler USD 72 » USD 73 2022-04-29 Target Raised by Piper Sandler USD 71 » USD 72 2022-04-12 Assigns STA Research Buy USD 68 2022-04-12 Target Lowered by Morgan Stanley Equal Weight USD 69 » USD 63 2022-04-12 Target Lowered by Piper Sandler USD 77 » USD 71 2022-04-04 Target Lowered by Wells Fargo Equal Weight USD 70 » USD 63 2022-03-22 Target Lowered by Barclays USD 63 » USD 56 2022-03-10 Initiated by BMO Financial Hold USD 65 2022-03-08 Maintains RBC Royalbank Outperform USD 85 » USD 77 2022-03-08 Downgraded by BMO Financial Outperform » Market Perform USD 75 » USD 65 2022-02-28 Maintains Mizuho Securities Buy USD 81 » USD 75 2022-02-08 Target Down Maxim Group Buy USD 88 » USD 84 2022-02-03 Target Lowered by Truist Securities Hold USD 77 » USD 75 2022-02-02 Target Lowered by BMO Financial Outperform USD 85 » USD 75 2022-02-02 Target Lowered by Bank of America Securities Neutral USD 73 » USD 71 2022-02-02 Target Lowered by RBC Royalbank Outperform USD 87 » USD 85 2022-02-02 Maintains Morgan Stanley Equal-Weight USD 72 » USD 69 2022-02-02 Target Lowered by Wells Fargo Equal Weight USD 72 » USD 70 2022-02-02 Upgrades Argus Buy USD 75 2022-01-28 Maintains Morgan Stanley Equal-Weight USD 74 » USD 72 2022-01-18 Initiated by BMO Financial Buy USD 85 2022-01-14 Downgrades Morgan Stanley Equal-Weight USD 84 » USD 74 2022-01-06 Reiterated by BMO Financial Buy 2021-12-15 Reiterated by SVB Leerink Buy 2021-12-14 Initiates Coverage On Wells Fargo Equal-Weight USD 72 2021-12-09
- 8. Page 8 of 10 Any information in this report is not , and should not be regarded as investment advice or as a recommendation regarding any particular security or course of action. We recommend seeking a licensed professional for investment advice. GILD:NSD (Gilead Sciences Inc) Drug Manufacturers-General | | Common Stock Stock Target Advisor Detailed Stock Report Report Date: 16th May, 2022 Annual Financial (USD)
- 9. Page 9 of 10 Any information in this report is not , and should not be regarded as investment advice or as a recommendation regarding any particular security or course of action. We recommend seeking a licensed professional for investment advice. GILD:NSD (Gilead Sciences Inc) Drug Manufacturers-General | | Common Stock Stock Target Advisor Detailed Stock Report Report Date: 16th May, 2022 Quarterly Financial (USD)
- 10. Page 10 of 10 Any information in this report is not , and should not be regarded as investment advice or as a recommendation regarding any particular security or course of action. We recommend seeking a licensed professional for investment advice. GILD:NSD (Gilead Sciences Inc) Drug Manufacturers-General | | Common Stock Stock Target Advisor Detailed Stock Report Report Date: 16th May, 2022 Largest Industry Peers for Drug Manufacturers-General Symbol Company Name Price(Change) Market Cap AZN AstraZeneca PLC N/A USD 194.16B AMGN Amgen Inc N/A USD 130.02B SNY Sanofi N/A USD 127.91B CELG Celgene Corporation N/A USD 77.04B BIIB Biogen Inc N/A USD 29.16B HZNP Horizon Therapeutics Public Li.. N/A USD 20.79B GRFS Grifols S.A N/A USD 11.99B GWPH GW Pharmaceuticals plc N/A USD 6.81B CRXT Clarus Therapeutics Holdings I.. N/A USD 0.02B CRXTW Clarus Therapeutics Holdings I.. N/A N/A ETFs Containing GILD Symbol Company Name Weight Mer Price(Change) Market Cap UBIO ProShares UltraPro Nasdaq Biot.. 7.77 % 0.95 % N/A USD 0.02B BBH VanEck Vectors Biotech ETF 0.00 % 0.35 % N/A USD 0.44B MVUS:PA Ossiam IRL ICAV - Ossiam US Mi.. 0.00 % 0.00 % N/A N/A SPBO SPDR Portfolio Corporate Bond .. 0.00 % 0.00 % N/A N/A BTEC:LSE iShares Nasdaq US Biotechnolog.. 0.00 % 0.00 % N/A USD 0.37B BTEK:LSE iShares IV Public Limited Comp.. 0.00 % 0.00 % N/A USD 0.46B BTEE:LSE iShares Nasdaq US Biotechnolog.. 0.00 % 0.00 % N/A USD 0.45B FSUS:LSE iShares IV Public Limited Comp.. 0.00 % 0.00 % N/A USD 0.12B IFSU:LSE iShares Edge MSCI USA Multifac.. 0.00 % 0.00 % N/A USD 0.12B IFSW:LSE iShares Edge MSCI World Multif.. 0.00 % 0.00 % N/A USD 0.46B The Stock Target Advisor platform run millions of calculations every day on over 30,000 Canadian and American stocks, comparing and ranking their financial and market performance against their sectors and exchange. We represent the percentile ranking using the following grading system. Letter Grade Percentage Letter Grade Percentage Letter Grade Percentage A+ 97%-100% A 93%-96% A- 90%-92% B+ 97%-89% B 83%-86% B- 80%-82% C+ 77%-79% C 73%-76% C- 70%-72% D+ 67%-69% D 63%-66% D- 60%-62% F 0%-59%