Thoughtworks Holding Inc (TWKS) Stock Analysis Report
•
0 likes•31 views

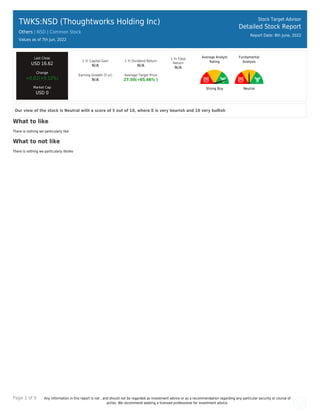
This report provides a neutral analysis of Thoughtworks Holding Inc. (TWKS) stock. It finds the fundamentals analysis neutral with a score of 5 out of 10. The average analyst rating is strong buy and the average target price is $27.50, representing a 65.46% increase from the last close. No annual or quarterly financial data is available for the stock.

Recommended
More Related Content
Similar to Thoughtworks Holding Inc (TWKS) Stock Analysis Report
Similar to Thoughtworks Holding Inc (TWKS) Stock Analysis Report (20)
More from Stock Target Advisor
More from Stock Target Advisor (20)
Recently uploaded
Recently uploaded (20)
Thoughtworks Holding Inc (TWKS) Stock Analysis Report
- 1. Page 1 of 9 Any information in this report is not , and should not be regarded as investment advice or as a recommendation regarding any particular security or course of action. We recommend seeking a licensed professional for investment advice. TWKS:NSD (Thoughtworks Holding Inc) Others | NSD | Common Stock Values as of 7th Jun, 2022 Stock Target Advisor Detailed Stock Report Report Date: 8th June, 2022 Last Close USD 16.62 Change +0.02(+0.12%) Market Cap USD 0 1 Yr Capital Gain N/A 1 Yr Dividend Return N/A 1 Yr Total Return N/A Earning Growth (5 yr) N/A Average Target Price 27.50(+65.46% ) Average Analyst Rating Strong Buy Fundamental Analysis Neutral Our view of the stock is Neutral with a score of 5 out of 10, where 0 is very bearish and 10 very bullish What to like There is nothing we particularly like What to not like There is nothing we particularly dislike
- 2. Page 2 of 9 Any information in this report is not , and should not be regarded as investment advice or as a recommendation regarding any particular security or course of action. We recommend seeking a licensed professional for investment advice. TWKS:NSD (Thoughtworks Holding Inc) Others | | Common Stock Stock Target Advisor Detailed Stock Report Report Date: 8th June, 2022 Adjusted Closing Share Volume Relative Returns Relative Performance (Total Returns) Security Capital Gain Dividend Return Total Return TWKS Thoughtworks Holding Inc -43.5% 0 -43.5% QQQ Invesco QQQ Trust -18% +0.2% -17.8%
- 3. Page 3 of 9 Any information in this report is not , and should not be regarded as investment advice or as a recommendation regarding any particular security or course of action. We recommend seeking a licensed professional for investment advice. Technical Indicators Value Value Beta N/A 52 Week High N/A Short Ratio N/A 52 Week Low N/A Shorted Shares N/A 200 Day Moving Average N/A Shorted Shares Previous Month N/A 50 Day Moving Average N/A Shares Held By Insiders N/A Short Percentage N/A Shares Held by Institutions N/A Dividend Yield N/A
- 4. Page 4 of 9 Any information in this report is not , and should not be regarded as investment advice or as a recommendation regarding any particular security or course of action. We recommend seeking a licensed professional for investment advice. TWKS:NSD (Thoughtworks Holding Inc) Others | | Common Stock Stock Target Advisor Detailed Stock Report Report Date: 8th June, 2022 Market Performance Market Performance vs. Industry / Classification (Others) Market Performance vs. Exchange (Nasdaq Global Select) Value Sector Median Percentile Rank Grade Market Median Percentile Rank Grade YTD Capital Gain -38.01% -14.4% 37% -16.4% 31% Dividend Return N/A 1.5% N/A 1.0% N/A Total Return -38.01% -14.0% 37% -16.0% 31% Trailing 12 Months Capital Gain N/A -13.1% N/A -20.2% N/A Dividend Return N/A 3.0% N/A 2.3% N/A Total Return N/A -12.5% N/A -18.5% N/A Trailing 5 Years Capital Gain N/A -4.2% N/A 7.4% N/A Dividend Return N/A 11.7% N/A 11.0% N/A Total Return N/A 3.5% N/A 17.8% N/A Average Annual (5 Year Horizon) Capital Gain N/A -1.0% N/A 2.3% N/A Dividend Return N/A 0.6% N/A 1.8% N/A Total Return N/A -0.9% N/A 4.2% N/A Risk Return Profile Volatility (Standard Deviation) N/A 12.3% N/A 32.2% N/A Risk Adjusted Return N/A N/A N/A 20.5% N/A Market Capitalization N/A 0.05B N/A 0.42B N/A
- 5. Page 5 of 9 Any information in this report is not , and should not be regarded as investment advice or as a recommendation regarding any particular security or course of action. We recommend seeking a licensed professional for investment advice. Key Financial Ratios Ratios vs. Industry / Classification (Computer Hardware) Ratios vs. Exchange (Nasdaq Global Select) Value Sector Median Percentile Rank Grade Market Median Percentile Rank Grade Market Value peratio N/A 16.0 N/A 16.7 N/A pbratio N/A 1.7 N/A 1.6 N/A pcfratio N/A 0.0 N/A 0.0 N/A pfcfratio N/A 1.7 N/A 10.1 N/A Management Effectiveness retequity N/A 129.7% N/A 0.5% N/A retinvcap N/A -1.5% N/A -0.5% N/A retass N/A -42.2% N/A 0.2% N/A debtequityratio N/A 1,219.5% N/A 32.3% N/A Technical Ratios yield N/A 1.8% N/A 2.6% N/A sratio N/A 1.02 N/A 3.06 N/A spercent N/A 130.0% N/A 3.0% N/A beta N/A 1.01 N/A 1.09 N/A
- 6. Page 6 of 9 Any information in this report is not , and should not be regarded as investment advice or as a recommendation regarding any particular security or course of action. We recommend seeking a licensed professional for investment advice. TWKS:NSD (Thoughtworks Holding Inc) Others | | Common Stock Stock Target Advisor Detailed Stock Report Report Date: 8th June, 2022 Recent Analyst Ratings Price Action Rating Action Analyst Rating Price date Target Lowered by Citigroup USD 30 » USD 24 2022-05-10 Target Lowered by RBC Royalbank USD 31 » USD 25 2022-05-10 Target Lowered by Robert W Baird USD 30 » USD 25 2022-04-14 Maintains Piper Sandler Overweight USD 35 » USD 28 2022-03-02 Maintains RBC Royalbank Outperform USD 36 » USD 31 2022-03-02 Maintains Credit Suisse Neutral USD 31 » USD 25 2022-03-02 Maintains Citigroup Buy USD 36 » USD 30 2022-03-02 Upgrades Goldman Sachs Buy USD 34 » USD 32 2022-01-10 Target Raised by Citigroup Buy USD 32 » USD 36 2021-11-16 Maintains RBC Royalbank Outperform USD 35 » USD 36 2021-11-16 Target Raised by Credit Suisse Neutral USD 28 » USD 31 2021-11-16 Initiates Coverage On Piper Sandler Overweight USD 33 2021-10-11 Initiates Coverage On Goldman Sachs Neutral USD 30 2021-10-11 Initiated by William Blair Outperform 2021-10-11 Initiates Coverage On RBC Royalbank Outperform USD 35 2021-10-11 Initiates Coverage On Cowen Outperform USD 31 2021-10-11 Initiates Coverage On Credit Suisse Neutral USD 28 2021-10-11 Initiates Coverage On Citigroup Buy USD 32 2021-10-11 Initiated by JP Morgan & Company Overweight USD 34 2021-10-11 Initiated by Wedbush Outperform USD 35 2021-10-11 Initiated by Robert W Baird Neutral USD 31 2021-10-11 Initiated by Wolfe Research Outperform USD 32 2021-10-11 Initiated by Bank of America Securities Neutral USD 28 2021-10-11
- 7. Page 7 of 9 Any information in this report is not , and should not be regarded as investment advice or as a recommendation regarding any particular security or course of action. We recommend seeking a licensed professional for investment advice. TWKS:NSD (Thoughtworks Holding Inc) Others | | Common Stock Stock Target Advisor Detailed Stock Report Report Date: 8th June, 2022 Annual Financial (USD) No record found.
- 8. Page 8 of 9 Any information in this report is not , and should not be regarded as investment advice or as a recommendation regarding any particular security or course of action. We recommend seeking a licensed professional for investment advice. TWKS:NSD (Thoughtworks Holding Inc) Others | | Common Stock Stock Target Advisor Detailed Stock Report Report Date: 8th June, 2022 Quarterly Financial (USD) No record found.
- 9. Page 9 of 9 Any information in this report is not , and should not be regarded as investment advice or as a recommendation regarding any particular security or course of action. We recommend seeking a licensed professional for investment advice. TWKS:NSD (Thoughtworks Holding Inc) Others | | Common Stock Stock Target Advisor Detailed Stock Report Report Date: 8th June, 2022 Largest Industry Peers for Others Symbol Company Name Price(Change) Market Cap ACWI iShares MSCI ACWI ETF +0.70 (+0.8%) USD 17.91B CGABL The Carlyle Group Inc. 4.625% .. +0.10 (+0.5%) USD 16.14B CNXCV Concentrix Corporation N/A USD 4.91B BUG Global X Cybersecurity ETF +0.40 (+1.5%) USD 1.17B TCRX Tscan Therapeutics Inc +0.29 (+9.1%) USD 0.82B AGCWW Altimeter Growth Corp N/A USD 0.74B ERESW East Resources Acquisition Com.. -0.06 (-26.1%) USD 0.42B FREEW FREEW N/A USD 0.28B NFIN Netfin Acquisition Corp N/A USD 0.26B HERO Global X Video Games & Esports.. +0.21 (+0.9%) USD 0.26B The Stock Target Advisor platform run millions of calculations every day on over 30,000 Canadian and American stocks, comparing and ranking their financial and market performance against their sectors and exchange. We represent the percentile ranking using the following grading system. Letter Grade Percentage Letter Grade Percentage Letter Grade Percentage A+ 97%-100% A 93%-96% A- 90%-92% B+ 97%-89% B 83%-86% B- 80%-82% C+ 77%-79% C 73%-76% C- 70%-72% D+ 67%-69% D 63%-66% D- 60%-62% F 0%-59%