Walmart Inc (WMT) Stock Analysis

Walmart Inc. engages in the operation of retail, wholesale, and other units worldwide. The company operates through three segments: Walmart U.S., Walmart International, and Sam's Club. It operates supercenters, supermarkets, hypermarkets, warehouse clubs, cash and carry stores, and discount stores; membership-only warehouse clubs; ecommerce websites, such as walmart.com, walmart.com.mx, walmart.ca, flipkart.com, and samsclub.com; and mobile commerce applications. Based on the Walmart Inc stock forecasts from 24 analysts, the average analyst target price for Walmart Inc is USD 158.35 over the next 12 months. Walmart Inc’s average analyst rating is Buy . Stock Target Advisor’s own stock analysis of Walmart Inc is Neutral, which is based on 8 positive signals and 9 negative signals. At the last closing, Walmart Inc’s stock price was USD 122.43. Walmart Inc’s stock price has changed by -17.06% over the past week, -21.46% over the past month and -13.73% over the last year.

Recommended
Recommended
More Related Content
Similar to Walmart Inc (WMT) Stock Analysis
Similar to Walmart Inc (WMT) Stock Analysis (20)
More from Stock Target Advisor
More from Stock Target Advisor (19)
Recently uploaded
Recently uploaded (20)
Walmart Inc (WMT) Stock Analysis
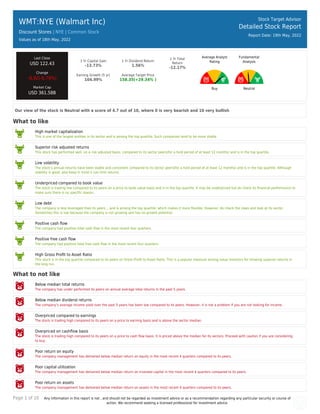
- 1. Page 1 of 10 Any information in this report is not , and should not be regarded as investment advice or as a recommendation regarding any particular security or course of action. We recommend seeking a licensed professional for investment advice. WMT:NYE (Walmart Inc) Discount Stores | NYE | Common Stock Values as of 18th May, 2022 Stock Target Advisor Detailed Stock Report Report Date: 19th May, 2022 Last Close USD 122.43 Change -8.92(-6.79%) Market Cap USD 361.58B 1 Yr Capital Gain -13.73% 1 Yr Dividend Return 1.56% 1 Yr Total Return -12.17% Earning Growth (5 yr) 104.99% Average Target Price 158.35(+29.34% ) Average Analyst Rating Buy Fundamental Analysis Neutral Our view of the stock is Neutral with a score of 4.7 out of 10, where 0 is very bearish and 10 very bullish What to like High market capitalization This is one of the largest entities in its sector and is among the top quartile. Such companies tend to be more stable. Superior risk adjusted returns This stock has performed well, on a risk adjusted basis, compared to its sector peers(for a hold period of at least 12 months) and is in the top quartile. Low volatility The stock’s annual returns have been stable and consistent compared to its sector peers(for a hold period of at least 12 months) and is in the top quartile. Although stability is good, also keep in mind it can limit returns. Underpriced compared to book value The stock is trading low compared to its peers on a price to book value basis and is in the top quartile. It may be underpriced but do check its financial performance to make sure there is no specific reason. Low debt The company is less leveraged than its peers ,, and is among the top quartile, which makes it more flexible. However, do check the news and look at its sector. Sometimes this is low because the company is not growing and has no growth potential. Positive cash flow The company had positive total cash flow in the most recent four quarters. Positive free cash flow The company had positive total free cash flow in the most recent four quarters. High Gross Profit to Asset Ratio This stock is in the top quartile compared to its peers on Gross Profit to Asset Ratio. This is a popular measure among value investors for showing superior returns in the long run. What to not like Below median total returns The company has under performed its peers on annual average total returns in the past 5 years. Below median dividend returns The company’s average income yield over the past 5 years has been low compared to its peers. However, it is not a problem if you are not looking for income. Overpriced compared to earnings The stock is trading high compared to its peers on a price to earning basis and is above the sector median. Overpriced on cashflow basis The stock is trading high compared to its peers on a price to cash flow basis. It is priced above the median for its sectors. Proceed with caution if you are considering to buy. Poor return on equity The company management has delivered below median return on equity in the most recent 4 quarters compared to its peers. Poor capital utilization The company management has delivered below median return on invested capital in the most recent 4 quarters compared to its peers. Poor return on assets The company management has delivered below median return on assets in the most recent 4 quarters compared to its peers.
- 2. Page 2 of 10 Any information in this report is not , and should not be regarded as investment advice or as a recommendation regarding any particular security or course of action. We recommend seeking a licensed professional for investment advice. Overpriced on free cash flow basis The stock is trading high compared to its peers on a price to free cash flow basis. It is priced above the median for its sectors. Proceed with caution if you are considering to buy. Low Revenue Growth This stock has shown below median revenue growth in the previous 5 years compared to its sector
- 3. Page 3 of 10 Any information in this report is not , and should not be regarded as investment advice or as a recommendation regarding any particular security or course of action. We recommend seeking a licensed professional for investment advice. WMT:NYE (Walmart Inc) Discount Stores | | Common Stock Stock Target Advisor Detailed Stock Report Report Date: 19th May, 2022 Adjusted Closing Share Volume Relative Returns Relative Performance (Total Returns) Security Capital Gain Dividend Return Total Return WMT Walmart Inc -13.7% +1.6% -12.2% VTI Vanguard Index Funds - Vanguard Total Stock Market ETF -8.1% +1.4% -6.7% Company Overview Walmart Inc. engages in the operation of retail, wholesale, and other units worldwide. The company operates through three segments: Walmart U.S., Walmart International, and Sam's Club. It operates supercenters, supermarkets, hypermarkets, warehouse clubs, cash and carry stores, and discount stores; membership-only warehouse clubs; ecommerce websites, such as walmart.com, walmart.com.mx, walmart.ca, flipkart.com, and samsclub.com; and mobile commerce applications. The company offers grocery and consumables, which includes dairy, meat, bakery, deli, produce, dry, chilled or frozen packaged foods, alcoholic and nonalcoholic beverages, floral, snack foods, candy, other grocery items, health and beauty aids, paper goods, laundry and home care, baby care, pet supplies, and other consumable items; and health and wellness products covering pharmacy, over-the-counter drugs and other medical products, and optical and hearing services. It also provides gasoline stations and tobacco; home improvement, outdoor living, gardening, furniture, apparel, jewelry, tools and power equipment, housewares, toys, seasonal items, mattresses, and tire and battery centers; and consumer electronics and accessories, software, video games, office supplies, appliances, and third-party gift cards. In addition, the company offers fuel and financial services and related products, including money orders, prepaid cards, money transfers, and check cashing and bill payment, as well as various types of installment lending. It operates approximately 10,500 stores and various e-commerce websites under 46 banners in 24 countries. The company was formerly known as Wal-Mart Stores, Inc. and changed its name to Walmart Inc. in February 2018. The company was founded in 1945 and is based in Bentonville, Arkansas.
- 4. Page 4 of 10 Any information in this report is not , and should not be regarded as investment advice or as a recommendation regarding any particular security or course of action. We recommend seeking a licensed professional for investment advice. Company Website https://www.stock.walmart.com Address 702 South West 8th Street, Bentonville, AR, United States, 72716 Fiscal Year End January Employees 2300000 Technical Indicators Value Value Beta 0.55 52 Week High 160.19 Short Ratio 1.71 52 Week Low 130.64 Shorted Shares 12,361,771 200 Day Moving Average 144.68 Shorted Shares Previous Month 10,632,640 50 Day Moving Average 149.83 Shares Held By Insiders 4,770.20% Short Percentage 1.00% Shares Held by Institutions 32.85 Dividend Yield 1.71%
- 5. Page 5 of 10 Any information in this report is not , and should not be regarded as investment advice or as a recommendation regarding any particular security or course of action. We recommend seeking a licensed professional for investment advice. WMT:NYE (Walmart Inc) Discount Stores | | Common Stock Stock Target Advisor Detailed Stock Report Report Date: 19th May, 2022 Market Performance Market Performance vs. Industry / Classification (Discount Stores) Market Performance vs. Exchange (Nasdaq Global Select) Value Sector Median Percentile Rank Grade Market Median Percentile Rank Grade YTD Capital Gain -15.38% -20.2% 80% -14.1% 46% Dividend Return 0.77% 0.7% 75% 1.0% 43% Total Return -14.61% -20.2% 80% -13.2% 46% Trailing 12 Months Capital Gain -13.73% -26.2% 60% -10.9% 43% Dividend Return 1.56% 1.6% 50% 2.8% 31% Total Return -12.17% -24.6% 60% -8.1% 40% Trailing 5 Years Capital Gain 55.43% 55.4% 50% 5.3% 77% Dividend Return 14.23% 12.3% 75% 13.0% 55% Total Return 69.66% 69.7% 50% 20.6% 77% Average Annual (5 Year Horizon) Capital Gain 13.92% 18.9% 20% 5.0% 72% Dividend Return 2.11% 2.1% 50% 2.1% 50% Total Return 16.03% 22.2% 20% 8.1% 72% Risk Return Profile Volatility (Standard Deviation) 10.29% 32.9% 100% 22.8% 80% Risk Adjusted Return 155.80% N/A 80% 40.9% 99% Market Capitalization 361.58B 52.06B 100% 8.61B 100%
- 6. Page 6 of 10 Any information in this report is not , and should not be regarded as investment advice or as a recommendation regarding any particular security or course of action. We recommend seeking a licensed professional for investment advice. Key Financial Ratios Ratios vs. Industry / Classification (Computer Hardware) Ratios vs. Exchange (Nasdaq Global Select) Value Sector Median Percentile Rank Grade Market Median Percentile Rank Grade Market Value peratio 27.0 20.7 20% 16.2 24% pbratio 4.9 8.5 80% 1.6 15% pcfratio 15.0 11.6 40% 7.3 28% pfcfratio 14.3 14.4 60% 10.8 34% Management Effectiveness retequity 15.54% 15.6% 20% 10.2% 68% retinvcap 17.17% 24.1% 40% 5.6% 84% retass 6.52% 7.2% 40% 2.6% 80% debtequityratio 41.88% 66.6% 80% 68.8% 66% Technical Ratios yield 1.71% 1.6% 75% 3.1% 29% sratio 1.71 3.84 100% 2.14 57% spercent 0.86% 7.4% 100% 3.6% 79% beta 0.55 0.59 80% 1.04 81%
- 7. Page 7 of 10 Any information in this report is not , and should not be regarded as investment advice or as a recommendation regarding any particular security or course of action. We recommend seeking a licensed professional for investment advice. WMT:NYE (Walmart Inc) Discount Stores | | Common Stock Stock Target Advisor Detailed Stock Report Report Date: 19th May, 2022 Recent Analyst Ratings Price Action Rating Action Analyst Rating Price date Target Set by Goldman Sachs USD 160 2022-05-18 Target Down Raymond James Capital Outperform USD 150 2022-05-18 Reiterated Jefferies Financial LLC Buy USD 175 » USD 155 2022-05-18 Target Down Citigroup Buy USD 166 2022-05-18 Target Down Wells Fargo NA USD 150 2022-05-18 Reiterated JP Morgan & Company Neutral USD 141 » USD 134 2022-05-18 Reiterated Stifel Nicolaus Research Hold USD 155 » USD 150 2022-05-18 Reiterated Evercore ISI In-Line USD 140 » USD 135 2022-05-18 Target Down MKM Partners NA USD 159 2022-05-18 Target Down Guggenheim Securities NA USD 175 2022-05-18 Target Down Telsey Advisory Group Outperform USD 160 2022-05-18 Target Down Credit Suisse NA USD 155 2022-05-18 Target Down BMO Financial Outperform USD 165 2022-05-18 Reiterated Gordon Haskett Hold USD 140 » USD 135 2022-05-18 Reiterated Bank of America Securities Buy USD 190 » USD 160 2022-05-18 Reiterated UBS Buy USD 180 » USD 165 2022-05-18 Target Down RBC Royalbank Outperform USD 153 2022-05-18 Target Down Truist Securities NA USD 139 2022-05-18 Target Down Deutsche Bank Capital NA USD 166 2022-05-18 Target Raised by D.A. Davidson Buy USD 168 » USD 171 2022-04-08 Maintains Raymond James Capital Outperform USD 170 » USD 165 2022-02-22 Maintains Morgan Stanley Overweight USD 170 » USD 165 2022-02-22 Maintains Deutsche Bank Capital Buy USD 186 » USD 184 2022-02-18 Target Set by Goldman Sachs USD 180 2022-02-18 Maintains Jefferies Financial LLC Buy USD 184 » USD 175 2022-02-18
- 8. Page 8 of 10 Any information in this report is not , and should not be regarded as investment advice or as a recommendation regarding any particular security or course of action. We recommend seeking a licensed professional for investment advice. WMT:NYE (Walmart Inc) Discount Stores | | Common Stock Stock Target Advisor Detailed Stock Report Report Date: 19th May, 2022 Annual Financial (USD)
- 9. Page 9 of 10 Any information in this report is not , and should not be regarded as investment advice or as a recommendation regarding any particular security or course of action. We recommend seeking a licensed professional for investment advice. WMT:NYE (Walmart Inc) Discount Stores | | Common Stock Stock Target Advisor Detailed Stock Report Report Date: 19th May, 2022 Quarterly Financial (USD)
- 10. Page 10 of 10 Any information in this report is not , and should not be regarded as investment advice or as a recommendation regarding any particular security or course of action. We recommend seeking a licensed professional for investment advice. WMT:NYE (Walmart Inc) Discount Stores | | Common Stock Stock Target Advisor Detailed Stock Report Report Date: 19th May, 2022 Largest Industry Peers for Discount Stores Symbol Company Name Price(Change) Market Cap TGT Target Corporation -53.67 (-24.9%) USD 99.82B DG Dollar General Corporation -25.29 (-11.1%) USD 52.06B BJ BJ's Wholesale Club Holdings I.. -10.39 (-16.3%) USD 8.61B BIG Big Lots Inc -3.86 (-11.7%) USD 0.94B 7532 Pan Pacific International Hold.. N/A N/A 2651 Lawson Inc N/A N/A 2782 Seria Co Ltd N/A N/A ETFs Containing WMT Symbol Company Name Weight Mer Price(Change) Market Cap HEWA:LSE HSBC ETFs Public Limited Compa.. 1.41 % 0.00 % N/A USD 0.10B H41I:F HSBC ETFs Public Limited Compa.. 1.41 % 0.00 % N/A USD 0.10B H41I:XETRA HSBC Economic Scale Worldwide .. 1.41 % 0.00 % N/A USD 0.10B FLQG Franklin LibertyQ Global Equit.. 1.09 % 0.34 % -1.21 (0.0%) USD 0.02B UKCO:LSE SSgA SPDR ETFs Europe I Public.. 0.50 % 0.00 % N/A USD 0.32B SYBS:XETRA SSgA SPDR ETFs Europe I Public.. 0.38 % 0.00 % -0.12 (0.0%) USD 0.32B SYBS:F SSgA SPDR ETFs Europe I Public.. 0.38 % 0.00 % -0.32 (0.0%) USD 0.32B QVMP:F PowerShares Global Funds Irela.. 0.00 % 0.00 % +0.28 (+0.0%) USD 0.01B XDWS:F Xtrackers (IE) Public Limited .. 0.00 % 0.00 % -0.34 (0.0%) USD 0.70B UBUW:F UBS (Irl) ETF Public Limited C.. 0.00 % 0.00 % +0.04 (+0.0%) USD 0.06B The Stock Target Advisor platform run millions of calculations every day on over 30,000 Canadian and American stocks, comparing and ranking their financial and market performance against their sectors and exchange. We represent the percentile ranking using the following grading system. Letter Grade Percentage Letter Grade Percentage Letter Grade Percentage A+ 97%-100% A 93%-96% A- 90%-92% B+ 97%-89% B 83%-86% B- 80%-82% C+ 77%-79% C 73%-76% C- 70%-72% D+ 67%-69% D 63%-66% D- 60%-62% F 0%-59%