Cenovus Energy Inc (CVE) Stock Analysis Report
•
0 likes•7 views

Based on the Cenovus Energy Inc stock forecasts from 12 analysts, the average analyst target price for Cenovus Energy Inc is USD 24.29 over the next 12 months. Cenovus Energy Inc’s average analyst rating is Strong Buy. Stock Target Advisor’s own stock analysis of Cenovus Energy Inc is Slightly Bearish, which is based on 5 positive signals and 11 negative signals. At the last closing, Cenovus Energy Inc’s stock price was USD 20.63. Cenovus Energy Inc’s stock price has changed by +10.26% over the past week, +18.09% over the past month and +156.59% over the last year.

Recommended
More Related Content
Similar to Cenovus Energy Inc (CVE) Stock Analysis Report
Similar to Cenovus Energy Inc (CVE) Stock Analysis Report (20)
More from Stock Target Advisor
More from Stock Target Advisor (20)
Recently uploaded
Recently uploaded (20)
Cenovus Energy Inc (CVE) Stock Analysis Report
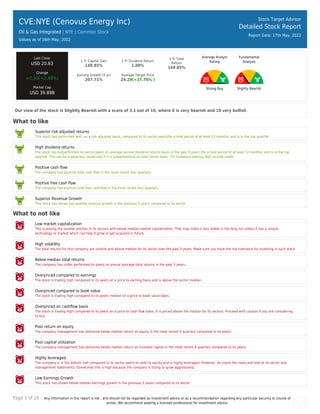
- 1. Page 1 of 10 Any information in this report is not , and should not be regarded as investment advice or as a recommendation regarding any particular security or course of action. We recommend seeking a licensed professional for investment advice. CVE:NYE (Cenovus Energy Inc) Oil & Gas Integrated | NYE | Common Stock Values as of 16th May, 2022 Stock Target Advisor Detailed Stock Report Report Date: 17th May, 2022 Last Close USD 20.63 Change +0.50(+2.48%) Market Cap USD 39.89B 1 Yr Capital Gain 148.85% 1 Yr Dividend Return 1.00% 1 Yr Total Return 149.85% Earning Growth (5 yr) 207.71% Average Target Price 24.29(+17.76% ) Average Analyst Rating Strong Buy Fundamental Analysis Slightly Bearish Our view of the stock is Slightly Bearish with a score of 3.1 out of 10, where 0 is very bearish and 10 very bullish What to like Superior risk adjusted returns This stock has performed well, on a risk adjusted basis, compared to its sector peers(for a hold period of at least 12 months) and is in the top quartile. High dividend returns The stock has outperformed its sector peers on average annual dividend returns basis in the past 5 years (for a hold period of at least 12 months) and is in the top quartile. This can be a good buy, especially if it is outperforming on total return basis , for investors seeking high income yields. Positive cash flow The company had positive total cash flow in the most recent four quarters. Positive free cash flow The company had positive total free cash flow in the most recent four quarters. Superior Revenue Growth This stock has shown top quartile revenue growth in the previous 5 years compared to its sector. What to not like Low market capitalization This is among the smaller entities in its sectors with below median market capitalization. That may make it less stable in the long run unless it has a unique technology or market which can help it grow or get acquired in future. High volatility The total returns for this company are volatile and above median for its sector over the past 5 years. Make sure you have the risk tolerance for investing in such stock. Below median total returns The company has under performed its peers on annual average total returns in the past 5 years. Overpriced compared to earnings The stock is trading high compared to its peers on a price to earning basis and is above the sector median. Overpriced compared to book value The stock is trading high compared to its peers median on a price to book value basis. Overpriced on cashflow basis The stock is trading high compared to its peers on a price to cash flow basis. It is priced above the median for its sectors. Proceed with caution if you are considering to buy. Poor return on equity The company management has delivered below median return on equity in the most recent 4 quarters compared to its peers. Poor capital utilization The company management has delivered below median return on invested capital in the most recent 4 quarters compared to its peers. Highly leveraged The company is in the bottom half compared to its sector peers on debt to equity and is highly leveraged. However, do check the news and look at its sector and management statements. Sometimes this is high because the company is trying to grow aggressively. Low Earnings Growth This stock has shown below median earnings growth in the previous 5 years compared to its sector
- 2. Page 2 of 10 Any information in this report is not , and should not be regarded as investment advice or as a recommendation regarding any particular security or course of action. We recommend seeking a licensed professional for investment advice. Low Dividend Growth This stock has shown below median dividend growth in the previous 5 years compared to its sector.
- 3. Page 3 of 10 Any information in this report is not , and should not be regarded as investment advice or as a recommendation regarding any particular security or course of action. We recommend seeking a licensed professional for investment advice. CVE:NYE (Cenovus Energy Inc) Oil & Gas Integrated | | Common Stock Stock Target Advisor Detailed Stock Report Report Date: 17th May, 2022 Adjusted Closing Share Volume Relative Returns Relative Performance (Total Returns) Security Capital Gain Dividend Return Total Return CVE Cenovus Energy Inc +156.6% +1% +157.6% VTI Vanguard Index Funds - Vanguard Total Stock Market ETF -7.3% +1.4% -5.9% Company Overview Cenovus Energy Inc., together with its subsidiaries, develops, produces, and markets crude oil, natural gas liquids, and natural gas in Canada, the United States, and the Asia Pacific region. The company operates through Oil Sands, Conventional, Offshore, Canadian Manufacturing, U.S. Manufacturing, and Retail segments. The Oil Sands segment develops and produces bitumen and heavy oil in northern Alberta and Saskatchewan. This segments Foster Creek, Christina Lake, Sunrise, and Tucker oil sands projects, as well as Lloydminster thermal and conventional heavy oil assets The Conventional segment holds assets primarily located in Elmworth-Wapiti, Kaybob-Edson, Clearwater, and Rainbow Lake operating in Alberta and British Columbia, as well as interests in various natural gas processing facilities. The offshore segment engages in the exploration and development activities. The Canadian Manufacturing segment includes the owned and operated Lloydminster upgrading and asphalt refining complex, which upgrades heavy oil and bitumen into synthetic crude oil, diesel fuel, asphalt, and other ancillary products, as well as owns and operates the Bruderheim crude-by-rail terminal and two ethanol plants. The U.S. Manufacturing segment comprises the refining of crude oil to produce diesel, gasoline, jet fuel, asphalt, and other products. The Retail segment consists of marketing of its own and third-party refined petroleum products through retail, commercial, and bulk petroleum outlets, as well as wholesale channels. Cenovus Energy Inc. was founded in 2009 and is headquartered in Calgary, Canada.
- 4. Page 4 of 10 Any information in this report is not , and should not be regarded as investment advice or as a recommendation regarding any particular security or course of action. We recommend seeking a licensed professional for investment advice. Company Website https://www.cenovus.com Address 225, 6 Avenue South West, Calgary, AB, Canada, T2P 0M5 Fiscal Year End December Employees 5938 Technical Indicators Value Value Beta 3.62 52 Week High 20.47 Short Ratio 1.62 52 Week Low 7.16 Shorted Shares 18,263,929 200 Day Moving Average 13.13 Shorted Shares Previous Month 10,101,268 50 Day Moving Average 17.27 Shares Held By Insiders 2,793.80% Short Percentage N/A Shares Held by Institutions 48.02 Dividend Yield 1.64%
- 5. Page 5 of 10 Any information in this report is not , and should not be regarded as investment advice or as a recommendation regarding any particular security or course of action. We recommend seeking a licensed professional for investment advice. CVE:NYE (Cenovus Energy Inc) Oil & Gas Integrated | | Common Stock Stock Target Advisor Detailed Stock Report Report Date: 17th May, 2022 Market Performance Market Performance vs. Industry / Classification (Oil & Gas Integrated) Market Performance vs. Exchange (Nasdaq Global Select) Value Sector Median Percentile Rank Grade Market Median Percentile Rank Grade YTD Capital Gain 68.00% 28.0% 100% -13.4% 98% Dividend Return 0.22% 1.4% 9% 1.0% 12% Total Return 68.22% 30.7% 100% -12.5% 98% Trailing 12 Months Capital Gain 148.85% 31.7% 100% -11.1% 99% Dividend Return 1.00% 4.9% 7% 2.8% 18% Total Return 149.85% 33.7% 100% -8.3% 99% Trailing 5 Years Capital Gain 122.07% 10.9% 100% 6.2% 90% Dividend Return 7.51% 20.6% 14% 13.1% 24% Total Return 129.58% 31.6% 100% 22.2% 90% Average Annual (5 Year Horizon) Capital Gain 28.84% 1.6% 88% 5.0% 88% Dividend Return 1.64% 3.5% 13% 2.1% 39% Total Return 30.48% 7.1% 88% 8.1% 88% Risk Return Profile Volatility (Standard Deviation) 80.03% 37.2% 13% 22.8% 9% Risk Adjusted Return 38.09% N/A 94% 40.9% 47% Market Capitalization 39.89B 51.82B 38% 1.59B 93%
- 6. Page 6 of 10 Any information in this report is not , and should not be regarded as investment advice or as a recommendation regarding any particular security or course of action. We recommend seeking a licensed professional for investment advice. Key Financial Ratios Ratios vs. Industry / Classification (Computer Hardware) Ratios vs. Exchange (Nasdaq Global Select) Value Sector Median Percentile Rank Grade Market Median Percentile Rank Grade Market Value peratio 27.4 13.6 13% 16.2 23% pbratio 2.0 1.7 31% 1.6 39% pcfratio 6.7 4.0 25% 7.2 52% pfcfratio 4.6 2.4 38% 10.7 81% Management Effectiveness retequity 8.26% 11.5% 13% 10.3% 43% retinvcap 9.27% 9.5% 44% 5.6% 65% retass 6.29% 5.9% 63% 2.6% 78% debtequityratio 52.49% 46.2% 44% 68.5% 59% Technical Ratios yield 1.64% 4.1% 6% 7.1% 12% sratio 1.62 2.19 69% 2.13 58% spercent 0.75% 0.9% 56% 3.6% 81% beta 3.62 1.18 6% 1.04 1%
- 7. Page 7 of 10 Any information in this report is not , and should not be regarded as investment advice or as a recommendation regarding any particular security or course of action. We recommend seeking a licensed professional for investment advice. CVE:NYE (Cenovus Energy Inc) Oil & Gas Integrated | | Common Stock Stock Target Advisor Detailed Stock Report Report Date: 17th May, 2022 Recent Analyst Ratings Price Action Rating Action Analyst Rating Price date Maintains National Bank of Canada Financial Outperform USD 28 2022-05-16 Target Lowered by Cormark Securities USD 32 » USD 26 2022-05-16 Maintains TD Research Buy USD 21 » USD 21 2022-05-16 Target Lowered by Canaccord Capital USD 2.25 » USD 1.9 2022-05-16 Target Lowered by Acumen Capital USD 17 » USD 12 2022-05-16 Maintains Raymond James Capital Outperform USD 21 2022-05-16 Target Raised by Credit Suisse USD 28 » USD 32 2022-05-09 Target Raised by RBC Royalbank USD 27 » USD 28 2022-04-28 Target Raised by Scotiabank Capital USD 24 » USD 25 2022-04-18 Target Raised by CIBC Capital Markets USD 28 » USD 30 2022-04-14 Target Raised by National Bank of Canada Financial USD 28 » USD 35 2022-04-14 Reiterated by Goldman Sachs Buy » Buy USD 19 2022-03-31 Maintains Credit Suisse Outperform USD 22 » USD 26 2022-02-14 Target Raised by National Bank of Canada Financial USD 25 » USD 28 2022-02-04 Target Raised by RBC Royalbank USD 20 » USD 24 2022-01-28 Target Raised by Scotiabank Capital USD 19 » USD 20 2022-01-13 Reiterated by RBC Royalbank Buy 2021-12-21 Reiterated by Tudor Pickering Buy USD 19 2021-12-18 Target Raised by Scotiabank Capital Outperform USD 16.5 » USD 19 2021-11-19 Maintains Credit Suisse Outperform USD 18 » USD 20 2021-11-08 Target Raised by Raymond James Capital Outperform USD 18 » USD 19 2021-11-04 Target Raised by TD Research Buy USD 19.5 » USD 21 2021-11-04 Reiterated by ATB Capital Buy USD 19.5 2021-10-28 Target Raised by CIBC Capital Markets Outperform USD 20 » USD 22 2021-10-15 Maintains Credit Suisse Outperform USD 15 » USD 18 2021-10-15
- 8. Page 8 of 10 Any information in this report is not , and should not be regarded as investment advice or as a recommendation regarding any particular security or course of action. We recommend seeking a licensed professional for investment advice. CVE:NYE (Cenovus Energy Inc) Oil & Gas Integrated | | Common Stock Stock Target Advisor Detailed Stock Report Report Date: 17th May, 2022 Annual Financial (USD)
- 9. Page 9 of 10 Any information in this report is not , and should not be regarded as investment advice or as a recommendation regarding any particular security or course of action. We recommend seeking a licensed professional for investment advice. CVE:NYE (Cenovus Energy Inc) Oil & Gas Integrated | | Common Stock Stock Target Advisor Detailed Stock Report Report Date: 17th May, 2022 Quarterly Financial (USD)
- 10. Page 10 of 10 Any information in this report is not , and should not be regarded as investment advice or as a recommendation regarding any particular security or course of action. We recommend seeking a licensed professional for investment advice. CVE:NYE (Cenovus Energy Inc) Oil & Gas Integrated | | Common Stock Stock Target Advisor Detailed Stock Report Report Date: 17th May, 2022 Largest Industry Peers for Oil & Gas Integrated Symbol Company Name Price(Change) Market Cap XOM Exxon Mobil Corporation +2.09 (+2.4%) USD 375.49B CVX Chevron Corporation +5.14 (+3.1%) USD 329.83B RDS-B Royal Dutch Shell plc N/A USD 195.50B RDS-A Shell plc N/A USD 195.43B PTR PetroChina Company Limited -0.40 (-0.8%) USD 134.64B TOT TotalEnergies SE N/A USD 127.53B EQNR Equinor ASA -0.19 (-0.6%) USD 109.27B BP BP p.l.c +0.53 (+1.7%) USD 99.07B PBR Petróleo Brasileiro S.A. - Pe.. +0.34 (+2.3%) USD 94.64B PBR-A Petróleo Brasileiro S.A. - Pe.. +0.05 (+0.4%) USD 76.13B ETFs Containing CVE Symbol Company Name Weight Mer Price(Change) Market Cap IYG iShares U.S. Financial Service.. 9.44 % 0.42 % -1.75 (0.0%) USD 2.03B IYJ 6.99 % 0.42 % N/A N/A IPAY ETF Series Solutions - ISE Mob.. 5.96 % 0.75 % -0.69 (0.0%) USD 0.77B FINZ ProShares UltraPro Short Finan.. 5.88 % 0.95 % N/A USD 4.56M SEF ProShares Short Financials 5.88 % 0.95 % +0.08 (+0.0%) USD 0.02B SKF ProShares UltraShort Financial.. 5.88 % 0.95 % +0.36 (+0.0%) USD 0.01B DIVO Amplify ETF Trust - Amplify CW.. 5.63 % 0.94 % +0.12 (+0.0%) USD 1.33B ZWT:CA BMO Covered Call Technology ET.. 5.61 % 0.00 % -0.41 (0.0%) N/A SHE SPDR SSGA Gender Diversity Ind.. 5.33 % 0.20 % -0.60 (0.0%) USD 0.22B PXJ Invesco Dynamic Oil & Gas Serv.. 5.32 % 0.63 % +0.16 (+0.0%) USD 0.07B The Stock Target Advisor platform run millions of calculations every day on over 30,000 Canadian and American stocks, comparing and ranking their financial and market performance against their sectors and exchange. We represent the percentile ranking using the following grading system. Letter Grade Percentage Letter Grade Percentage Letter Grade Percentage A+ 97%-100% A 93%-96% A- 90%-92% B+ 97%-89% B 83%-86% B- 80%-82% C+ 77%-79% C 73%-76% C- 70%-72% D+ 67%-69% D 63%-66% D- 60%-62% F 0%-59%