NVDA Stock Forecast.pdf
•
0 likes•9 views

NVDA Stock Forecast & Price: Based on the NVIDIA Corporation stock forecasts from 32 analysts, the average analyst target price for NVIDIA Corporation is USD 240.81 over the next 12 months. NVIDIA Corporation’s average analyst rating is Strong Buy. Stock Target Advisor’s own stock analysis of NVIDIA Corporation is Neutral, which is based on 8 positive signals and 8 negative signals. At the last closing, NVIDIA Corporation’s stock price was USD 162.60. NVIDIA Corporation’s stock price has changed by -8.90% over the past week, -9.59% over the past month and -28.17% over the last year.

Recommended
Recommended
More Related Content
Similar to NVDA Stock Forecast.pdf
Similar to NVDA Stock Forecast.pdf (20)
More from Stocktargetadvisor.com
More from Stocktargetadvisor.com (20)
Recently uploaded
Recently uploaded (20)
NVDA Stock Forecast.pdf
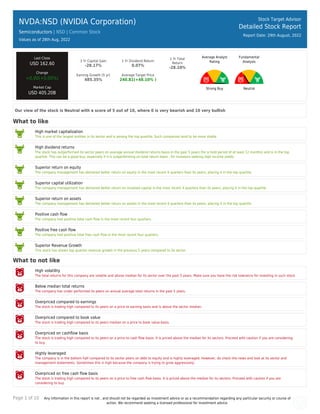
- 1. Page 1 of 10 Any information in this report is not , and should not be regarded as investment advice or as a recommendation regarding any particular security or course of action. We recommend seeking a licensed professional for investment advice. NVDA:NSD (NVIDIA Corporation) Semiconductors | NSD | Common Stock Values as of 28th Aug, 2022 Stock Target Advisor Detailed Stock Report Report Date: 29th August, 2022 Last Close USD 162.60 Change +0.00(+0.00%) Market Cap USD 405.20B 1 Yr Capital Gain -28.17% 1 Yr Dividend Return 0.07% 1 Yr Total Return -28.10% Earning Growth (5 yr) 485.35% Average Target Price 240.81(+48.10% ) Average Analyst Rating Strong Buy Fundamental Analysis Neutral Our view of the stock is Neutral with a score of 5 out of 10, where 0 is very bearish and 10 very bullish What to like High market capitalization This is one of the largest entities in its sector and is among the top quartile. Such companies tend to be more stable. High dividend returns The stock has outperformed its sector peers on average annual dividend returns basis in the past 5 years (for a hold period of at least 12 months) and is in the top quartile. This can be a good buy, especially if it is outperforming on total return basis , for investors seeking high income yields. Superior return on equity The company management has delivered better return on equity in the most recent 4 quarters than its peers, placing it in the top quartile. Superior capital utilization The company management has delivered better return on invested capital in the most recent 4 quarters than its peers, placing it in the top quartile. Superior return on assets The company management has delivered better return on assets in the most recent 4 quarters than its peers, placing it in the top quartile. Positive cash flow The company had positive total cash flow in the most recent four quarters. Positive free cash flow The company had positive total free cash flow in the most recent four quarters. Superior Revenue Growth This stock has shown top quartile revenue growth in the previous 5 years compared to its sector. What to not like High volatility The total returns for this company are volatile and above median for its sector over the past 5 years. Make sure you have the risk tolerance for investing in such stock. Below median total returns The company has under performed its peers on annual average total returns in the past 5 years. Overpriced compared to earnings The stock is trading high compared to its peers on a price to earning basis and is above the sector median. Overpriced compared to book value The stock is trading high compared to its peers median on a price to book value basis. Overpriced on cashflow basis The stock is trading high compared to its peers on a price to cash flow basis. It is priced above the median for its sectors. Proceed with caution if you are considering to buy. Highly leveraged The company is in the bottom half compared to its sector peers on debt to equity and is highly leveraged. However, do check the news and look at its sector and management statements. Sometimes this is high because the company is trying to grow aggressively. Overpriced on free cash flow basis The stock is trading high compared to its peers on a price to free cash flow basis. It is priced above the median for its sectors. Proceed with caution if you are considering to buy.
- 2. Page 2 of 10 Any information in this report is not , and should not be regarded as investment advice or as a recommendation regarding any particular security or course of action. We recommend seeking a licensed professional for investment advice. Low Dividend Growth This stock has shown below median dividend growth in the previous 5 years compared to its sector.
- 3. Page 3 of 10 Any information in this report is not , and should not be regarded as investment advice or as a recommendation regarding any particular security or course of action. We recommend seeking a licensed professional for investment advice. NVDA:NSD (NVIDIA Corporation) Semiconductors | | Common Stock Stock Target Advisor Detailed Stock Report Report Date: 29th August, 2022 Adjusted Closing Share Volume Relative Returns Relative Performance (Total Returns) Security Capital Gain Dividend Return Total Return NVDA NVIDIA Corporation -28.2% +0.1% -28.1% QQQ Invesco QQQ Trust -18.2% +0.4% -17.9% Company Overview NVIDIA Corporation provides graphics, and compute and networking solutions in the United States, Taiwan, China, and internationally. The company's Graphics segment offers GeForce GPUs for gaming and PCs, the GeForce NOW game streaming service and related infrastructure, and solutions for gaming platforms; Quadro/NVIDIA RTX GPUs for enterprise workstation graphics; vGPU software for cloud- based visual and virtual computing; automotive platforms for infotainment systems; and Omniverse software for building 3D designs and virtual worlds. Its Compute & Networking segment provides Data Center platforms and systems for AI, HPC, and accelerated computing; Mellanox networking and interconnect solutions; automotive AI Cockpit, autonomous driving development agreements, and autonomous vehicle solutions; cryptocurrency mining processors; Jetson for robotics and other embedded platforms; and NVIDIA AI Enterprise and other software. The company's products are used in gaming, professional visualization, datacenter, and automotive markets. NVIDIA Corporation sells its products to original equipment manufacturers, original device manufacturers, system builders, add-in board manufacturers, retailers/distributors, independent software vendors, Internet and cloud service providers, automotive manufacturers and tier-1 automotive suppliers, mapping companies, start-ups, and other ecosystem participants. It has a strategic collaboration with Kroger Co. NVIDIA Corporation was incorporated in 1993 and is headquartered in Santa Clara, California.
- 4. Page 4 of 10 Any information in this report is not , and should not be regarded as investment advice or as a recommendation regarding any particular security or course of action. We recommend seeking a licensed professional for investment advice. Company Website https://www.nvidia.com Address 2788 San Tomas Expressway, Santa Clara, CA, United States, 95051 Fiscal Year End January Employees 22473 Technical Indicators Value Value Beta 1.65 52 Week High 346.30 Short Ratio 0.63 52 Week Low 140.55 Shorted Shares 31,324,946 200 Day Moving Average 225.53 Shorted Shares Previous Month 33,395,681 50 Day Moving Average 170.02 Shares Held By Insiders 403.70% Short Percentage 1.00% Shares Held by Institutions 65.55 Dividend Yield 0.09%
- 5. Page 5 of 10 Any information in this report is not , and should not be regarded as investment advice or as a recommendation regarding any particular security or course of action. We recommend seeking a licensed professional for investment advice. NVDA:NSD (NVIDIA Corporation) Semiconductors | | Common Stock Stock Target Advisor Detailed Stock Report Report Date: 29th August, 2022 Market Performance Market Performance vs. Industry / Classification (Semiconductors) Market Performance vs. Exchange (Nasdaq Global Select) Value Sector Median Percentile Rank Grade Market Median Percentile Rank Grade YTD Capital Gain -44.71% -32.3% 27% -18.8% 28% Dividend Return 0.03% 1.0% 5% 1.5% 1% Total Return -44.69% -31.3% 27% -17.8% 28% Trailing 12 Months Capital Gain -28.17% -24.4% 43% -22.4% 45% Dividend Return 0.07% 1.3% 6% 2.3% 1% Total Return -28.10% -23.8% 43% -20.8% 45% Trailing 5 Years Capital Gain 294.90% 77.9% 88% 4.7% 92% Dividend Return 1.82% 14.2% 7% 11.0% 4% Total Return 296.72% 78.9% 88% 15.9% 92% Average Annual (5 Year Horizon) Capital Gain 58.35% 22.2% 85% 0.3% 92% Dividend Return 0.25% 1.7% 11% 1.8% 7% Total Return 58.60% 21.8% 88% 1.5% 92% Risk Return Profile Volatility (Standard Deviation) 70.19% 41.4% 19% 32.9% 18% Risk Adjusted Return 83.50% N/A 71% 14.1% 95% Market Capitalization 405.20B 4.09B 100% 0.57B 100%
- 6. Page 6 of 10 Any information in this report is not , and should not be regarded as investment advice or as a recommendation regarding any particular security or course of action. We recommend seeking a licensed professional for investment advice. Key Financial Ratios Ratios vs. Industry / Classification (Computer Hardware) Ratios vs. Exchange (Nasdaq Global Select) Value Sector Median Percentile Rank Grade Market Median Percentile Rank Grade Market Value peratio 43.6 19.5 27% 16.6 21% pbratio 16.4 3.2 4% 1.7 6% pcfratio 44.5 14.3 9% -0.1 7% pfcfratio 45.1 11.4 6% 0.5 5% Management Effectiveness retequity 41.95% 20.5% 92% -0.9% 95% retinvcap 32.08% 13.1% 90% -0.5% 93% retass 18.59% 8.4% 92% -0.1% 98% debtequityratio 41.13% 38.8% 45% 32.4% 44% Technical Ratios yield 0.09% 2.1% 5% 2.7% 1% sratio 0.63 2.97 96% 3.61 84% spercent 1.39% 3.0% 83% 2.8% 67% beta 1.65 1.28 24% 1.07 19%
- 7. Page 7 of 10 Any information in this report is not , and should not be regarded as investment advice or as a recommendation regarding any particular security or course of action. We recommend seeking a licensed professional for investment advice. NVDA:NSD (NVIDIA Corporation) Semiconductors | | Common Stock Stock Target Advisor Detailed Stock Report Report Date: 29th August, 2022 Recent Analyst Ratings Price Action Rating Action Analyst Rating Price date Maintains JP Morgan & Company Overweight USD 230 » USD 220 2022-08-25 Maintains Craig Hallum Hold USD 180 » USD 165 2022-08-25 Reiterates STA Research Buy USD 220 2022-08-25 Target Lowered by Jefferies Financial LLC USD 370 » USD 280 2022-08-25 Reiterated by Rosenblatt Securities Buy USD 320 2022-08-25 Maintains Citigroup Buy USD 285 » USD 248 2022-08-25 Maintains Robert W Baird Neutral USD 150 » USD 135 2022-08-25 Downgraded by Fubon Bank Buy » Neutral 2022-08-25 Maintains BMO Financial Outperform USD 250 » USD 230 2022-08-25 Maintains Benchmark Buy USD 228 » USD 215 2022-08-25 Maintains Barclays Overweight USD 200 » USD 190 2022-08-25 Maintains Mizuho Securities Buy USD 250 » USD 225 2022-08-25 Maintains Raymond James Capital Strong Buy USD 240 » USD 210 2022-08-25 Maintains Deutsche Bank Capital Hold USD 175 » USD 165 2022-08-25 Maintains Truist Securities Buy USD 216 » USD 198 2022-08-25 Maintains Wedbush Neutral USD 190 » USD 160 2022-08-25 Maintains Mizuho Securities Buy USD 290 » USD 250 2022-08-09 Assigns STA Research Buy USD 220 2022-08-09 Target Lowered by Truist Securities Buy USD 283 » USD 216 2022-08-09 Maintains Susquehanna Bancshares Positive USD 220 » USD 210 2022-08-09 Maintains Raymond James Capital Strong Buy USD 250 » USD 240 2022-08-09 Downgraded by Craig Hallum Buy » Hold USD 210 » USD 180 2022-08-08 Maintains Barclays Overweight USD 295 » USD 200 2022-07-25 Maintains Deutsche Bank Capital Hold USD 190 » USD 175 2022-07-20 Target Lowered by Goldman Sachs USD 192 » USD 166 2022-07-15
- 8. Page 8 of 10 Any information in this report is not , and should not be regarded as investment advice or as a recommendation regarding any particular security or course of action. We recommend seeking a licensed professional for investment advice. NVDA:NSD (NVIDIA Corporation) Semiconductors | | Common Stock Stock Target Advisor Detailed Stock Report Report Date: 29th August, 2022 Annual Financial (USD)
- 9. Page 9 of 10 Any information in this report is not , and should not be regarded as investment advice or as a recommendation regarding any particular security or course of action. We recommend seeking a licensed professional for investment advice. NVDA:NSD (NVIDIA Corporation) Semiconductors | | Common Stock Stock Target Advisor Detailed Stock Report Report Date: 29th August, 2022 Quarterly Financial (USD)
- 10. Page 10 of 10 Any information in this report is not , and should not be regarded as investment advice or as a recommendation regarding any particular security or course of action. We recommend seeking a licensed professional for investment advice. NVDA:NSD (NVIDIA Corporation) Semiconductors | | Common Stock Stock Target Advisor Detailed Stock Report Report Date: 29th August, 2022 Largest Industry Peers for Semiconductors Symbol Company Name Price(Change) Market Cap AVGO Broadcom Inc N/A USD 210.94B QCOM Qualcomm Incorporated N/A USD 155.40B TXN Texas Instruments Incorporated N/A USD 154.86B AMD Advanced Micro Devices Inc N/A USD 147.19B INTC Intel Corporation N/A USD 136.98B ADI Analog Devices Inc N/A USD 81.61B MU Micron Technology Inc N/A USD 63.57B XLNX Xilinx Inc N/A USD 48.41B NXPI NXP Semiconductors NV N/A USD 44.15B MRVL Marvell Technology Group Ltd N/A USD 42.64B ETFs Containing NVDA Symbol Company Name Weight Mer Price(Change) Market Cap QQQ:PA Invesco EQQQ NASDAQ-100 UCITS .. 2.27 % 0.00 % N/A USD 5.41B SPY SPDR® S&P 500 0.00 % 0.09 % N/A USD 373.18B SPPE:XETRA SPDR S&P 500 UCITS ETF EUR Acc.. 0.00 % 0.00 % N/A USD 0.43B NQSE:XETRA iShares VII PLC - iShares NASD.. 0.00 % 0.00 % N/A USD 0.29B QDVB:XETRA iShares Edge MSCI USA Quality .. 0.00 % 0.00 % N/A USD 2.68B QDVE:XETRA iShares S&P 500 USD Informatio.. 0.00 % 0.00 % N/A USD 3.13B SEAC:XETRA UBS(Lux)Fund Solutions MSCI W.. 0.00 % 0.00 % N/A USD 0.86B SGAS:XETRA iShares IV Public Limited Comp.. 0.00 % 0.00 % N/A USD 4.09B SXRV:XETRA iShares NASDAQ 100 UCITS ETF U.. 0.00 % 0.00 % N/A USD 7.40B SXR4:XETRA iShares VII PLC - iShares MSCI.. 0.00 % 0.00 % N/A USD 0.55B The Stock Target Advisor platform run millions of calculations every day on over 30,000 Canadian and American stocks, comparing and ranking their financial and market performance against their sectors and exchange. We represent the percentile ranking using the following grading system. Letter Grade Percentage Letter Grade Percentage Letter Grade Percentage A+ 97%-100% A 93%-96% A- 90%-92% B+ 97%-89% B 83%-86% B- 80%-82% C+ 77%-79% C 73%-76% C- 70%-72% D+ 67%-69% D 63%-66% D- 60%-62% F 0%-59%