Moderna Inc (MRNA) Stock Analysis Report

Moderna, Inc., a biotechnology company, discovers, develops, and commercializes messenger RNA therapeutics and vaccines for the treatment of infectious diseases, immuno-oncology, rare diseases, cardiovascular diseases, and auto-immune diseases in the United States, Europe, and internationally. Based on the Moderna Inc stock forecasts from 11 analysts, the average analyst target price for Moderna Inc is USD 188.39 over the next 12 months. Moderna Inc’s average analyst rating is Hold . Stock Target Advisor’s own stock analysis of Moderna Inc is Bullish , which is based on 10 positive signals and 3 negative signals. At the last closing, Moderna Inc’s stock price was USD 145.34. Moderna Inc’s stock price has changed by +0.01% over the past week, +8.14% over the past month and -33.81% over the last year.

Recommended
More Related Content
Similar to Moderna Inc (MRNA) Stock Analysis Report
Similar to Moderna Inc (MRNA) Stock Analysis Report (20)
More from Stock Target Advisor
More from Stock Target Advisor (20)
Recently uploaded
Recently uploaded (20)
Moderna Inc (MRNA) Stock Analysis Report
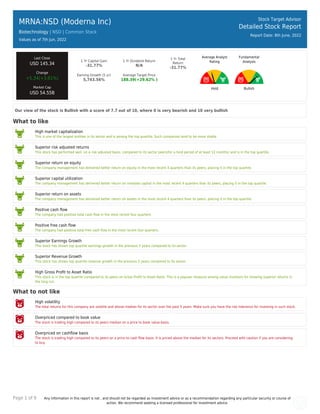
- 1. Page 1 of 9 Any information in this report is not , and should not be regarded as investment advice or as a recommendation regarding any particular security or course of action. We recommend seeking a licensed professional for investment advice. MRNA:NSD (Moderna Inc) Biotechnology | NSD | Common Stock Values as of 7th Jun, 2022 Stock Target Advisor Detailed Stock Report Report Date: 8th June, 2022 Last Close USD 145.34 Change +5.34(+3.81%) Market Cap USD 54.55B 1 Yr Capital Gain -31.77% 1 Yr Dividend Return N/A 1 Yr Total Return -31.77% Earning Growth (5 yr) 5,743.56% Average Target Price 188.39(+29.62% ) Average Analyst Rating Hold Fundamental Analysis Bullish Our view of the stock is Bullish with a score of 7.7 out of 10, where 0 is very bearish and 10 very bullish What to like High market capitalization This is one of the largest entities in its sector and is among the top quartile. Such companies tend to be more stable. Superior risk adjusted returns This stock has performed well, on a risk adjusted basis, compared to its sector peers(for a hold period of at least 12 months) and is in the top quartile. Superior return on equity The company management has delivered better return on equity in the most recent 4 quarters than its peers, placing it in the top quartile. Superior capital utilization The company management has delivered better return on invested capital in the most recent 4 quarters than its peers, placing it in the top quartile. Superior return on assets The company management has delivered better return on assets in the most recent 4 quarters than its peers, placing it in the top quartile. Positive cash flow The company had positive total cash flow in the most recent four quarters. Positive free cash flow The company had positive total free cash flow in the most recent four quarters. Superior Earnings Growth This stock has shown top quartile earnings growth in the previous 5 years compared to its sector. Superior Revenue Growth This stock has shown top quartile revenue growth in the previous 5 years compared to its sector. High Gross Profit to Asset Ratio This stock is in the top quartile compared to its peers on Gross Profit to Asset Ratio. This is a popular measure among value investors for showing superior returns in the long run. What to not like High volatility The total returns for this company are volatile and above median for its sector over the past 5 years. Make sure you have the risk tolerance for investing in such stock. Overpriced compared to book value The stock is trading high compared to its peers median on a price to book value basis. Overpriced on cashflow basis The stock is trading high compared to its peers on a price to cash flow basis. It is priced above the median for its sectors. Proceed with caution if you are considering to buy.
- 2. Page 2 of 9 Any information in this report is not , and should not be regarded as investment advice or as a recommendation regarding any particular security or course of action. We recommend seeking a licensed professional for investment advice. MRNA:NSD (Moderna Inc) Biotechnology | | Common Stock Stock Target Advisor Detailed Stock Report Report Date: 8th June, 2022 Adjusted Closing Share Volume Relative Returns Relative Performance (Total Returns) Security Capital Gain Dividend Return Total Return MRNA Moderna Inc -33.8% 0 -33.8% QQQ Invesco QQQ Trust -7.9% +0.4% -7.6% Company Overview Moderna, Inc., a biotechnology company, discovers, develops, and commercializes messenger RNA therapeutics and vaccines for the treatment of infectious diseases, immuno-oncology, rare diseases, cardiovascular diseases, and auto-immune diseases in the United States, Europe, and internationally. Its respiratory vaccines include COVID-19, flu, respiratory syncytial virus, Endemic HCoV, and hMPV+PIV3 vaccines; latent vaccines comprise cytomegalovirus, epstein-barr virus, human immunodeficiency virus, herpes simplex virus, and varicella- zoster virus vaccines; and public health vaccines consists of Zika and Nipah vaccines. The company also offers systemic secreted and cell surface therapeutics; cancer vaccines, such as personalized cancer, KRAS, and checkpoint vaccines; intratumoral immuno-oncology products; localized regenerative, systemic intracellular, and inhaled pulmonary therapeutics. It has strategic alliances with AstraZeneca PLC; Merck & Co., Inc.; Vertex Pharmaceuticals Incorporated; Vertex Pharmaceuticals (Europe) Limited; Carisma Therapeutics, Inc.; Metagenomi, Inc.; the Defense Advanced Research Projects Agency; Biomedical Advanced Research and Development Authority; Institute for Life Changing Medicines; and The Bill & Melinda Gates Foundation, as well as a collaboration and license agreement with Chiesi Farmaceutici S.P.A. The company was formerly known as Moderna Therapeutics, Inc. and changed its name to Moderna, Inc. in August 2018. Moderna, Inc. was founded in 2010 and is headquartered in Cambridge, Massachusetts.
- 3. Page 3 of 9 Any information in this report is not , and should not be regarded as investment advice or as a recommendation regarding any particular security or course of action. We recommend seeking a licensed professional for investment advice. Company Website https://www.modernatx.com Address 200 Technology Square, Cambridge, MA, United States, 02139 Fiscal Year End December Employees 3200 Technical Indicators Value Value Beta 1.70 52 Week High 497.49 Short Ratio 2.64 52 Week Low 119.01 Shorted Shares 17,062,779 200 Day Moving Average 237.28 Shorted Shares Previous Month 15,428,842 50 Day Moving Average 148.20 Shares Held By Insiders 942.70% Short Percentage 4.00% Shares Held by Institutions 64.18 Dividend Yield N/A
- 4. Page 4 of 9 Any information in this report is not , and should not be regarded as investment advice or as a recommendation regarding any particular security or course of action. We recommend seeking a licensed professional for investment advice. MRNA:NSD (Moderna Inc) Biotechnology | | Common Stock Stock Target Advisor Detailed Stock Report Report Date: 8th June, 2022 Market Performance Market Performance vs. Industry / Classification (Biotechnology) Market Performance vs. Exchange (Nasdaq Global Select) Value Sector Median Percentile Rank Grade Market Median Percentile Rank Grade YTD Capital Gain -42.78% -43.3% 51% -16.4% 27% Dividend Return N/A 1.0% N/A 1.0% N/A Total Return -42.78% -43.3% 51% -16.0% 27% Trailing 12 Months Capital Gain -31.77% -65.6% 79% -20.2% 42% Dividend Return N/A 1.6% N/A 2.3% N/A Total Return -31.77% -65.6% 79% -18.5% 42% Trailing 5 Years Capital Gain 37,166.67% -57.0% 99% 7.4% 99% Dividend Return N/A 13.2% N/A 11.0% N/A Total Return 37,166.67% -55.4% 99% 17.8% 99% Average Annual (5 Year Horizon) Capital Gain 694.57% 2.9% 98% 2.3% 99% Dividend Return N/A 9.4% N/A 1.8% N/A Total Return 694.57% 3.9% 98% 4.2% 99% Risk Return Profile Volatility (Standard Deviation) 1,005.35% 58.3% 3% 32.2% 2% Risk Adjusted Return 69.09% N/A 96% 20.5% 90% Market Capitalization 54.55B 0.12B 100% 0.33B 98%
- 5. Page 5 of 9 Any information in this report is not , and should not be regarded as investment advice or as a recommendation regarding any particular security or course of action. We recommend seeking a licensed professional for investment advice. Key Financial Ratios Ratios vs. Industry / Classification (Computer Hardware) Ratios vs. Exchange (Nasdaq Global Select) Value Sector Median Percentile Rank Grade Market Median Percentile Rank Grade Market Value peratio 4.0 7.9 57% 16.7 87% pbratio 3.2 1.8 29% 1.6 26% pcfratio 4.0 -2.5 7% 0.0 43% pfcfratio 2.8 0.6 24% 10.1 77% Management Effectiveness retequity 139.99% -57.5% 99% 0.5% 99% retinvcap 146.21% -54.2% 98% -0.5% 98% retass 50.42% -26.2% 100% 0.2% 100% debtequityratio N/A 20.7% N/A 32.3% N/A Technical Ratios yield N/A 1.9% N/A 2.6% N/A sratio 2.64 4.85 70% 3.06 55% spercent 5.75% 5.0% 45% 3.0% 31% beta 1.70 1.40 31% 1.09 19%
- 6. Page 6 of 9 Any information in this report is not , and should not be regarded as investment advice or as a recommendation regarding any particular security or course of action. We recommend seeking a licensed professional for investment advice. MRNA:NSD (Moderna Inc) Biotechnology | | Common Stock Stock Target Advisor Detailed Stock Report Report Date: 8th June, 2022 Recent Analyst Ratings Price Action Rating Action Analyst Rating Price date Maintains SVB Leerink Underperform USD 80 » USD 70 2022-06-07 Downgrades STA Research Underperform 2022-05-18 Target Down Piper Sandler Overweight USD 214 2022-05-18 Target Raised by Morgan Stanley Equal Weight USD 205 » USD 217 2022-04-12 Target Lowered by SVB Leerink Underperform USD 81 » USD 80 2022-03-25 Target Lowered by Deutsche Bank Capital Hold USD 175 » USD 155 2022-03-07 Maintains Morgan Stanley Equal-Weight USD 213 » USD 205 2022-02-28 Target Lowered by Jefferies Financial LLC Hold USD 200 » USD 170 2022-02-25 Maintains SVB Leerink Underperform USD 85 » USD 81 2022-02-25 Target Lowered by Barclays USD 404 » USD 210 2022-02-25 Downgrade STA Research Buy USD 300 » USD 200 2022-02-24 Maintains Morgan Stanley Equal-Weight USD 315 » USD 213 2022-02-01 Upgraded by Redburn Partners Sell » Neutral 2022-02-01 Maintains SVB Leerink Underperform USD 86 » USD 85 2022-01-28 Upgrades Deutsche Bank Capital Hold USD 175 2022-01-26 Initiates Coverage On UBS Neutral USD 221 2022-01-21 Upgrades Bank of America Securities Neutral USD 135 » USD 180 2022-01-21 Target Raised by Morgan Stanley Equal Weight USD 313 » USD 315 2022-01-18 Target Lowered by Argus USD 420 » USD 350 2022-01-06 Initiates Coverage On Cowen Market Perform USD 250 2021-12-07 Assigns STA Research Strong Buy USD 300 2021-11-15 Initiates Coverage On Wolfe Research Outperform USD 304 2021-11-09 Target Lowered by Piper Sandler Overweight USD 445 » USD 348 2021-11-05 Maintains SVB Leerink Underperform USD 85 » USD 86 2021-11-05 Maintains Barclays Overweight USD 463 » USD 404 2021-11-05
- 7. Page 7 of 9 Any information in this report is not , and should not be regarded as investment advice or as a recommendation regarding any particular security or course of action. We recommend seeking a licensed professional for investment advice. MRNA:NSD (Moderna Inc) Biotechnology | | Common Stock Stock Target Advisor Detailed Stock Report Report Date: 8th June, 2022 Annual Financial (USD)
- 8. Page 8 of 9 Any information in this report is not , and should not be regarded as investment advice or as a recommendation regarding any particular security or course of action. We recommend seeking a licensed professional for investment advice. MRNA:NSD (Moderna Inc) Biotechnology | | Common Stock Stock Target Advisor Detailed Stock Report Report Date: 8th June, 2022 Quarterly Financial (USD)
- 9. Page 9 of 9 Any information in this report is not , and should not be regarded as investment advice or as a recommendation regarding any particular security or course of action. We recommend seeking a licensed professional for investment advice. MRNA:NSD (Moderna Inc) Biotechnology | | Common Stock Stock Target Advisor Detailed Stock Report Report Date: 8th June, 2022 Largest Industry Peers for Biotechnology Symbol Company Name Price(Change) Market Cap VRTX Vertex Pharmaceuticals Inc +3.86 (+1.4%) USD 68.54B REGN Regeneron Pharmaceuticals Inc +4.95 (+0.8%) USD 66.90B ALXN Alexion Pharmaceuticals Inc N/A USD 40.34B BNTX BioNTech SE +0.81 (+0.5%) USD 38.32B RPRX Royalty Pharma plc +0.91 (+2.3%) USD 27.24B SGEN Seagen Inc +1.84 (+1.3%) USD 26.23B IMMU Immunomedics, Inc N/A USD 20.31B GMAB Genmab AS +0.96 (+3.2%) USD 19.73B ARGX argenx NV ADR +8.07 (+2.5%) USD 17.90B INCY Incyte Corporation +1.02 (+1.4%) USD 16.37B ETFs Containing MRNA Symbol Company Name Weight Mer Price(Change) Market Cap QBTL:CA AGFiQ US Market Neutral Anti-B.. 0.21 % 0.00 % +0.03 (+2.5%) USD 0.25B BBH VanEck Biotech ETF 0.00 % 0.35 % +2.35 (+2.5%) USD 0.44B IDNA iShares Genomics Immunology an.. 0.00 % 0.00 % +0.90 (+2.5%) USD 0.20B QQEQ:CA Invesco NASDAQ 100 Equal Weigh.. 0.00 % 0.00 % N/A N/A BBIG:CA Horizons Global BBIG Technolog.. 0.00 % 0.00 % N/A N/A FHH-F:CA First Trust AlphaDEX U.S. Heal.. 0.00 % 0.00 % N/A N/A TECB iShares U.S. Tech Breakthrough.. 0.00 % 0.00 % +0.36 (+2.5%) N/A GERM ETFMG Treatments Testing and A.. 0.00 % 0.00 % +0.65 (+2.5%) N/A ZINN:CA BMO MSCI Innovation Index ETF 0.00 % 0.00 % N/A N/A FTGU:XETRA First Trust Global Funds Publi.. 0.00 % 0.00 % -0.12 (2.5%) USD 0.10B The Stock Target Advisor platform run millions of calculations every day on over 30,000 Canadian and American stocks, comparing and ranking their financial and market performance against their sectors and exchange. We represent the percentile ranking using the following grading system. Letter Grade Percentage Letter Grade Percentage Letter Grade Percentage A+ 97%-100% A 93%-96% A- 90%-92% B+ 97%-89% B 83%-86% B- 80%-82% C+ 77%-79% C 73%-76% C- 70%-72% D+ 67%-69% D 63%-66% D- 60%-62% F 0%-59%