Entergy Corporation Detailed Stock Report

Entergy Corporation, together with its subsidiaries, engages in the production and distribution of electricity in the United States. It operates in two segments, Utility and Entergy Wholesale Commodities. Based on the Entergy Corporation stock forecasts from 12 analysts, the average analyst target price for Entergy Corporation is USD 132.25 over the next 12 months. Entergy Corporation’s average analyst rating is Under-perform. Stock Target Advisor’s own stock analysis of Entergy Corporation is Bearish, which is based on 4 positive signals and 10 negative signals. At the last closing, Entergy Corporation’s stock price was USD 118.31. Entergy Corporation’s stock price has changed by +1.72% over the past week, -4.74% over the past month and +12.12% over the last year.

Recommended
More Related Content
Similar to Entergy Corporation Detailed Stock Report
Similar to Entergy Corporation Detailed Stock Report (20)
More from Stock Target Advisor
More from Stock Target Advisor (20)
Recently uploaded
Recently uploaded (16)
Entergy Corporation Detailed Stock Report
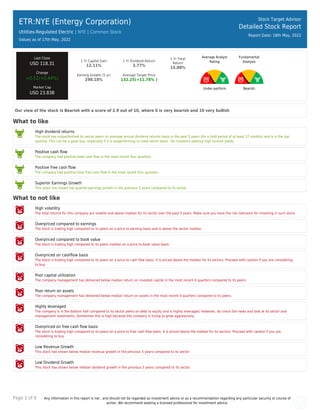
- 1. Page 1 of 9 Any information in this report is not , and should not be regarded as investment advice or as a recommendation regarding any particular security or course of action. We recommend seeking a licensed professional for investment advice. ETR:NYE (Entergy Corporation) Utilities-Regulated Electric | NYE | Common Stock Values as of 17th May, 2022 Stock Target Advisor Detailed Stock Report Report Date: 18th May, 2022 Last Close USD 118.31 Change +0.52(+0.44%) Market Cap USD 23.83B 1 Yr Capital Gain 12.11% 1 Yr Dividend Return 3.77% 1 Yr Total Return 15.88% Earning Growth (5 yr) 298.18% Average Target Price 132.25(+11.78% ) Average Analyst Rating Under-perform Fundamental Analysis Bearish Our view of the stock is Bearish with a score of 2.9 out of 10, where 0 is very bearish and 10 very bullish What to like High dividend returns The stock has outperformed its sector peers on average annual dividend returns basis in the past 5 years (for a hold period of at least 12 months) and is in the top quartile. This can be a good buy, especially if it is outperforming on total return basis , for investors seeking high income yields. Positive cash flow The company had positive total cash flow in the most recent four quarters. Positive free cash flow The company had positive total free cash flow in the most recent four quarters. Superior Earnings Growth This stock has shown top quartile earnings growth in the previous 5 years compared to its sector. What to not like High volatility The total returns for this company are volatile and above median for its sector over the past 5 years. Make sure you have the risk tolerance for investing in such stock. Overpriced compared to earnings The stock is trading high compared to its peers on a price to earning basis and is above the sector median. Overpriced compared to book value The stock is trading high compared to its peers median on a price to book value basis. Overpriced on cashflow basis The stock is trading high compared to its peers on a price to cash flow basis. It is priced above the median for its sectors. Proceed with caution if you are considering to buy. Poor capital utilization The company management has delivered below median return on invested capital in the most recent 4 quarters compared to its peers. Poor return on assets The company management has delivered below median return on assets in the most recent 4 quarters compared to its peers. Highly leveraged The company is in the bottom half compared to its sector peers on debt to equity and is highly leveraged. However, do check the news and look at its sector and management statements. Sometimes this is high because the company is trying to grow aggressively. Overpriced on free cash flow basis The stock is trading high compared to its peers on a price to free cash flow basis. It is priced above the median for its sectors. Proceed with caution if you are considering to buy. Low Revenue Growth This stock has shown below median revenue growth in the previous 5 years compared to its sector Low Dividend Growth This stock has shown below median dividend growth in the previous 5 years compared to its sector.
- 2. Page 2 of 9 Any information in this report is not , and should not be regarded as investment advice or as a recommendation regarding any particular security or course of action. We recommend seeking a licensed professional for investment advice. ETR:NYE (Entergy Corporation) Utilities-Regulated Electric | | Common Stock Stock Target Advisor Detailed Stock Report Report Date: 18th May, 2022 Adjusted Closing Share Volume Relative Returns Relative Performance (Total Returns) Security Capital Gain Dividend Return Total Return ETR Entergy Corporation +12.1% +3.8% +15.9% VTI Vanguard Index Funds - Vanguard Total Stock Market ETF -5.1% +1.4% -3.7% Company Overview Entergy Corporation, together with its subsidiaries, engages in the production and distribution of electricity in the United States. It operates in two segments, Utility and Entergy Wholesale Commodities. The Utility segment generates, transmits, distributes, and sells electric power in portions of Arkansas, Louisiana, Mississippi, and Texas, including the City of New Orleans; and distributes natural gas. The Entergy Wholesale Commodities segment is involved in the ownership, operation, and decommissioning of nuclear power plants located in the northern United States; sale of electric power to wholesale customers; provision of services to other nuclear power plant owners; and ownership of interests in non-nuclear power plants that sell electric power to wholesale customers. The company generates electricity through gas, nuclear, coal, hydro, and solar power sources. It sells energy to retail power providers, utilities, electric power co-operatives, power trading organizations, and other power generation companies. Its power plants have approximately 26,000 megawatts (MW) of electric generating capacity, which include 6,000 MW of nuclear power. The company delivers electricity to 3 million utility customers in Arkansas, Louisiana, Mississippi, and Texas. Entergy Corporation was founded in 1913 and is based in New Orleans, Louisiana.
- 3. Page 3 of 9 Any information in this report is not , and should not be regarded as investment advice or as a recommendation regarding any particular security or course of action. We recommend seeking a licensed professional for investment advice. Company Website https://www.entergy.com Address 639 Loyola Avenue, New Orleans, LA, United States, 70113 Fiscal Year End December Employees 12500 Technical Indicators Value Value Beta 0.64 52 Week High 125.73 Short Ratio 2.95 52 Week Low 95.73 Shorted Shares 3,297,414 200 Day Moving Average 109.69 Shorted Shares Previous Month 3,399,395 50 Day Moving Average 117.31 Shares Held By Insiders 36.60% Short Percentage 2.00% Shares Held by Institutions 90.95 Dividend Yield 3.45%
- 4. Page 4 of 9 Any information in this report is not , and should not be regarded as investment advice or as a recommendation regarding any particular security or course of action. We recommend seeking a licensed professional for investment advice. ETR:NYE (Entergy Corporation) Utilities-Regulated Electric | | Common Stock Stock Target Advisor Detailed Stock Report Report Date: 18th May, 2022 Market Performance Market Performance vs. Industry / Classification (Utilities-Regulated Electric) Market Performance vs. Exchange (Nasdaq Global Select) Value Sector Median Percentile Rank Grade Market Median Percentile Rank Grade YTD Capital Gain 5.02% 2.8% 60% -12.2% 85% Dividend Return 1.79% 1.4% 61% 1.0% 72% Total Return 6.82% 4.6% 65% -11.5% 86% Trailing 12 Months Capital Gain 12.11% 7.8% 69% -10.0% 86% Dividend Return 3.77% 3.8% 49% 2.8% 61% Total Return 15.88% 11.5% 77% -7.0% 86% Trailing 5 Years Capital Gain 56.14% 23.0% 81% 8.6% 74% Dividend Return 24.57% 18.1% 86% 13.1% 80% Total Return 80.72% 40.4% 81% 24.2% 79% Average Annual (5 Year Horizon) Capital Gain 9.54% 3.0% 85% 5.0% 61% Dividend Return 3.99% 3.5% 72% 2.1% 76% Total Return 13.52% 6.9% 85% 8.1% 66% Risk Return Profile Volatility (Standard Deviation) 18.05% 15.8% 39% 22.8% 61% Risk Adjusted Return 74.91% N/A 73% 40.9% 84% Market Capitalization 23.83B 17.44B 64% 1.98B 90%
- 5. Page 5 of 9 Any information in this report is not , and should not be regarded as investment advice or as a recommendation regarding any particular security or course of action. We recommend seeking a licensed professional for investment advice. Key Financial Ratios Ratios vs. Industry / Classification (Computer Hardware) Ratios vs. Exchange (Nasdaq Global Select) Value Sector Median Percentile Rank Grade Market Median Percentile Rank Grade Market Value peratio 22.4 20.9 41% 16.3 31% pbratio 2.0 1.7 32% 1.6 39% pcfratio 10.4 9.6 44% 7.2 39% pfcfratio 11.9 11.7 47% 10.8 45% Management Effectiveness retequity 9.11% 8.0% 56% 10.3% 46% retinvcap 4.49% 4.9% 37% 5.6% 44% retass 2.19% 2.8% 22% 2.6% 45% debtequityratio 212.22% 122.6% 5% 68.5% 15% Technical Ratios yield 3.45% 3.7% 45% 5.0% 38% sratio 2.95 2.48 37% 2.12 37% spercent 1.84% 1.2% 32% 3.6% 66% beta 0.64 0.45 36% 1.03 78%
- 6. Page 6 of 9 Any information in this report is not , and should not be regarded as investment advice or as a recommendation regarding any particular security or course of action. We recommend seeking a licensed professional for investment advice. ETR:NYE (Entergy Corporation) Utilities-Regulated Electric | | Common Stock Stock Target Advisor Detailed Stock Report Report Date: 18th May, 2022 Recent Analyst Ratings Price Action Rating Action Analyst Rating Price date Assigns Sanford Bernstein Market Perform USD 100 2022-05-17 Maintains RBC Royalbank Sector Perform USD 109 » USD 109 2022-05-17 Target Set by JP Morgan & Company USD 75 2022-05-16 Target Set by UBS USD 170 2022-05-16 Target Set by Credit Suisse USD 142 2022-05-16 Target Set by Warburg Research USD 177 2022-05-16 Target Set by Deutsche Bank Capital USD 210 2022-05-16 Target Set by Goldman Sachs USD 224 2022-05-16 Target Set by Berenberg Capital Markets USD 125 2022-05-16 Initiated by Credit Suisse Outperform 2022-04-25 Target Raised by Morgan Stanley Underweight USD 106 » USD 115 2022-04-20 Target Raised by Wells Fargo USD 120 » USD 135 2022-04-04 Maintains Morgan Stanley Underweight USD 105 » USD 100 2022-02-18 Target Lowered by Morgan Stanley Underweight USD 106 » USD 105 2022-01-21 Downgraded by Vertical Research Buy » Hold USD 117 2022-01-10 Downgrades Morgan Stanley Underweight USD 106 2022-01-06 Target Raised by Morgan Stanley Equal Weight USD 100 » USD 106 2021-12-21 Target Raised by Mizuho Securities Buy USD 114 » USD 117 2021-10-21 Maintains Morgan Stanley Equal-Weight USD 122 » USD 100 2021-10-19 Target Lowered by BMO Financial Outperform USD 121 » USD 117 2021-09-27 Maintains Mizuho Securities Buy USD 127 » USD 114 2021-09-21 Maintains Morgan Stanley Equal-Weight USD 123 » USD 122 2021-09-17 Target Raised by Mizuho Securities Buy USD 120 » USD 127 2021-08-23 Maintains Morgan Stanley Equal-Weight USD 117 » USD 123 2021-08-19 Target Raised by Wells Fargo Overweight USD 120 » USD 125 2021-08-17
- 7. Page 7 of 9 Any information in this report is not , and should not be regarded as investment advice or as a recommendation regarding any particular security or course of action. We recommend seeking a licensed professional for investment advice. ETR:NYE (Entergy Corporation) Utilities-Regulated Electric | | Common Stock Stock Target Advisor Detailed Stock Report Report Date: 18th May, 2022 Annual Financial (USD)
- 8. Page 8 of 9 Any information in this report is not , and should not be regarded as investment advice or as a recommendation regarding any particular security or course of action. We recommend seeking a licensed professional for investment advice. ETR:NYE (Entergy Corporation) Utilities-Regulated Electric | | Common Stock Stock Target Advisor Detailed Stock Report Report Date: 18th May, 2022 Quarterly Financial (USD)
- 9. Page 9 of 9 Any information in this report is not , and should not be regarded as investment advice or as a recommendation regarding any particular security or course of action. We recommend seeking a licensed professional for investment advice. ETR:NYE (Entergy Corporation) Utilities-Regulated Electric | | Common Stock Stock Target Advisor Detailed Stock Report Report Date: 18th May, 2022 Largest Industry Peers for Utilities-Regulated Electric Symbol Company Name Price(Change) Market Cap NEE NextEra Energy Inc +1.90 (+2.7%) USD 137.12B DUK Duke Energy Corporation -0.68 (-0.6%) USD 83.80B SO The Southern Company -0.10 (-0.1%) USD 78.25B D Dominion Energy Inc +0.56 (+0.7%) USD 67.90B DUK-PA Duke Energy Corporation -0.34 (-1.3%) USD 62.35B DCUE Dominion Energy Inc +0.27 (+0.3%) USD 61.51B NGG National Grid plc +1.77 (+2.3%) USD 53.81B ED Consolidated Edison Inc +0.46 (+0.5%) USD 33.67B WEC WEC Energy Group Inc +0.68 (+0.7%) USD 32.42B ES Eversource Energy +0.79 (+0.9%) USD 30.67B ETFs Containing ETR Symbol Company Name Weight Mer Price(Change) Market Cap FHU:CA First Trust AlphaDEX U.S. Util.. 0.00 % 0.78 % N/A USD 1.22M FXU First Trust Utilities AlphaDEX.. 0.00 % 0.63 % +0.39 (+0.6%) USD 0.28B HDLV UBS ETRACS Monthly Pay 2xLever.. 0.00 % 0.00 % N/A USD 0.02B NLR VanEck Vectors Uranium+Nuclear.. 0.00 % 0.60 % +1.08 (+0.6%) USD 0.05B RWU.B:CA 0.00 % 0.72 % N/A N/A XLUY Cushing Utility & MLP ETF 0.00 % 0.00 % N/A USD 1.07M ULOV:LSE UBS (Irl) ETF plc - Factor MSC.. 0.00 % 0.00 % N/A N/A CINF:CA CI Global Infrastructure Priva.. 0.00 % 0.00 % +0.14 (+0.6%) USD 0.39B The Stock Target Advisor platform run millions of calculations every day on over 30,000 Canadian and American stocks, comparing and ranking their financial and market performance against their sectors and exchange. We represent the percentile ranking using the following grading system. Letter Grade Percentage Letter Grade Percentage Letter Grade Percentage A+ 97%-100% A 93%-96% A- 90%-92% B+ 97%-89% B 83%-86% B- 80%-82% C+ 77%-79% C 73%-76% C- 70%-72% D+ 67%-69% D 63%-66% D- 60%-62% F 0%-59%