Albemarle Corporation (ALB) Stock Analysis Report

Albemarle Corporation develops, manufactures, and markets engineered specialty chemicals worldwide. It operates through three segments: Lithium, Bromine, and Catalysts. The Lithium segment offers lithium compounds, including lithium carbonate, lithium hydroxide. Based on the Albemarle Corporation stock forecasts from 13 analysts, the average analyst target price for Albemarle Corporation is USD 261.86 over the next 12 months. Albemarle Corporation’s average analyst rating is Hold . Stock Target Advisor’s own stock analysis of Albemarle Corporation is Slightly Bearish, which is based on 5 positive signals and 11 negative signals. At the last closing, Albemarle Corporation’s stock price was USD 243.15. Albemarle Corporation’s stock price has changed by +1.64% over the past week, +21.19% over the past month and +52.36% over the last year.

Recommended
Recommended
More Related Content
Similar to Albemarle Corporation (ALB) Stock Analysis Report
Similar to Albemarle Corporation (ALB) Stock Analysis Report (20)
More from Stock Target Advisor
More from Stock Target Advisor (20)
Recently uploaded
Recently uploaded (20)
Albemarle Corporation (ALB) Stock Analysis Report
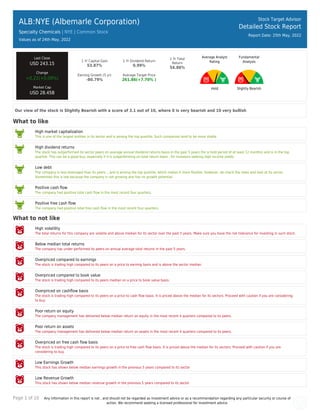
- 1. Page 1 of 10 Any information in this report is not , and should not be regarded as investment advice or as a recommendation regarding any particular security or course of action. We recommend seeking a licensed professional for investment advice. ALB:NYE (Albemarle Corporation) Specialty Chemicals | NYE | Common Stock Values as of 24th May, 2022 Stock Target Advisor Detailed Stock Report Report Date: 25th May, 2022 Last Close USD 243.15 Change +0.21(+0.09%) Market Cap USD 28.45B 1 Yr Capital Gain 53.87% 1 Yr Dividend Return 0.99% 1 Yr Total Return 54.86% Earning Growth (5 yr) -80.79% Average Target Price 261.86(+7.70% ) Average Analyst Rating Hold Fundamental Analysis Slightly Bearish Our view of the stock is Slightly Bearish with a score of 3.1 out of 10, where 0 is very bearish and 10 very bullish What to like High market capitalization This is one of the largest entities in its sector and is among the top quartile. Such companies tend to be more stable. High dividend returns The stock has outperformed its sector peers on average annual dividend returns basis in the past 5 years (for a hold period of at least 12 months) and is in the top quartile. This can be a good buy, especially if it is outperforming on total return basis , for investors seeking high income yields. Low debt The company is less leveraged than its peers ,, and is among the top quartile, which makes it more flexible. However, do check the news and look at its sector. Sometimes this is low because the company is not growing and has no growth potential. Positive cash flow The company had positive total cash flow in the most recent four quarters. Positive free cash flow The company had positive total free cash flow in the most recent four quarters. What to not like High volatility The total returns for this company are volatile and above median for its sector over the past 5 years. Make sure you have the risk tolerance for investing in such stock. Below median total returns The company has under performed its peers on annual average total returns in the past 5 years. Overpriced compared to earnings The stock is trading high compared to its peers on a price to earning basis and is above the sector median. Overpriced compared to book value The stock is trading high compared to its peers median on a price to book value basis. Overpriced on cashflow basis The stock is trading high compared to its peers on a price to cash flow basis. It is priced above the median for its sectors. Proceed with caution if you are considering to buy. Poor return on equity The company management has delivered below median return on equity in the most recent 4 quarters compared to its peers. Poor return on assets The company management has delivered below median return on assets in the most recent 4 quarters compared to its peers. Overpriced on free cash flow basis The stock is trading high compared to its peers on a price to free cash flow basis. It is priced above the median for its sectors. Proceed with caution if you are considering to buy. Low Earnings Growth This stock has shown below median earnings growth in the previous 5 years compared to its sector Low Revenue Growth This stock has shown below median revenue growth in the previous 5 years compared to its sector
- 2. Page 2 of 10 Any information in this report is not , and should not be regarded as investment advice or as a recommendation regarding any particular security or course of action. We recommend seeking a licensed professional for investment advice. Low Dividend Growth This stock has shown below median dividend growth in the previous 5 years compared to its sector.
- 3. Page 3 of 10 Any information in this report is not , and should not be regarded as investment advice or as a recommendation regarding any particular security or course of action. We recommend seeking a licensed professional for investment advice. ALB:NYE (Albemarle Corporation) Specialty Chemicals | | Common Stock Stock Target Advisor Detailed Stock Report Report Date: 25th May, 2022 Adjusted Closing Share Volume Relative Returns Relative Performance (Total Returns) Security Capital Gain Dividend Return Total Return ALB Albemarle Corporation +52.4% +1% +53.3% VTI Vanguard Index Funds - Vanguard Total Stock Market ETF -9.4% +1.4% -8.1% Company Overview Albemarle Corporation develops, manufactures, and markets engineered specialty chemicals worldwide. It operates through three segments: Lithium, Bromine, and Catalysts. The Lithium segment offers lithium compounds, including lithium carbonate, lithium hydroxide, lithium chloride, and lithium specialties; and reagents, such as butyllithium and lithium aluminum hydride for use in lithium batteries for consumer electronics and electric vehicles, high performance greases, thermoplastic elastomers for car tires, rubber soles, plastic bottles, catalysts for chemical reactions, organic synthesis processes in the areas of steroid chemistry and vitamins, life sciences, pharmaceutical industry, and other markets. It also provides cesium products for the chemical and pharmaceutical industries; zirconium, barium, and titanium products for pyrotechnical applications that include airbag initiators; technical services for the handling and use of reactive lithium products; and lithium-containing by-products recycling services. The Bromine segment offers bromine and bromine-based fire safety solutions; specialty chemicals, including elemental bromine, alkyl and inorganic bromides, brominated powdered activated carbon, and other bromine fine chemicals for use in chemical synthesis, oil and gas well drilling and completion fluids, mercury control, water purification, beef and poultry processing, and other industrial applications; and other specialty chemicals, such as tertiary amines for surfactants, biocides, and disinfectants and sanitizers. The Catalysts segment provides hydroprocessing, isomerization, and akylation catalysts; fluidized catalytic cracking catalysts and additives; and organometallics and curatives. The company serves the energy storage, petroleum refining, consumer electronics, construction, automotive, lubricants, pharmaceuticals, and crop protection markets. Albemarle Corporation was founded in 1887 and is headquartered in Charlotte, North Carolina. Address: 4250 Congress Street, Charlotte, NC, United States, 28209
- 4. Page 4 of 10 Any information in this report is not , and should not be regarded as investment advice or as a recommendation regarding any particular security or course of action. We recommend seeking a licensed professional for investment advice. Company Website https://www.albemarle.com Address 4250 Congress Street, Charlotte, NC, United States, 28209 Fiscal Year End December Employees 6000 Technical Indicators Value Value Beta 1.55 52 Week High 290.40 Short Ratio 1.63 52 Week Low 156.98 Shorted Shares 1,493,545 200 Day Moving Average 227.02 Shorted Shares Previous Month 1,501,663 50 Day Moving Average 211.38 Shares Held By Insiders 33.60% Short Percentage 2.00% Shares Held by Institutions 83.12 Dividend Yield 0.67%
- 5. Page 5 of 10 Any information in this report is not , and should not be regarded as investment advice or as a recommendation regarding any particular security or course of action. We recommend seeking a licensed professional for investment advice. ALB:NYE (Albemarle Corporation) Specialty Chemicals | | Common Stock Stock Target Advisor Detailed Stock Report Report Date: 25th May, 2022 Market Performance Market Performance vs. Industry / Classification (Specialty Chemicals) Market Performance vs. Exchange (Nasdaq Global Select) Value Sector Median Percentile Rank Grade Market Median Percentile Rank Grade YTD Capital Gain 4.01% -16.1% 79% -13.3% 86% Dividend Return 0.17% 0.4% 7% 1.0% 8% Total Return 4.18% -14.7% 79% -12.4% 85% Trailing 12 Months Capital Gain 53.87% -9.2% 93% -11.0% 95% Dividend Return 0.99% 1.4% 32% 2.8% 18% Total Return 54.86% -7.0% 93% -8.2% 95% Trailing 5 Years Capital Gain 115.96% 3.3% 100% 5.3% 90% Dividend Return 6.45% 7.9% 33% 12.8% 20% Total Return 122.41% 13.5% 100% 20.9% 89% Average Annual (5 Year Horizon) Capital Gain 30.93% 9.8% 86% 4.8% 89% Dividend Return 1.60% 1.6% 48% 2.1% 38% Total Return 32.53% 12.0% 86% 8.0% 89% Risk Return Profile Volatility (Standard Deviation) 65.64% 34.6% 20% 22.8% 12% Risk Adjusted Return 49.56% N/A 73% 40.2% 61% Market Capitalization 28.45B 3.58B 84% 1.11B 91%
- 6. Page 6 of 10 Any information in this report is not , and should not be regarded as investment advice or as a recommendation regarding any particular security or course of action. We recommend seeking a licensed professional for investment advice. Key Financial Ratios Ratios vs. Industry / Classification (Computer Hardware) Ratios vs. Exchange (Nasdaq Global Select) Value Sector Median Percentile Rank Grade Market Median Percentile Rank Grade Market Value peratio 101.6 23.7 9% 16.1 6% pbratio 4.7 2.2 14% 1.6 16% pcfratio 82.6 15.2 7% 7.1 4% pfcfratio 48.3 11.4 2% 10.9 6% Management Effectiveness retequity 6.07% 13.0% 28% 10.0% 37% retinvcap 9.70% 9.7% 51% 5.5% 66% retass 4.37% 5.0% 40% 2.5% 68% debtequityratio 35.63% 75.7% 83% 68.5% 70% Technical Ratios yield 0.67% 1.6% 13% 3.1% 9% sratio 1.63 2.77 76% 2.12 58% spercent 1.45% 2.0% 62% 3.6% 71% beta 1.55 1.27 24% 1.03 18%
- 7. Page 7 of 10 Any information in this report is not , and should not be regarded as investment advice or as a recommendation regarding any particular security or course of action. We recommend seeking a licensed professional for investment advice. ALB:NYE (Albemarle Corporation) Specialty Chemicals | | Common Stock Stock Target Advisor Detailed Stock Report Report Date: 25th May, 2022 Recent Analyst Ratings Price Action Rating Action Analyst Rating Price date Maintains RBC Royalbank Outperform USD 300 » USD 314 2022-05-24 Maintains Deutsche Bank Capital Buy USD 290 » USD 320 2022-05-24 Maintains Wells Fargo Overweight USD 285 » USD 320 2022-05-24 Maintains KeyBanc Underweight USD 215 » USD 217 2022-05-24 Upgraded by Wells Fargo Equal Weight » Overweight 2022-05-11 Target Raised by RBC Royalbank USD 276 » USD 300 2022-05-10 Target Raised by Cowen USD 275 » USD 300 2022-05-06 Target Raised by Deutsche Bank Capital USD 250 » USD 290 2022-05-06 Target Raised by Oppenheimer Holdings USD 307 » USD 368 2022-05-06 Target Raised by Citigroup USD 262 » USD 279 2022-05-06 Target Raised by Mizuho Securities USD 243 » USD 293 2022-05-06 Target Raised by KeyBanc USD 163 » USD 198 2022-04-05 Target Lowered by Robert W Baird USD 245 » USD 228 2022-02-22 Target Lowered by RBC Royalbank Outperform USD 290 » USD 270 2022-02-22 Target Lowered by Bank of America Securities USD 230 » USD 216 2022-02-19 Target Lowered by BMO Financial USD 300 » USD 280 2022-02-18 Maintains Mizuho Securities Neutral USD 281 » USD 243 2022-02-18 Target Lowered by Citigroup USD 280 » USD 244 2022-02-18 Maintains KeyBanc Underweight USD 153 » USD 163 2022-02-18 Upgraded by Bank of America Securities Underperform » Neutral 2022-02-01 Upgrades HSBC Buy USD 250 » USD 280 2022-01-27 Target Lowered by Citigroup USD 323 » USD 280 2022-01-11 Maintains KeyBanc Underweight USD 144 » USD 153 2022-01-10 Downgraded by Goldman Sachs Neutral » Sell USD 199 » USD 205 2021-12-15 Reiterated by Evercore ISI Buy USD 295 2021-11-21
- 8. Page 8 of 10 Any information in this report is not , and should not be regarded as investment advice or as a recommendation regarding any particular security or course of action. We recommend seeking a licensed professional for investment advice. ALB:NYE (Albemarle Corporation) Specialty Chemicals | | Common Stock Stock Target Advisor Detailed Stock Report Report Date: 25th May, 2022 Annual Financial (USD)
- 9. Page 9 of 10 Any information in this report is not , and should not be regarded as investment advice or as a recommendation regarding any particular security or course of action. We recommend seeking a licensed professional for investment advice. ALB:NYE (Albemarle Corporation) Specialty Chemicals | | Common Stock Stock Target Advisor Detailed Stock Report Report Date: 25th May, 2022 Quarterly Financial (USD)
- 10. Page 10 of 10 Any information in this report is not , and should not be regarded as investment advice or as a recommendation regarding any particular security or course of action. We recommend seeking a licensed professional for investment advice. ALB:NYE (Albemarle Corporation) Specialty Chemicals | | Common Stock Stock Target Advisor Detailed Stock Report Report Date: 25th May, 2022 Largest Industry Peers for Specialty Chemicals Symbol Company Name Price(Change) Market Cap LIN Linde plc +0.07 (+0.0%) USD 158.45B SHW The Sherwin-Williams Company -1.62 (-0.6%) USD 67.10B APD Air Products and Chemicals Inc -1.13 (-0.5%) USD 52.77B ECL Ecolab Inc -2.63 (-1.6%) USD 45.56B LYB LyondellBasell Industries N.V -0.27 (-0.3%) USD 35.34B IFF International Flavors & Fragra.. -0.57 (-0.4%) USD 32.86B DD DuPont de Nemours Inc -0.83 (-1.3%) USD 32.47B PPG PPG Industries Inc -1.35 (-1.1%) USD 28.27B AVTR Avantor Inc -0.13 (-0.4%) USD 19.24B WLK Westlake Chemical Corporation -1.68 (-1.3%) USD 16.20B ETFs Containing ALB Symbol Company Name Weight Mer Price(Change) Market Cap FTC First Trust Large Cap Growth A.. 0.00 % 0.61 % -0.75 (0.0%) USD 0.91B GNRX VanEck Vectors Generic Drugs E.. 0.00 % 0.55 % N/A USD 3.35M IYM iShares U.S. Basic Materials E.. 0.00 % 0.00 % -1.16 (0.0%) USD 1.13B LIT Global X Funds - Global X Lith.. 0.00 % 0.75 % -1.55 (0.0%) USD 4.26B NOBL 0.00 % 0.35 % N/A N/A PYZ Invesco DWA Basic Materials Mo.. 0.00 % 0.60 % -1.29 (0.0%) USD 0.19B QCLN First Trust NASDAQ Clean Edge .. 0.00 % 0.60 % -1.77 (0.0%) USD 1.91B XT iShares Exponential Technologi.. 0.00 % 0.47 % -1.12 (0.0%) USD 3.29B MID American Century Mid Cap Growt.. 0.00 % 0.00 % -1.28 (0.0%) N/A VCAR Simplify Volt RoboCar Disrupti.. 0.00 % 0.00 % -0.17 (0.0%) N/A The Stock Target Advisor platform run millions of calculations every day on over 30,000 Canadian and American stocks, comparing and ranking their financial and market performance against their sectors and exchange. We represent the percentile ranking using the following grading system. Letter Grade Percentage Letter Grade Percentage Letter Grade Percentage A+ 97%-100% A 93%-96% A- 90%-92% B+ 97%-89% B 83%-86% B- 80%-82% C+ 77%-79% C 73%-76% C- 70%-72% D+ 67%-69% D 63%-66% D- 60%-62% F 0%-59%